

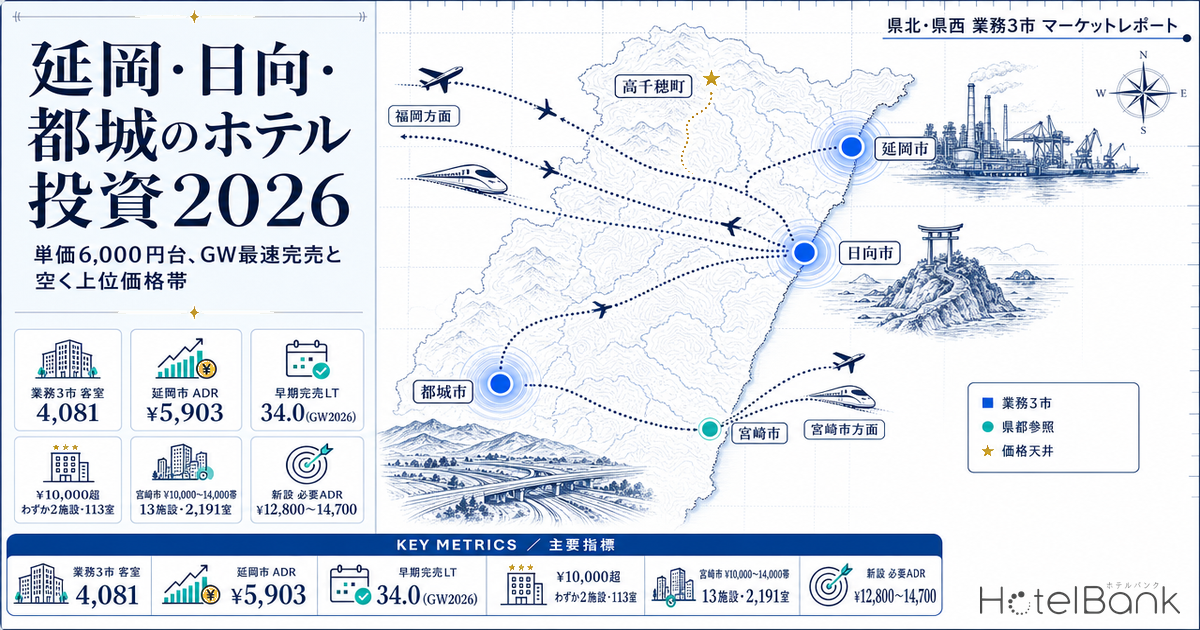
When Miyazaki Prefecture’s lodging market is discussed as an investment target, the conversation has centred on two things: mountain tourism in Takachiho, and the sports-camp demand in Miyazaki City. This article covers neither. Its subject is the prefecture’s three business cities — Nobeoka and Hyuga in the north and Miyakonojo in the west. A company town built around Asahi Kasei, an industrial city with the port of Hosojima, and the prefecture’s second-largest city by population. All three rest on a base of weekday business demand, and their supply-demand shape differs from the prefectural capital’s.
A word first on how this sits against our earlier work. HotelBank has previously mapped the prefecture-level price-band distribution in Miyazaki & Saga Hotel Investment Whitespace, and treated Takachiho as a gap in mountain luxury. Here, Takachiho is referenced only as the ceiling on prices within the prefecture, and the subject is the mid-price band in the three business cities. The geography does not overlap with our other published Kyushu area pieces either, such as Kagoshima’s intra-prefecture ADR hierarchy.
Three things are tested. First, how the prefecture’s ADR hierarchy splits across three tiers — mountain tourism, the capital, and the three business cities. Second, how tight supply and demand actually are in those three cities, measured on room-level inventory data for a peak date that has already passed (Golden Week 2026). Third, what ADR a new build would need in order to work, reverse-calculated from construction cost per unit of floor area, and how far that sits from today’s levels.
Metric Definitions Used in This Article
- ADR (average daily rate) = an estimated settled rate (tax-exclusive equivalent) calculated by applying property-type correction coefficients to the lowest published plan level each property lists on OTAs and similar channels (two guests per room, per-room rate, tax included). Cross-checked against property-level actuals disclosed by listed hotel REITs (91 properties, most recent three months), the median error is approximately 7%. These are estimates and differ from each property’s actual transaction prices and accounting figures. Area-level ADR is the median of the properties covered (the level of a typical property in that area).
- Listed price (all-plan average, tax included) = the average across every plan published on OTAs and similar channels. Because it spans room-only through to meal-inclusive plans, it sits above the estimated settled ADR. This article keeps the two clearly distinguished.
- OCC (occupancy rate) = the share of sold rooms against total rooms within an area (an estimate based on OTA sales inventory). Used only at macro units such as prefecture and municipality; occupancy for individual properties is not calculated.
- LT (lead time) = the number of days until the check-in date. LT0 = same day.
- Earliest sellout LT = the lead time at which remaining rooms first reached zero (a larger value means the property sold out earlier). Days with a sellout observed = the cumulative number of days on which zero remaining rooms were recorded.
- Data sources: MetroEngines Research & Consulting / Ministry of Internal Affairs and Communications and Ministry of Economy, Trade and Industry, “Economic Census for Business Activity” / Ministry of Land, Infrastructure, Transport and Tourism, National Land Numerical Information, Published Land Prices, and Building Construction Statistics Survey
Key Takeaways
- Miyazaki’s ADR hierarchy splits into three tiers. Takachiho Town at ¥16,039 (N=13) is the ceiling, Miyazaki City at ¥8,036 (N=55-58) the middle, and the three business cities sit below: Miyakonojo ¥6,408 / Hyuga ¥6,174 / Nobeoka ¥5,903. All are estimated settled ADR averaged over the most recent 12 months (August 2025 – July 2026).
- Of the 38 properties in the three business cities for which an ADR could be calculated, only 2 properties and 113 rooms sit above ¥10,000. Within the same prefecture, Miyazaki City holds 13 properties and 2,191 rooms in the ¥10,000-14,000 band — the upper-middle band is open on the three cities’ side.
- On room-level inventory for Golden Week 2026 (May 2-5), 4 of the 6 fastest-selling properties are in Nobeoka and 1 in Miyakonojo. Nobeoka’s median of LT34.0 compares with LT9.0 in Miyazaki City — roughly 25 days earlier to sell out (business and city hotels with 40+ rooms; N=5 Nobeoka, N=17 Miyazaki City).
- The demand base checks out. Within 1 km of Nobeoka Station there are 1,417 establishments and 7,598 workers; within 1 km of Miyakonojo City Hall, 943 and 7,680; within 1 km of Hyuga-shi Station, 890 and 5,061. Weekday business depth is measurable in all three cities.
- A new 100-room build needs an ADR of ¥12,800-14,700 to clear an 8% yield (select-service specification, OCC 70-80%). That is some distance from current levels, which for now tilts the odds towards acquiring and repositioning existing stock rather than building.
Three tiers — Takachiho ¥16,039, Miyazaki City ¥8,036, the three business cities ¥5,900-6,400
Start with the price hierarchy inside the prefecture. Smoothing estimated settled ADR over the most recent 12 months (August 2025 – July 2026) and breaking it out by municipality, Miyazaki splits cleanly into three tiers. Takachiho Town tops the list at ¥16,039, the prefectural capital of Miyazaki City follows at ¥8,036, and the three business cities line up below that. The prefecture-wide average is ¥6,913, and all three cities fall under it.
The three tiers have quite different characters. Takachiho Town is small at 13 properties, but it is the only place in the prefecture where multiple properties sustain rates above ¥20,000: Ryokan Shinsen (13 rooms) at ¥71,139, Kamikakure (8 rooms) at ¥49,517, and Hotel Shikimi (20 rooms) at ¥26,212. Solest Takachiho Hotel, at 67 rooms, holds ¥16,316 — so even a property with scale can clear ¥15,000. It is not that upper-band demand does not exist in Miyazaki Prefecture, and that is worth holding onto as a premise for everything that follows.
Miyazaki City, the middle tier, is where the prefecture’s room stock is concentrated: 107 properties and 8,519 rooms within a 7 km radius, plus a demand peak no other prefecture has in quite the same form — spring sports camps. Viewing the prefecture’s monthly series as a year-on-year overlay makes that seasonality obvious.
February sets the annual high every year: ¥8,454 in February 2024, ¥8,047 in February 2025, and ¥8,962 in February 2026 — up 11.4% year on year. Narrowing to Miyazaki City, February 2025’s ¥10,761 rose to ¥12,582 in February 2026, up 16.9%. According to the prefecture’s own figures, the economic impact of spring camps and training sessions over January-March 2026 was ¥12.627 billion, up 27.1% year on year, driven chiefly by larger crowds at the Samurai Japan Miyazaki spring camp 2026. In a market where demand concentrates into a single month, the ceiling on price is set by events — and that is exactly what the numbers show.
The third tier is the three business cities: Miyakonojo ¥6,408, Hyuga ¥6,174, Nobeoka ¥5,903. On level alone that puts them at the bottom of the prefecture, but what matters here is not the level — it is the shape of the distribution. The chapters that follow look at what has accumulated in these three cities, from both the demand base and the inventory side.
Demand base — 1,417 establishments and 7,598 workers within 1 km of Nobeoka Station; business depth is measurable in all three cities
To judge a price-band gap as an investment target, you first have to confirm that the location carries the demand to support that band. Drawing on the “Economic Census for Business Activity” from the Ministry of Internal Affairs and Communications and the Ministry of Economy, Trade and Industry, we aggregated the employment structure within a 1 km radius of each city centre. Alongside that, using the Ministry of Land, Infrastructure, Transport and Tourism’s National Land Numerical Information projections by 250 m mesh, we set out resident population within a 1.5 km radius and the 2040 projection.
| Central point | Establishments (1 km radius) | Workers (1 km radius) | Office-sector worker share | Residents 2025 (1.5 km radius) | 2040 projection | 2025→2040 | Senior share 2025 |
|---|---|---|---|---|---|---|---|
| Miyazaki Station area | 3,760 | 34,115 | 23.4% | 44,885 | 43,270 | -3.6% | 26.2% |
| Nobeoka Station area | 1,417 | 7,598 | 13.4% | 22,429 | 18,696 | -16.6% | 32.8% |
| Miyakonojo City Hall area | 943 | 7,680 | 11.7% | 15,626 | 13,780 | -11.8% | 32.7% |
| Hyuga-shi Station area | 890 | 5,061 | 14.8% | 20,221 | 17,705 | -12.4% | 32.1% |
Relative to the prefectural capital, business depth in the three cities is modest. In absolute terms, however, 7,598 workers sit within 1 km of Nobeoka Station, 7,680 within 1 km of Miyakonojo City Hall, and 5,061 within 1 km of Hyuga-shi Station. That is a sufficient base of weekday demand for a single 100-room hotel to draw on, and the three cities’ room stock (96 properties, 4,081 rooms) does in fact rest on this employment base. The low office-sector share of 11-15% reflects an industrial structure weighted towards manufacturing, logistics and wholesale — which reads as a foundation of business travel, construction and technical-services stays that do not depend on head-office functions.
On the residential side, all three cities are contracting towards 2040. But the source of lodging demand is employment and visitation rather than resident population itself, and those two need to be assessed separately. Mapping the resident distribution around Nobeoka Station by mesh, population is dense from the east side of the station along the Gokase River — its centre of gravity offset from the commercial concentration in front of the station.
| Miyazaki City | ¥100,103/m² | +2.08% |
| Nobeoka City | ¥46,900/m² | -0.28% |
| Hyuga City | ¥41,500/m² | -0.01% |
| Miyakonojo City | ¥33,550/m² | +0.15% |
| Miyazaki City, Tachibanadori-nishi 3-chome | ¥316,000/m² |
| Miyakonojo City, Kamikawahigashi 4-chome | ¥72,500/m² |
| Nobeoka City, Chuo-dori 2-chome | ¥70,000/m² |
| Hyuga City, Kanmachi 1-chome | ¥61,200/m² |
Land values in all three cities sit at a third to a half of Miyazaki City’s, with rates of change close to flat. A light land-acquisition burden is one of the few favourable conditions available while construction costs stay elevated. Assuming 100 rooms on a 1,200 m² site, land works out at just ¥560,000 per room in Nobeoka, ¥500,000 in Hyuga and ¥400,000 in Miyakonojo. Because land accounts for only about 2-3% of total investment, project economics are effectively determined by two variables — construction cost and ADR. We return to this in the reverse-calculation later.
Golden Week 2026 inventory — 5 of the 6 fastest sellouts are in the three business cities
The reality of supply and demand is checked against room-level inventory data for a confirmed peak date. The period used here is Golden Week 2026 — the four days from May 2 to May 5. Those dates have already passed, so whether a property sold out is settled fact.
The sample is limited to properties whose OTA-published allocation was at least 30% of total rooms during the period. Of 719 properties in the prefecture, inventory data could be obtained for 229; after excluding those below the 30% threshold, 180 properties remain. Where the published allocation is small, the property may be running on direct sales through its own site, travel agents or corporate contracts, or adding inventory as check-in approaches — so a low remaining-room count does not mean the property as a whole is full, and those cases are left out.
| Rank | Property | City | Rooms | Average earliest sellout LT | Dates with a sellout observed | Cumulative days with a sellout | Estimated settled ADR 12-month average |
|---|---|---|---|---|---|---|---|
| 1 | APA Hotel Miyazaki Nobeoka Chuo | Nobeoka City | 93 | 34.5 | 2 of 4 | 27 | ¥6,752 |
| 2 | Vessel Hotel Miyakonojo | Miyakonojo City | 128 | 34.5 | 4 of 4 | 16 | ¥9,804 |
| 3 | En City Hotel Nobeoka | Nobeoka City | 125 | 34.0 | 3 of 4 | 75 | ¥7,390 |
| 4 | HOTEL AZ Miyazaki Tano | Miyazaki City | 91 | 34.0 | 3 of 4 | 98 | ¥5,548 |
| 5 | APA Hotel Miyazaki Nobeoka Ekimae | Nobeoka City | 192 | 34.0 | 2 of 4 | 14 | ¥7,206 |
| 6 | Nobeoka Urban Hotel | Nobeoka City | 95 | 33.0 | 1 of 4 | 29 | ¥5,938 |
| 7 | Miyakonojo Sun Plaza Hotel | Miyakonojo City | 82 | 29.3 | 3 of 4 | 47 | ¥6,497 |
| 8 | HOTEL AZ Miyazaki Nobeoka | Nobeoka City | 91 | 29.2 | 4 of 4 | 88 | ¥5,566 |
| 9 | Hotel Route Inn Miyazaki Tachibanadori | Miyazaki City | 213 | 27.0 | 2 of 4 | 46 | ¥8,645 |
| 10 | Hyuga Daiichi Hotel | Hyuga City | 100 | 26.0 | 2 of 4 | 26 | ¥6,209 |
| 11 | Hotel Route Inn Miyakonojo | Miyakonojo City | 203 | 26.0 | 3 of 4 | 55 | ¥7,901 |
| 12 | Toyoko Inn Miyazaki Ekimae | Miyazaki City | 200 | 25.7 | 3 of 4 | 33 | ¥7,869 |
| 13 | K’s Street Hotel Miyazaki | Miyazaki City | 156 | 21.0 | 2 of 4 | 32 | ¥7,349 |
| 14 | Hotel Brisbane’s | Miyazaki City | 134 | 17.5 | 2 of 4 | 34 | ¥5,967 |
The top of the ranking belongs to the three business cities. Four of the top six are in Nobeoka and one is in Miyakonojo; the first Miyazaki City entry is HOTEL AZ Miyazaki Tano at fourth (a suburban location in the former Tano-cho area), and the highest-placed station-front or central property is Hotel Route Inn Miyazaki Tachibanadori at LT27.0. Taking city medians across business and city hotels with 40+ rooms gives LT34.0 in Nobeoka (N=5) against LT9.0 in Miyazaki City (N=17). Nobeoka sells its rooms out roughly 25 days earlier. Miyakonojo is at LT16.2 (N=6) and Hyuga at LT13.0 (N=2) — both ahead of Miyazaki City.
An asymmetry of scale sits behind that gap. Miyazaki City carries 8,519 rooms within 7 km, so inventory tends to last through even a holiday peak. The three cities’ combined stock of 4,081 rooms is less than half of that, and when demand concentrates it is absorbed quickly. “Low rates” and “unsold rooms” are two different things, and the Golden Week measurement points, if anything, to how quickly these three cities clear inventory.
The individual absorption patterns are readable too. Nobeoka Urban Hotel (95 rooms), for the May 2 check-in, went from 40 rooms remaining at LT53 down to 19 in a single step at LT52, held flat at 19-20 through to LT35, then hit zero at LT33. Two rooms came back between LT24 and LT20, and it sold out again at LT19. Vessel Hotel Miyakonojo (128 rooms), for May 3, first recorded zero at LT34, then added inventory back — 19 rooms at LT33, up to 46 at LT25 — before clearing again from LT13 onward. Inventory returning in blocks of five or more rooms and persisting for three days or longer reads more naturally as the hotel releasing additional rooms than as a cancellation cycle.
Hyuga Daiichi Hotel (100 rooms) opened 41 rooms of inventory at LT38 and reached zero at LT22. Comfort Hotel Miyazaki (179 rooms) traced a long absorption curve from 106 rooms at LT54, down to 2 remaining at LT25 and zero at LT21. Clearing 179 rooms at a holiday peak is a solid showing for a large property in the prefectural capital. The three cities and Miyazaki City differ both in how inventory comes on and in how fast it clears — which is another way of saying that revenue-management design should be treated as a separate exercise even within the same prefecture. Differences in when bookings arrive by property type are set out for ryokan, city and business hotels in Miyazaki booking curves by property type.
Positioning — of 38 properties in the three cities, only 2 with 113 rooms clear ¥10,000
The two axes used so far — estimated settled ADR and earliest sellout LT — are now overlaid on a single chart. Property-level estimated settled ADR (12-month average) runs along the horizontal axis, average earliest sellout LT for Golden Week 2026 up the vertical, and circle size represents room count. Colours separate the cities.
On the right-hand side of the scatter, there is not a single property from the three business cities above an ADR of ¥10,000. Everything plotted there is from Miyazaki City’s station-front and coastal group. And the properties high on the vertical axis — the ones that sell out early — are the three cities’ properties clustered in the low-ADR band to the left. The group with the strongest absorption sits at the very bottom of the price range. That is what this chart is for.
The same structure shows up from the supply-density side. Properties with a calculable ADR within a 6-7 km radius of each city were tallied by price band.
| Estimated settled ADR band | Nobeoka City properties / rooms | Hyuga City properties / rooms | Miyakonojo City properties / rooms | 3 cities total properties / rooms | Miyazaki City properties / rooms |
|---|---|---|---|---|---|
| Under ¥8,000 | 15 / 1,188 | 5 / 393 | 13 / 1,250 | 33 / 2,831 | 22 / 2,186 |
| ¥8,000-10,000 | 0 / 0 | 2 / 98 | 1 / 128 | 3 / 226 | 12 / 1,696 |
| ¥10,000-14,000 | 0 / 0 | 0 / 0 | 2 / 113 | 2 / 113 | 13 / 2,191 |
| ¥14,000-18,000 | 0 / 0 | 0 / 0 | 0 / 0 | 0 / 0 | 1 / 41 |
| ¥18,000 and above | 0 / 0 | 0 / 0 | 0 / 0 | 0 / 0 | 1 / 30 |
The numbers are unambiguous. Of the 38 properties in the three business cities, 33 (86.8%) cluster below ¥8,000, and only 2 properties with 113 rooms clear ¥10,000. In Nobeoka, all 15 properties with a calculable ADR fall below ¥8,000.
What matters here is that those two properties genuinely work. Hotel Terrasta Miyakonojo (93 rooms, ¥10,130) and Hotel Nakayamaso (20 rooms, ¥11,526) are live examples of rates above ¥10,000 holding up in the three business cities. The former in particular sustains that level at a meaningful 93-room scale, which shows that the assumption that “¥10,000 is impossible in a regional business market” is not factually true.
For comparison, Miyazaki City has 13 properties and 2,191 rooms in the ¥10,000-14,000 band: JR Kyushu Hotel Miyazaki (141 rooms, ¥12,945), Art Hotel Miyazaki Sky Tower (131 rooms, ¥11,326), Richmond Hotel Miyazaki Ekimae (201 rooms, ¥10,652), Green Rich Hotel Miyazaki Tachibanadori 2 (163 rooms, ¥10,262) and Hotel JAL City Miyazaki (210 rooms, ¥10,047), with the 100-200-room class forming the bulk of it. Within one prefecture and on the same customer flows, this band works in the capital and has yet to form in the three business cities. That is the gap this article is about.
Dense Under ¥8,000 — 33 properties, 2,831 rooms
The core of the three business cities. This is where the properties that achieved some of the prefecture’s fastest absorption at Golden Week 2026 are concentrated. The demand base is thick enough that occupancy is not the concern.
Gap ¥10,000-14,000
Only 2 properties and 113 rooms across the three cities, against 13 properties and 2,191 rooms in Miyazaki City. Room remains on the three cities’ side. A 100-150-room upper-middle product is the indicative range.
Reference Takachiho ¥16,039
The ceiling on prices within the prefecture, and proof that demand exists here to sustain rates above ¥20,000 across multiple properties. The context is mountain tourism, though, so the demand source differs from the three business cities.
Supply-demand depth — estimated occupancy of 85.0% for business hotels and 91.9% for city hotels
Whether a price-band gap becomes an investment opportunity depends on whether occupancy backs it up. Estimated occupancy for Miyazaki Prefecture, based on OTA-listed inventory, was aggregated by property type for August 2026.
| Property type | Properties | Rooms | Estimated OCC August 2026 |
|---|---|---|---|
| All properties | 231 | 12,377 | 85.9% |
| Business hotels | 77 | 7,162 | 85.0% |
| City hotels | 18 | 1,931 | 91.9% |
| Deluxe | 2 | 357 | 89.9% |
| Resort | 15 | 1,759 | 84.8% |
| Ryokan | 37 | 540 | 83.7% |
Taking the same month at municipality level gives 88.9% in Nobeoka (17 properties, 1,161 rooms), 89.4% in Miyakonojo (22 properties, 1,572 rooms), 90.6% in Hyuga (16 properties, 532 rooms) and 88.2% in Miyazaki City (78 properties, 7,291 rooms) — all three cities at or above the capital. August is a peak month and the figures should be discounted accordingly, but the three business cities clearly do not lag the capital on supply-demand balance.
That city hotels top the list at 91.9% is telling in itself. Miyazaki’s city-hotel segment is small at 18 properties and 1,931 rooms, and demand concentrates there. Read the other way, it is a number that reflects how thin the upper-middle tier is. Note also that from October 2026 a demand-stimulus programme runs across seven Kyushu prefectures including Miyazaki, so near-term occupancy needs to be read with that effect included.
Reverse-calculating the ADR a new build needs — ¥12,800-14,700 for 100 select-service rooms, ¥10,900-16,900 at construction cost ±15%
If the gap were to be filled by new construction, what ADR would be required? The reverse-calculation here uses, unchanged, the per-room floor-area figures from HotelBank’s earlier analysis of hotel construction cost per room.
That analysis measured a median floor area of 35.0 m² per room across 31 single-use hotel projects (6,025 rooms in total) based on the Ministry of Land, Infrastructure, Transport and Tourism’s Building Construction Statistics Survey, and multiplied it by 2025 hotel-use cost per tsubo (3.31 m²) — ¥1.952 million across all structures, ¥2.405 million for steel-frame, ¥2.026 million for reinforced concrete — to arrive at a median construction cost of ¥20.67 million per room. It also showed that floor area per room correlates inversely with room count, with the 13 projects of 200+ rooms converging on a median of 25.7 m² per room. A 100-room select-service property of the kind these three cities would plausibly support is closer to the latter. Two specifications are therefore used here.
| Specification | Floor area per room | Cost per tsubo | Building construction cost | + FF&E, design supervision, pre-opening (×1.25) |
|---|---|---|---|---|
| A. Select-service | 25.0 m²/room | ¥2.405m/tsubo (steel frame) | ¥18.19m/room | ¥22.73m/room |
| B. Standard specification | 35.0 m²/room (median) | ¥1.952m/tsubo (all structures) | ¥20.67m/room | ¥25.83m/room |
Land is then added. For 100 rooms on a 1,200 m² site at 2026 average commercial land prices, land per room comes to ¥560,000 in Nobeoka, ¥500,000 in Hyuga and ¥400,000 in Miyakonojo. Total investment works out at ¥23.14-23.30 million per room under Specification A (roughly ¥2.3 billion for 100 rooms) and ¥26.24-26.40 million under Specification B (roughly ¥2.6 billion).
On that basis, we solve for the ADR needed to deliver an 8% GOP yield (GOP = gross operating profit, the hotel-operations-level profit after operating costs are deducted from revenue and before depreciation, interest and rent). Total revenue is assumed to be room revenue plus 10% for breakfast and other income, and the GOP margin is set at 45% of total revenue (a conservative figure for select-service in a regional location).
| Case (100 rooms, Nobeoka City) | OCC 70% | OCC 75% | OCC 80% |
|---|---|---|---|
| Specification A, construction cost -15% | ¥12,580 | ¥11,741 | ¥11,007 |
| Specification A, base case | ¥14,737 | ¥13,754 | ¥12,895 |
| Specification A, construction cost +15% | ¥16,894 | ¥15,768 | ¥14,782 |
| Specification B, base case | ¥16,697 | ¥15,584 | ¥14,610 |
The required ADR is ¥12,900-14,700 in the base case, and moving construction cost ±15% puts it in a ¥11,000-16,900 range. The distance from the three cities’ current ADR of ¥5,903-6,408 is not small. But that means not “a new build cannot reach this band” so much as “building for this band presupposes a product designed around roughly ¥13,000”. Given that Hotel Terrasta Miyakonojo sustains ¥10,130 across 93 rooms, ¥13,000 is not on the straight-line extension of today’s market — but as a target for a differently conceived product, it remains open to argument.
The other route is acquiring and repositioning existing stock. On the same assumptions (45% GOP margin, 8% yield), we solved for the maximum total investment per room — acquisition plus renovation — that each achieved ADR would support.
| Achieved ADR | OCC 70% | OCC 75% | OCC 80% |
|---|---|---|---|
| ¥7,000 (current median of the 3 cities) | ¥11.07m/room | ¥11.86m/room | ¥12.65m/room |
| ¥8,000 | ¥12.65m/room | ¥13.55m/room | ¥14.45m/room |
| ¥10,000 (the level achieved in Miyakonojo) | ¥15.81m/room | ¥16.94m/room | ¥18.07m/room |
| ¥12,000 | ¥18.97m/room | ¥20.33m/room | ¥21.68m/room |
At an ADR of ¥10,000 and OCC of 75% (both estimate assumptions), an 8% yield holds at up to ¥16.94 million per room. Against the ¥23.14 million per room a new build requires, that leaves ¥6.2 million per room of headroom — ¥620 million over 100 rooms. With a deep pool of existing stock in the three cities at 96 properties and 4,081 rooms, there is room within that spread to create an upper-middle product through acquisition and renovation — and that is this article’s practical conclusion.
Investment summary — the timeline for each of the three cities
| City | Estimated settled ADR 12-month average | Supply (properties / rooms) | Golden Week 2026 median earliest sellout LT | Workers (1 km radius) | Commercial land price (rate of change) | Strengths and room to move |
|---|---|---|---|---|---|---|
| Nobeoka City | ¥5,903 | 34 / 1,613 | 34.0 (N=5) | 7,598 | ¥46,900 -0.28% | Among the fastest inventory absorption in the prefecture. Nothing has formed above ¥8,000, leaving the largest opening for an upper-middle tier. |
| Miyakonojo City | ¥6,408 | 38 / 1,821 | 16.2 (N=6) | 7,680 | ¥33,550 +0.15% | The only one of the three cities with two properties working above ¥10,000. With the upper band already proven, a follow-on product is easier to design. |
| Hyuga City | ¥6,174 | 24 / 647 | 13.0 (N=2) | 5,061 | ¥41,500 -0.01% | The thinnest room stock at 647 rooms, so a single property carries outsized relative weight. Residential land prices are the strongest of the three at +1.82%. |
| (Reference) Miyazaki City | ¥8,036 | 107 / 8,519 | 9.0 (N=17) | 34,115 | ¥100,103 +2.08% | 13 properties and 2,191 rooms in the ¥10,000-14,000 band. The reference market where the tier the three cities are aiming for already exists. |
What the three cities share is a structure in which demand absorption is already proven while the price ladder has only one rung. Thirty-three properties and 2,831 rooms are gathered below ¥8,000, and everything above that is empty. Miyazaki City sustains 13 properties and 2,191 rooms in the ¥10,000-14,000 band, so there is no shortage of precedent within the prefecture. Takachiho goes further, with multiple properties supporting rates above ¥20,000.
On a timeline, Miyakonojo is the nearest term. It has the track record of two properties above ¥10,000, and the lowest land prices of the three (¥33,550/m²), which helps on acquisition cost. Nobeoka has the most room to move. Its Golden Week absorption is among the fastest in the prefecture and it has a business base of 7,598 workers, yet not a single property sits above ¥8,000. Hyuga is where one property counts for most. At a market size of 647 rooms, a single 100-room property entering would change the composition of supply.
In every case, the realistic near-term answer lies in acquiring and repositioning existing stock. At an ADR of ¥10,000 and OCC of 75% (estimate assumptions), the investment ceiling stands at ¥16.94 million per room, comfortably clear of the ¥23.14 million per room a new build requires. Add one rung to the price ladder in a market where demand is already established — that is how the investment opportunity in these three business cities sorts out.
⚠ On the analysis period: the estimated settled ADR figures in this article use only months with confirmed actuals through July 2026. Months from August 2026 onward would be estimates based on the selling prices listed on OTAs and similar channels at the time of the survey, and are excluded from trend reading. The inventory-absorption data covers May 2-5, 2026 — dates that have already passed — and is not a sellout forecast for future dates.
Further reading
- Miyazaki & Saga Hotel Investment Whitespace: Zero Hotels at ¥18-25k
- Kagoshima’s Capital Is Its Cheapest: ADR ¥6,819 vs Kirishima ¥14,330
- Miyazaki Booking Curves by Type: Ryokan +13.8pt Fri→Sat, City Capped
- Hotel Build Times: 2.80-Year Median, 1.96 Solo vs 4.00 Mixed-Use
References and sources
■ Data sources
Estimated settled ADR is the monthly series for 18 municipalities in Miyazaki Prefecture over the most recent 12 months (August 2025 – July 2026), smoothed as a 12-month average (N=3-58 properties per municipality per month; N=87 properties at property level). The inventory-absorption data covers Golden Week 2026 (May 2-5, 2026), aggregated from the 229 properties out of 719 in Miyazaki Prefecture for which inventory could be observed, then narrowed to the 180 whose OTA-published allocation was at least 30% of total rooms. Estimated OCC is an August 2026 figure by property type, based on OTA-listed inventory (231 properties, 12,377 rooms). Employment structure comes from small-area aggregation of the Economic Census for Business Activity (2021); resident population from National Land Numerical Information’s future population projections by 250 m mesh; construction cost per unit of floor area from the Building Construction Statistics Survey; and land prices from Published Land Prices (2026).
■ Estimate assumptions
The required-ADR estimate for a new build is based on 100 rooms in Nobeoka City under two specifications — A (select-service, 25.7 m² per room) and B (mid-scale full-service, 35.0 m² per room) — with building construction cost multiplied by 1.25 to add FF&E, design supervision fees and pre-opening costs. Land is included at a 1,200 m² site and each city’s average commercial land price. Total revenue adds 10% to room revenue for breakfast and other income (×1.10), the GOP margin is set at 45% of total revenue (a conservative figure for select-service in a regional location), and the target GOP yield is 8%. The OCC values of 70%, 75% and 80% and the construction cost of ±15% used in the sensitivity analysis are all assumptions used in the estimate, not actual figures.
■ Limitations and caveats
(1) Estimated settled ADR applies property-type coefficients to the lowest plan published on OTAs; cross-checked against property-level disclosures from listed hotel REITs, the median error is approximately 7%. It does not match any individual property’s actual transaction prices or accounting figures. (2) Estimated OCC is based on the absorption rate of OTA-listed inventory and does not capture inventory outside OTAs, such as direct sales, corporate contracts or travel-agent blocks. It is used only at macro units, and occupancy for individual properties is not calculated. (3) The inventory-absorption data covers dates that have already passed and is not a forecast. (4) The construction-cost and yield figures are simplified estimates; an actual investment decision requires a detailed feasibility study.
■ Proprietary data
- MetroEngines Research & Consulting — estimated settled ADR (N=3-58 properties per municipality per month; N=87 properties at property level), room-level inventory-absorption data (obtained for 229 of 719 properties in Miyazaki Prefecture, with the 180 at an OTA-published allocation of 30% or more aggregated), and estimated occupancy based on OTA-listed inventory
■ Government statistics and public data
- Ministry of Internal Affairs and Communications and Ministry of Economy, Trade and Industry, “Economic Census for Business Activity (2021)” (boundaries = 2020 Population Census small areas, e-Stat Statistical GIS)
- Ministry of Land, Infrastructure, Transport and Tourism, National Land Numerical Information, “Future Population Projections by 250 m Mesh (2024 National Institute of Population and Social Security Research projection)”
- Ministry of Land, Infrastructure, Transport and Tourism, “Building Construction Statistics Survey (Building Starts Statistics Survey)” — floor area per room and hotel-use cost per tsubo
- Ministry of Land, Infrastructure, Transport and Tourism, “Published Land Prices” (2026, as of January 1, 2026)
- Miyazaki Prefecture, “Results for sports camps and training sessions hosted from outside the prefecture, FY2025” (Miyazaki Prefecture Sportsland Promotion Division)
- Miyazaki Prefecture official tourism site “Miyazaki Kanko Navi”, professional baseball spring camps 2026
■ City-level land price aggregation
- Tochidai Data, “Land prices and published land prices in Miyazaki Prefecture (2026)” (municipality-level aggregation of the Ministry of Land, Infrastructure, Transport and Tourism’s Published Land Prices)
■ Related published analysis
- Miyazaki & Saga Hotel Investment Whitespace (prefecture-level price-band distribution)