

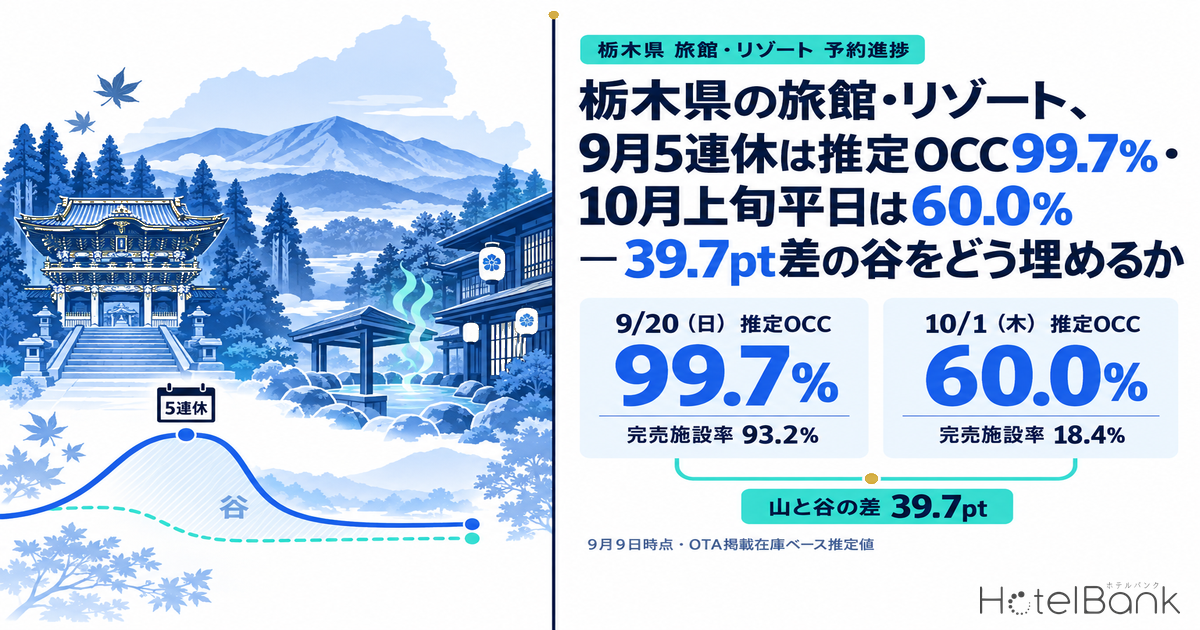
September 19–23, 2026 is Silver Week — a five-day holiday run, the first in 11 years. Tracking booking progress at ryokan and resort hotels in Tochigi Prefecture, September 20 (Sun), the middle day of the run, had already reached an estimated OCC (OTA-listed inventory basis) of 88.4% at 45 days before the stay date (ryokan, 145 properties in scope), climbing to 99.7% as of September 9 (146 properties) with a sold-out property rate of 93.2%. At the same September 9 reading, however, October 1 (Thu) sits at just 60.0% (147 properties) with a sold-out property rate of 18.4%. Measured on the same observation date, the gap between the peak and the trough is 39.7 points. This article breaks down the September holiday peak and the early-October weekday trough for Tochigi ryokan and resort hotels using estimated OCC and sold-out property rate alone, and sets out what can still be put in place for the trough dates in the three weeks that remain.
Scope: ryokan in Tochigi Prefecture (144–147 properties in scope, approx. 5,650–5,751 rooms) and resort hotels (26–27 properties in scope, approx. 1,743–1,779 rooms), both on a major-booking-site listing basis. This article deals only with occupancy (an estimate on an OTA-listed inventory basis) and sold-out property rate; it does not address price levels. Definitions for both are at the end of the article. Data as of September 10, 2026 (latest observation date September 9, 2026).
- — The middle day of the holiday run was settled at T-45: ryokan on September 20 (Sun) posted an estimated OCC of 88.4% at 45 days before the stay date and 99.7% as of September 9, 2026 (146 properties in scope). Pickup from T-45 was 11.3 points, leaving almost no room for last-minute levers to work.
- — The trough dates are not “unsold” so much as “unresponsive”: ryokan on October 1 (Thu) moved from 57.2% at T-45 to 60.0% as of September 9 — only +2.8 points over 23 days. The peak-to-trough gap is 39.7 points.
- — That inertia stands out against other prefectures too: line up ryokan in seven onsen prefectures on the same two stay dates and the same observation date, and September 20 clusters at 99.3–99.7% everywhere, while pickup on October 1 is smallest in Tochigi at +2.8 points (the other six range from +4.5 to +9.3 points).
- — Treat each day of the holiday run as a separate product: September 22 (Tue) added +22.6 points from T-45, the largest pickup within the run, while September 23 (Wed) stalled at 68.0%. October’s three-day weekend repeats the same shape — October 10 at 83.2% against October 12 at 58.7%.
- — Summer weekdays and autumn weekdays are structurally different: in August’s settled results the day-of-week spread was compressed to 5.7 points for ryokan and 5.0 points for resort hotels, whereas from late September the day-to-day swings are wide. Recycling the weekday tactics that worked in summer is unlikely to carry over.
The middle day of the five-day run was “decided at T-45”
Start with the holiday run itself. How the five-day run came about, and its early booking pace, were covered in Silver Week 2026: 5-Day Holiday Returns After 11 Years. Silver Week 2026 runs September 19 (Sat) and 20 (Sun) into Respect for the Aged Day (Mon, September 21), a Citizens’ Holiday (Tue, September 22) and Autumnal Equinox Day (Wed, September 23). At Tochigi ryokan, estimated OCC for September 20 (Sun) was 88.4% at 45 days before the stay date (145 properties in scope, sold-out property rate 54.5%), 93.7% at 30 days out (146 properties, 69.2%), and 99.7% at the latest observation on September 9 — 11 days before the stay date (146 properties, 93.2%). Pickup from T-45 to the latest reading is only 11.3 points. In other words, most of the inventory for this date had already cleared by T-45, and what moved over the following five weeks was only the small remainder.
Resort hotels show the same shape: September 20 was 89.3% at T-45 (26 properties in scope, sold-out property rate 30.8%), 96.4% at T-30 (26 properties, 61.5%) and 99.8% as of September 9 (26 properties, 88.5%). For both ryokan and resorts, this date arrives at the holiday with essentially no headroom left to “fill in close to arrival”.
Within the run, the shape varies sharply by date. September 22 (Tue), the Citizens’ Holiday, started slow at 67.5% at T-45 (145 properties in scope, sold-out property rate 16.6%) but built to 90.1% by September 9 (146 properties, 60.3%) — pickup of 22.6 points from T-45, the largest within the run. By contrast the closing day, September 23 (Wed, Autumnal Equinox Day), went from 53.4% at T-45 (147 properties, 11.6%) to 68.0% as of September 9 (147 properties, 18.4%), pickup of 14.6 points, with the sold-out property rate still under 20%. The travel-home day at the end of a run does not become a lodging-demand peak, even across five days.
Source: MetroEngines Research; compiled by the HotelBank Editorial Team
Overlaying the curves makes the difference plain. September 20 starts high at T-45 and then tracks almost flat against the ceiling. September 22 stalls around 70% from T-45 through T-30 before the gradient steepens from roughly 20 days out — the classic “late-surge” profile. September 23 has the same shape, but the surge is shallower. And October 1 moves from 57.2% at T-45 to 60.0% as of September 9 — 2.8 points over 23 days. That curve is very nearly horizontal.
Peak and trough on a fixed frame — T-45, T-30 and the latest reading
The table below cuts the same stay dates at three points: 45 days out, 30 days out and the latest observation (September 9, 2026). How to read these three points is set out in Read Booking Curves at 3 Points. Note that October 1–3 are all snapshots with 22–24 days still to run before the stay date, and are not settled figures.
| Stay date | Segment | T-45 OCC (sold-out rate) | T-30 OCC (sold-out rate) | Sep 9 OCC (sold-out rate) | Properties in scope |
|---|---|---|---|---|---|
| Sep 20 (Sun) | Ryokan | 88.4% (54.5%) | 93.7% (69.2%) | 99.7% (93.2%) | 145–146 |
| Sep 20 (Sun) | Resort | 89.3% (30.8%) | 96.4% (61.5%) | 99.8% (88.5%) | 26 |
| Sep 22 (Tue) | Ryokan | 67.5% (16.6%) | 69.8% (27.4%) | 90.1% (60.3%) | 145–146 |
| Sep 22 (Tue) | Resort | 76.3% (18.5%) | 78.6% (18.5%) | 94.3% (44.4%) | 27 |
| Sep 23 (Wed) | Ryokan | 53.4% (11.6%) | 57.9% (13.6%) | 68.0% (18.4%) | 147 |
| Sep 23 (Wed) | Resort | 52.1% (11.1%) | 61.4% (14.8%) | 72.6% (14.8%) | 27 |
| Oct 1 (Thu) | Ryokan | 57.2% (17.9%) | 57.7% (18.4%) | 60.0% (18.4%) | 145–147 |
| Oct 1 (Thu) | Resort | 54.7% (14.8%) | 56.5% (3.7%) | 60.1% (11.1%) | 27 |
| Oct 2 (Fri) | Ryokan | 61.0% (9.0%) | 65.0% (11.6%) | 68.1% (13.6%) | 145–147 |
| Oct 2 (Fri) | Resort | 69.8% (14.8%) | 66.7% (14.8%) | 69.0% (14.8%) | 27 |
| Oct 3 (Sat) | Ryokan | 72.0% (19.2%) | 75.9% (25.3%) | 78.9% (26.7%) | 146 |
| Oct 3 (Sat) | Resort | 70.9% (22.2%) | 78.1% (22.2%) | 80.0% (25.9%) | 27 |
Source: MetroEngines Research; compiled by the HotelBank Editorial Team
The resort hotel segment has a small base at 26–27 properties in scope, so the sold-out property rate moves in 3.7-point increments on a single property’s inventory decision. The drop in the October 1 sold-out property rate from 14.8% at T-45 to 3.7% at T-30 is most naturally read as properties whose listed inventory briefly became unavailable and was then put back on sale — it does not necessarily signal demand weakening. With small-base segments, it is safer to look at the level and the direction rather than a single month’s movement.
The early-October weekday trough — the September 9 cross-section
Next, view the stay dates side by side as a cross-section. The chart below shows how far each stay date from September 19 to October 12 had built up as of one common observation date, September 9, 2026 (10–33 days remain to each stay date, all within a 45-day lead time).
Source: MetroEngines Research; compiled by the HotelBank Editorial Team
For ryokan, the peak is 99.7% on September 20 and 21; the level falls to 68.0% by September 23, then runs broadly in a band from the low 60s to the high 70s from September 24 through October 9. Across the October 1–9 weekdays, October 1 (Thu) is the lowest at 60.0%, followed by October 8 (Thu) at 64.5%, October 5 (Mon) at 64.7%, October 7 (Wed) at 65.8%, October 6 (Tue) at 65.9% and October 2 (Fri) at 68.1%. Sold-out property rates over this stretch stay between 13.0% and 27.4%, so inventory clearly remains in the market as a whole. (All as of September 9, 2026; ryokan, 145–147 properties in scope.)
The resort hotel trough is deeper: September 30 (Wed) 49.6%, October 6 (Tue) 50.8%, October 7 (Wed) 51.9%, October 5 (Mon) 55.9% and October 8 (Thu) 58.7% (all 27 properties in scope). October 1 (Thu) is 60.1%, essentially level with ryokan. The gap between September 20 and October 1 is 39.7 points for ryokan and 39.7 points for resorts — near-identical across both segments. Dependence on the holiday run shows up as a structural feature of the area as a whole rather than of any one property type.
Within this trough stretch, Saturdays stand relatively higher (October 3: ryokan 78.9%, resorts 80.0%; October 10: ryokan 83.2%, resorts 80.1%), as does October 10 (Sat), the first day of the three-day weekend that includes Sports Day. October 11 (Sun) is 75.9% for ryokan and 72.8% for resorts, and October 12 (Mon, Sports Day) is 58.7% for ryokan and 67.7% for resorts — the same “the closing day does not build” shape seen over the September run (all as of September 9; ryokan 144–146 properties, resorts 27 properties).
Source: MetroEngines Research; compiled by the HotelBank Editorial Team
Compare pickup from T-45 to the September 9 reading and the holiday side is all double digits: ryokan September 22 +22.6 points, September 23 +14.6 points, September 20 +11.3 points; resorts September 23 +20.5 points, September 22 +18.0 points. Against that, October 1 is +2.8 points for ryokan and +5.4 points for resorts, and October 8 is +3.1 points for ryokan and +8.5 points for resorts. Resorts on October 2 are at −0.8 points — more listed inventory than at T-45. The trough dates should be read not as “not yet filled” but as “not moving”.
What summer’s settled results say about day-of-week structure — and why peak foliage is still outside the window
For comparison, August’s settled results (daily actuals for the elapsed month) were averaged by day of week. Tochigi ryokan: Monday 85.4%, Tuesday 85.7%, Wednesday 86.7%, Thursday 86.3%, Friday 88.8%, Saturday 91.1%, Sunday 87.4%, monthly average 87.4% (119–144 properties in scope). Resort hotels: Monday 90.8%, Tuesday 93.8%, Wednesday 94.2%, Thursday 95.1%, Friday 95.1%, Saturday 95.8%, Sunday 94.5%, monthly average 94.1% (23–27 properties in scope). The day-of-week spread is at most 5.7 points for ryokan and 5.0 points for resorts.
| Segment | Mon | Tue | Wed | Thu | Fri | Sat | Sun | Monthly avg. |
|---|---|---|---|---|---|---|---|---|
| Ryokan (119–144 properties) | 85.4% | 85.7% | 86.7% | 86.3% | 88.8% | 91.1% | 87.4% | 87.4% |
| Resort (23–27 properties) | 90.8% | 93.8% | 94.2% | 95.1% | 95.1% | 95.8% | 94.5% | 94.1% |
Source: MetroEngines Research; compiled by the HotelBank Editorial Team (daily actuals for August 2026 averaged by day of week)
August is settled actuals while early October is a mid-course snapshot with 22–28 days still to run, so the bases differ and the levels cannot be compared directly. What can be read is the difference in the shape of demand. During the summer holidays the whole market runs high and the weekday-to-weekend spread compresses into the 5-point range, whereas from late September into early October the day-to-day swings are wide and weekdays separate clearly from holidays. Weekday tactics that worked on the summer calendar will not necessarily work on autumn weekdays.
Note that the single biggest concern for Tochigi properties — peak autumn foliage, meaning stay dates from late October through November — falls outside this article’s observation window. Booking curves here are based on observations from 45 days before the stay date to the present, and as of September 10, 2026 the numbers only support discussion up to just before late October. For stay dates from late October onward we do not draw conclusions about progress from current listing status; they are better treated purely as a design target for what to put in place now. Put the other way: lock the foliage-season sales design this week and its effect can be verified on the curve once those dates enter the observation window.
The same dates in other prefectures — is the trough’s inertia specific to Tochigi?
So far the peak and trough have been compared only within Tochigi. But a level such as “60.0% on October 1” could well appear in other prefectures too. So for the ryokan segment, the same two stay dates (September 20 and October 1) were re-aggregated for seven prefectures with onsen destinations, on the same observation date (September 9, 2026) and the same definitions.
| Prefecture | Sep 20 T-45 | Sep 20 Sep 9 | Oct 1 T-45 | Oct 1 Sep 9 | Oct 1 pickup | Peak–trough gap | Properties in scope |
|---|---|---|---|---|---|---|---|
| Tochigi | 88.4% | 99.7% | 57.2% | 60.0% | +2.8pt | 39.7pt | 146–147 |
| Gunma | 90.0% | 99.7% | 60.4% | 68.3% | +7.9pt | 31.4pt | 183–184 |
| Nagano | 87.4% | 99.4% | 63.1% | 68.8% | +5.7pt | 30.6pt | 284–286 |
| Shizuoka | 81.7% | 99.5% | 48.8% | 58.1% | +9.3pt | 41.4pt | 308 |
| Fukushima | 87.8% | 99.3% | 58.5% | 64.2% | +5.7pt | 35.1pt | 126 |
| Niigata | 86.1% | 99.6% | 59.6% | 66.7% | +7.1pt | 32.9pt | 143 |
| Yamanashi | 84.0% | 99.6% | 60.1% | 64.6% | +4.5pt | 35.0pt | 89–90 |
Source: MetroEngines Research; compiled by the HotelBank Editorial Team (ryokan segment only; observed September 9, 2026)
On the holiday side all seven prefectures are essentially level, with September 20 converging at 99.3%–99.7%. The middle day of a five-day run selling out is not a Tochigi phenomenon; it is common to onsen destinations generally. The differences appear on the trough side. Levels on October 1 are low in Shizuoka at 58.1% and Tochigi at 60.0%, and higher in Nagano at 68.8% and Gunma at 68.3%. More important than the level, though, is the pickup. Over the 23 days from T-45 to September 9, Shizuoka moved +9.3 points, Gunma +7.9 points and Niigata +7.1 points, while Tochigi moved +2.8 points — the smallest of the seven. Shizuoka, at a comparably low level, is building steadily; Tochigi’s October 1 is barely responding.
What this comparison shows is that Tochigi’s trough is not “deeper than other prefectures” but “slower-moving than other prefectures”. Looking only at levels and concluding that “autumn weekdays are much the same everywhere” hides that difference. A trough that is filling and a trough that has stopped call for different moves in the remaining three weeks, and Tochigi’s early-October weekdays are closer to the latter. Note that the comparison is limited to the ryokan segment: in the resort hotel segment, some prefectures have single-digit property counts, which will not support a like-for-like comparison. Similar fixed-point comparisons have been run for Gifu’s five-day September holiday and Shizuoka ryokan and resort hotels.
What to put in place for the October 1–2 trough — a practical order of operations
October 1 (Thu) and 2 (Fri) still have roughly three weeks to the stay date, so they are in the window where levers can still work. As noted, though, these two dates have barely moved since T-45. Left alone, they are likely to track at the same level right up to arrival. In practice it works to take them in this order: (1) how inventory is presented, (2) the value of the stay itself, (3) the demand channels being worked.
(1) Revisit how the stay window is set. October 2 (Fri) is at 68.1% for ryokan and 69.0% for resorts, while the following day, October 3 (Sat), is at 78.9% and 80.0% — a gap of around 10 points between Friday and Saturday. Designing the Friday–Saturday pair as a single two-night product creates room to pull part of the Saturday-only demand forward into Friday. Conversely, for Thursday October 1, both neighbours are low (Wednesday September 30 at 63.9% for ryokan, and Friday October 2), so either a Wed–Thu or a Thu–Fri two-night stay is easy to build. Rather than applying a minimum-stay requirement across the board, it is less likely to lose single-night demand if you build a separate product whose value increases on a multi-night stay.
(2) Create weekday-only value in the stay. What separates 99.7% on the holiday from 60.0% on a weekday is the constraint, common to both ryokan and resorts, that guests can only come when they are off work. Loosening that constraint is a matter of what the stay contains, not of price. Bring check-in forward, make late check-out standard, widen the hours for private onsen baths and dining on weekdays — and show these “it is more comfortable on a weekday” elements at the level of the product name and the photography. An uncrowded weekday is inherently high-value; many properties simply have not put that into words on the product page.
(3) Separate the demand channels. The demand that fills a weekday trough is a different set of guests from the demand that fills a holiday. Secure weekday-specific routes to segments with flexible dates: repeat guests from nearby, senior weekday travel, corporate training and incentive trips, small groups. The important thing here is not to reuse holiday messaging on weekdays. A date that reaches 88.4% at T-45, like September 20, and a date that moves 2.8 points in 23 days, like October 1, are being looked at by fundamentally different customers.
(4) Protect the remaining holiday inventory. September 20 and 21 have sold-out property rates above 90% as of September 9 (ryokan 93.2% and 92.5%). Any allocation you still hold on those dates is scarce inventory in this market. Applying trough-filling tactics wholesale to the peak dates means giving up rate you could otherwise have captured. Setting the trough and the peak separately is the basic principle.
For revenue managers running ryokan and resort hotels in Tochigi — implications and an action plan
Operator’s-eye insights
1. The September holiday run is something to review, not something to act on. The market on September 20 was at 88.4% for ryokan and 89.3% for resorts at T-45, and 99.7% and 99.8% as of September 9. If your property has not sold out that date yet, the cause is not last-minute selling power but the design work done before T-45. Post-mortems on this holiday belong in next year’s preparation for the same period.
2. The trough dates are not “unsold”, they are “unresponsive”. The market for October 1 moved only 2.8 points, from 57.2% at T-45 to 60.0% as of September 9. If your own curve for that date is similarly flat, waiting is unlikely to fill it naturally close to arrival. Moving it requires a change on the product side — that is how the curve should be read.
3. Do not over-react to small-base indicators. The resort segment covers 26–27 properties, so the sold-out property rate moves 3.7 points on a single property. A move like resorts on October 2 falling from 69.8% at T-45 to 66.7% at T-30 can occur simply from inventory being pulled and put back. Judge on the levels at the three points — T-45, T-30 and the latest reading — rather than on small daily swings.
4. Autumn weekdays are a different animal from summer weekdays. In August’s settled results the day-of-week spread for ryokan stayed within 5.7 points. From late September the day-to-day swings are wide, and weekday products need redesigning. Assume that messaging that worked in summer will not carry over to autumn weekdays.
| Timing | Move | Trigger (figures from this article) | Purpose |
|---|---|---|---|
| Today–this week | Open remaining Sep 19–22 allocation to single-night and small-party bookings; check that conditions are not set too narrowly | Market Sep 20 at 99.7% with a 93.2% sold-out property rate (ryokan), while your property still holds allocation | Avoid leaving scarce inventory unsold |
| Today–this week | Reset Sep 23 (Wed) as a standalone weekday rather than “the last day of the holiday” | Market at 68.0% with an 18.4% sold-out property rate as of Sep 9 (ryokan) — the lowest level within the run | Absorb unsold holiday allocation with weekday demand |
| Within two weeks | Build one weekday-only stay-value product for Oct 1 (Thu) and Oct 2 (Fri) | If Oct 1 remains flat at 57.2% at T-45 → 60.0% as of Sep 9 (+2.8pt) | Create movement in a stalled curve |
| Within two weeks | Design a Fri–Sat (Oct 2–3) two-night product to connect Saturday demand to Friday | Market Friday at 68.1% against Saturday at 78.9% (ryokan) — a gap of around 10 points | Cover the trough-date night with weekend demand |
| Within two weeks | Set Oct 10 (Sat) and Oct 11 (Sun) separately from Oct 12 (Mon) | As of Sep 9, Oct 10 is at 83.2% and Oct 12 at 58.7% for ryokan — 24.5 points apart within one holiday weekend | Do not set a holiday run as a single block |
| Looking to next month | Finalise products and inventory allocation for the foliage season (late Oct–Nov) within this month, then review the curve weekly once those dates enter the observation window | That period is still beyond 45 days before the stay date, so progress cannot yet be judged numerically | Avoid losing the peak season to a late design |
Source: MetroEngines Research; compiled by the HotelBank Editorial Team
None of these guarantees a result; they are options to be selected against your own booking position and product mix. The market curve is a reference line, and your own curve diverging from it is not in itself a problem. The problem is the days running down while the reason for the divergence remains unexplained.
In summary — three yardsticks
Yardstick 1: use the T-45 level to classify the date. Dates already high at T-45 (Sep 20, ryokan 88.4%) are dates where last-minute levers do not work; dates low at T-45 that surge close in (Sep 22, ryokan 67.5% → 90.1%) are last-minute plays; dates that do not move from T-45 (Oct 1, ryokan 57.2% → 60.0%) are dates that need a change on the product side. These three classes carry straight over to next month’s calendar.
Yardstick 2: look at pickup. Reading the difference from T-45 (ryokan Sep 22 +22.6pt, Oct 1 +2.8pt) rather than the level separates demand that is moving from demand that has stopped. A date that is low but still picking up can be left alone; a date where pickup has stopped will not change on its own.
Yardstick 3: break a holiday run down day by day. Even across five days, the middle day (Sep 20 at 99.7%) and the closing day (Sep 23 at 68.0%) differ by more than 30 points. October’s three-day weekend shows the same shape, with October 10 at 83.2% and October 12 at 58.7%. (All as of September 9, 2026; ryokan, 145–146 properties in scope.) Setting a holiday run as a single block is the operating practice most worth avoiding.
About the Data
• Definition of estimated OCC (OTA-listed inventory basis): OTA-listed-inventory occupancy = 100 − 100 × rooms still listed on OTAs ÷ total rooms. The scope is a fixed cohort of properties that list at least 30% of their total rooms on OTAs (the same set of properties for every stay date; the properties-in-scope figure is that count). It is an estimate based on how listed inventory is selling on OTAs, and is defined differently from actual room occupancy (it runs higher because rooms never listed are counted on the sold side).
• Booking curve: based on observations from 45 days before the stay date to the present. The latest observation date in this article is September 9, 2026, and stay dates from September 19 to October 12 are all mid-course snapshots with 10–33 days remaining (not settled figures). Stay dates from late October onward have not entered the observation window, so no numerical assessment of progress is made for them.
• Sold-out property rate: the share of the cohort for which no listed inventory can be found on OTAs and similar channels (estimated). It also rises and falls with changes to listing settings, so in small-base segments the effect of a single property is large.
• August daily actuals: actuals for the elapsed month of August 2026 (the latest observation for each stay date), averaged by day of week. The basis differs from the mid-course figures for September and October.
• Scope breakdown: Tochigi ryokan (property type: ryokan; 144–147 properties in scope, approx. 5,650–5,751 rooms; 119–144 properties for the August actuals) and resort hotels (property type: resort hotel; 26–27 properties in scope, approx. 1,743–1,779 rooms; 23–27 properties for the August actuals). Both are on a major-booking-site listing basis, and the number of properties in scope varies by stay date.
• This article does not deal with price indicators (estimated settled ADR and the like). Demand is discussed using occupancy and sold-out property rate only.
• Data as of September 10, 2026. Sales status and inventory change daily, so the figures in this article are a snapshot at the time of retrieval.
References and Sources
■ Data sources
Booking curves, estimated OCC (OTA-listed inventory basis) and sold-out property rates are aggregated from public price and listed-inventory data for the accommodation booking market collected by MetroEngines Research, at the level of Tochigi ryokan (144–147 properties in scope, approx. 5,650–5,751 rooms) and resort hotels (26–27 properties in scope, approx. 1,743–1,779 rooms). The comparison with other prefectures (Table 3) was re-aggregated for each of the seven prefectures on the same definitions and the same observation date. Holiday and long-weekend dates follow the Cabinet Office’s “About National Holidays”.
■ Calculation assumptions
Estimated OCC = 100 − 100 × rooms still listed on OTAs ÷ total rooms. The scope is a fixed cohort of properties that list at least 30% of their total rooms on OTAs, using the same set of properties for every stay date. Pickup is the difference between the observation at 45 days before the stay date and the observation on the latest date (September 9, 2026); it is not a forecast. The August day-of-week levels are a simple average of daily actuals for August 2026 by day of week. The cross-prefecture comparison covers the ryokan segment only; the resort hotel segment was excluded because some prefectures have single-digit property counts.
■ Limitations and caveats
Estimated OCC is an estimate based on how listed OTA inventory is selling and is defined differently from actual room occupancy (it runs higher because rooms never listed are counted on the sold side). Stay dates from September 19 to October 12 are all mid-course snapshots rather than settled figures, and will change with further sales. The sold-out property rate also rises and falls with changes to listing settings, and in the resort hotel segment of 26–27 properties a single property moves it by 3.7 points. Stay dates from late October onward fall outside the observation window and their progress is not assessed. Data as of September 10, 2026.
- Cabinet Office, “About National Holidays” (primary source for 2026 public holidays and the five-day run)
- MetroEngines Research (estimated OCC and sold-out property rate on an OTA-listed inventory basis, retrieved September 10, 2026)