

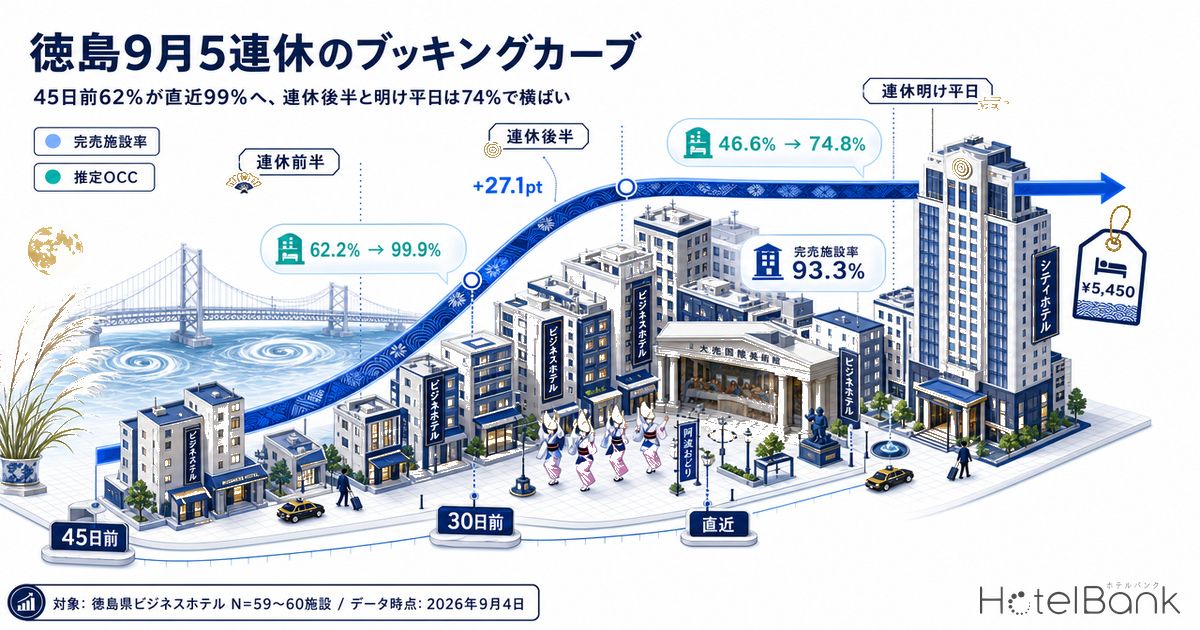
We tracked Tokushima’s five-day September 2026 holiday run (Sat Sep 19 – Wed Sep 23) with booking curves running from 45 days before each stay date through to the latest reading. For business hotels, estimated OCC (based on OTA-listed inventory) on Sunday, September 20 climbs from 69.8% at 45 days out to 100.0% at the latest observation, and Monday, September 21 (Respect for the Aged Day) from 62.2% to 99.9%. At the tail of the run, however, Wednesday, September 23 (Autumnal Equinox Day) moves only from 46.6% to 74.8%, and Friday, September 25, the first weekday after the break, from 44.2% to 74.1%. Look only at the size of the pickup and every date resembles the next at around +30pt — but the sold-out property rate tells a completely different story. The first three days of the run jump from 41.7–59.3% at 45 days out to 93.3–100.0% at the latest reading, while the back end of the run and the days after it barely move, from the 5–7% range to 5–8%. In a market where a low reading at 45 days out does not necessarily mean a weak date, how should pricing and inventory release be designed for the remaining two weeks? We work through it with a three-checkpoint frame.
Coverage: Tokushima business hotels N=59–60 properties (approx. 4,150 rooms) / city hotels N=10 properties (872 rooms). The price metric in this article is estimated settled ADR (the transaction price level estimated from OTA and other sales data, tax-excluded equivalent), and occupancy is an estimate based on OTA-listed inventory. Both definitions appear at the end of the article. Data as of September 4, 2026.
- — The level at 45 days out is not a measure of how strong the date is. Saturday, September 19 runs from 67.0% at 45 days out to 99.7% at the latest reading, while Wednesday, September 23 (holiday) stops at 74.8% from 46.6%. The pickup (around +30pt) is almost identical on both dates, so it cannot separate them.
- — The sold-out property rate is the second yardstick. The first three days of the run jump from 41.7–59.3% at 45 days out to 93.3–100.0% at the latest reading, while the back end and the days after hold flat in the 5–8% range. Even at the same estimated OCC of around 74% (as of September 3, 2026), the remaining inventory is distributed very differently.
- — On the front half of the run, city hotels fill first and business hotels follow. City hotels had already built September 19–21 to 95.2–96.7% at 45 days out, roughly 30pt ahead of business hotels at 62.2–69.8%.
- — Weekday softness should be measured against the completed-month baseline. Against 77.3% on Thursday, September 24 and 74.1% on Friday, September 25, the August 2026 result was 94.6% on Thursdays and 89.3% on Fridays. That gap reads as headroom still to be filled.
- — Pricing starts from the monthly estimated settled ADR. Tokushima business hotels settled July 2026 at ¥5,450 (N=74 properties), up 0.3% year on year. For September, the prior-year settled figure of ¥5,376 applies — a step down from August, the annual peak.
Booking curves across the five-day run — the same “+30pt” means completely different things
First, the curve below connects daily estimated OCC for business hotels (N=60 properties / 4,154 rooms; 53–59 properties observed on any given observation date) from 45 days before the stay date through to the latest reading. Saturday, September 19 and Monday, September 21 (Respect for the Aged Day) start from the high 60s and low 60s at 45 days out — levels that look comfortably loose. Yet both reached the 99% range at the latest reading. Tuesday, September 22 (Citizens’ Holiday) also moved from 53.6% to 85.3%.
By contrast, Wednesday, September 23 (Autumnal Equinox Day) and Friday, September 25 have plateaued in the 74% range even at the latest reading. Looking at the shape of the curve, both dates stepped up around 30 days out and have then run essentially flat for the three weeks to the latest reading. September 23 goes from 72.1% at 30 days out to 74.8%, a gain of +2.7pt; September 25 from 70.8% to 74.1%, or +3.3pt. That is a completely different behaviour from September 19 at the front of the run, which built +27.1pt from 72.6% at 30 days out to 99.7%.
Source: MetroEngines Research; compiled by the HotelBank Editorial Team
The point to watch here is that if you look only at the difference between 45 days out and the latest reading (around +30pt), September 19, September 23 and September 25 all produce similar numbers. September 19 is +32.7pt, September 23 is +28.2pt and September 25 is +29.9pt. The size of the pickup cannot tell them apart. What can tell them apart is which stretch of the curve the pickup happened in, and how far individual properties have sold out. For how far inventory absorption is pulled forward during an event period in this same prefecture, Awaodori 2026: 98.8% Sold 45 Days Out breaks down the gap against a normal weekend.
Seen through the sold-out property rate, the run splits into “the first three days” and “everything else”
The chart below places the sold-out property rate (the estimated share of properties whose listed inventory can no longer be confirmed on OTAs and similar channels) at three checkpoints: 45 days out, 30 days out and the latest reading. Saturday, September 19 runs 43.3% → 70.0% → 93.3%; Sunday, September 20 runs 59.3% → 91.5% → 100.0%; Monday, September 21 (holiday) runs 41.7% → 66.7% → 95.0%. On the first three days of the run, essentially every observed property has sold out as of the latest reading.
By contrast, Tuesday, September 22 (holiday) stops at around 30% with 21.7% → 33.3% → 30.0%, while Wednesday, September 23 (holiday) reads 5.1% → 6.8% → 6.8%, Thursday, September 24 reads 6.7% → 8.3% → 5.0% and Friday, September 25 reads 5.0% → 6.7% → 8.3% — barely moving from their level at 45 days out. When estimated OCC has reached roughly 74% and yet fewer than one property in ten has sold out, the remaining inventory is not concentrated in a handful of properties: it is spread thinly across many of them. That distinction — inventory spread thin across the market versus inventory that sells out property by property — is precisely what the sold-out property rate exists to capture, because estimated OCC alone cannot separate the two.
Source: MetroEngines Research; compiled by the HotelBank Editorial Team
Looking at the same period for city hotels (N=10 properties / 872 rooms), the shape of the curve is clearly different. September 19 was already at 95.2% at 45 days out, September 20 at 96.7% and September 21 at 96.2%. For the front half of the run they built more than 30pt ahead of business hotels, and at the latest reading they have reached 99.9–100.0%. September 23, on the other hand, goes from 73.2% at 45 days out to 73.2% at the latest reading — the level has not changed at all across those 45 days, and the sold-out property rate is 0.0% throughout. The front half of the run fills at city hotels first, with business hotels catching up close in; the back half moves at neither. It is a two-tier structure.
| Stay date | Business 45 days out |
Business 30 days out |
Business latest |
Business sold-out property rate 45 days out → latest |
City 45 days out → latest |
|---|---|---|---|---|---|
| Sep 19 (Sat) | 67.0% | 72.6% | 99.7% | 43.3% → 93.3% | 95.2% → 99.9% |
| Sep 20 (Sun) | 69.8% | 99.5% | 100.0% | 59.3% → 100.0% | 96.7% → 100.0% |
| Sep 21 (Mon, hol.) | 62.2% | 92.2% | 99.9% | 41.7% → 95.0% | 96.2% → 100.0% |
| Sep 22 (Tue, hol.) | 53.6% | 56.9% | 85.3% | 21.7% → 30.0% | 81.0% → 91.2% |
| Sep 23 (Wed, hol.) | 46.6% | 72.1% | 74.8% | 5.1% → 6.8% | 73.2% → 73.2% |
| Sep 24 (Thu) | 46.2% | 72.9% | 77.3% | 6.7% → 5.0% | 72.2% → 76.7% |
| Sep 25 (Fri) | 44.2% | 70.8% | 74.1% | 5.0% → 8.3% | 78.0% → 81.8% |
Estimated OCC (based on OTA-listed inventory). “Latest” is the reading as of September 3, 2026 (16–22 days before the stay date). For “30 days out”, a small number of dates use an observation point one day either side. Source: MetroEngines Research; compiled by the HotelBank Editorial Team
Is 74% on the weekdays after the break actually “weak”? Check it against a normal month’s baseline
It is hard to judge whether 77.3% on Thursday, September 24 and 74.1% on Friday, September 25 are strong or weak by looking at them in isolation. What makes the judgment possible is the completed-month result for the same market and the same category. Monthly average estimated OCC for Tokushima business hotels was 90.6% in August 2026 (61 properties) and 85.3% in July 2026 (61 properties). Averaged by day of week, the August result was Wednesday 94.9%, Thursday 94.6%, Tuesday 93.5%, Saturday 92.9%, Friday 89.3%, Monday 88.6% and Sunday 82.4%. The July result takes the same shape — Saturday 90.8%, Thursday 89.5%, Wednesday 88.1%, Tuesday 87.2%, Friday 83.9%, Monday 81.2% and Sunday 74.8% — with weekdays high and Sunday lowest.
| Day of week | July 2026 result, estimated OCC | August 2026 result, estimated OCC |
|---|---|---|
| Monday | 81.2% | 88.6% |
| Tuesday | 87.2% | 93.5% |
| Wednesday | 88.1% | 94.9% |
| Thursday | 89.5% | 94.6% |
| Friday | 83.9% | 89.3% |
| Saturday | 90.8% | 92.9% |
| Sunday | 74.8% | 82.4% |
| Monthly average | 85.3% | 90.6% |
Tokushima business hotels, N=61 properties. Completed-month results for estimated OCC (based on OTA-listed inventory). Source: MetroEngines Research; compiled by the HotelBank Editorial Team
Tokushima’s business hotel market is a textbook weekday-demand market, peaking on Wednesdays and Thursdays. In that market, 77.3% on Thursday, September 24 and 74.1% on Friday, September 25 at the latest reading also mean there is a fair amount left over relative to the completed-month result of 94.6% on Thursdays and 89.3% on Fridays in August. Given that these dates are still around 20 days out, it is more natural to read that gap as headroom still to be filled. Indeed, Saturday, September 19 moved from 72.6% at 30 days out all the way to 99.7% at the latest reading.
A yardstick for the price level — check Tokushima’s estimated settled ADR monthly
As a basis for pricing decisions, the market price level is best pinned down with monthly estimated settled ADR. For Tokushima business hotels, the most recent settled month, July 2026, reads ¥5,450 (N=74 properties), against ¥5,432 (N=74 properties) for the same month a year earlier, July 2025. At +0.3% year on year, the level is running essentially flat. As a seasonal reference point for September, the prior-year settled figure for September 2025, ¥5,376 (N=74 properties), is the one to use. The highest month of the year is August (August 2025, ¥6,660, N=74 properties), and September steps down from there.
Estimated settled ADR (tax-excluded equivalent). Settled figures (history) only are shown. Source: MetroEngines Research; compiled by the HotelBank Editorial Team
City hotels sit on a small base (N=10 properties), but July 2026 reads ¥7,806 against ¥8,060 in the same month a year earlier, July 2025, or −3.2% year on year. The settled figure for the prior September is ¥7,534. The reading is a market with a tier gap of roughly ¥2,000–¥2,400 between business and city hotels. Note that August and September 2026 fall into the current/future-month estimate category, so they should not be compared directly against settled figures; it is better to wait for month-end settlement before assessing them.
For revenue managers running business and city hotels in Tokushima — implications and an action plan
Operational insights
1. Do not read the level at 45 days out as “how strong the date is.” Among Tokushima business hotels, Saturday, September 19 kept a gentle start — 67.0% at 45 days out and 72.6% at 30 days out — and still reached 99.7% at the latest reading. From the same 45-days-out vantage point, Wednesday, September 23 (holiday) at 46.6% stopped at 74.8%. When comparing your own curve against the market, it is easier to discriminate if you anchor on how many points were added between 30 days out and the latest reading, rather than on the level itself.
2. Make the sold-out property rate your second yardstick. Even at the same estimated OCC of around 74%, the September 19 pattern (sold-out property rate jumping from 43.3% at 45 days out to 93.3% at the latest reading) and the September 25 pattern (5.0% to 8.3%, barely moving) describe very different inventory left in the market. The latter is a state where inventory remains thinly spread across many properties, so cutting price does little to lift relative exposure. It is a phase where widening the room types and stay conditions you are able to sell fits better than discounting.
3. On the front half of the run, “city first, business second.” City hotels had built September 19–21 to 95.2–96.7% at 45 days out, roughly 30pt ahead of business hotels at 62.2–69.8%. Where the upper price tier sells out first, demand can be expected to spill down to the business tier close in. The first three days are already in the 99% range at the latest reading, so in practice the question has shifted to how to price and release the remaining allotment.
4. Compare the weekdays after the break against the market baseline. In the completed-month results by day of week, Thursdays read 94.6% in August 2026 and 89.5% in July, and Fridays 89.3% and 83.9%. The latest readings of 77.3% on Thursday, September 24 and 74.1% on Friday, September 25 still leave a gap to that normal level. It is also worth holding in mind, as a basis for close-in pricing, that September’s monthly price level at the prior-year settled figure of ¥5,376 (N=74 properties) is a step down from August, the annual peak.
| Time frame | Action | Decision trigger (figures from this article) | Objective |
|---|---|---|---|
| Today to this week (about two weeks to the run) | Treat the remaining allotment for Sep 19, 20 and 21 as high-demand dates and consider lifting stop-sell on your top-tier inventory | The market’s sold-out property rate has reached 93.3–100.0% at the latest reading, yet your property still has vacancy on the first three days | Avoid missing close-in demand after the market has sold out |
| Review inventory for Sep 22 (Tue, hol.) separately from the first three days | The market moved from 53.6% at 45 days out to 85.3% at the latest reading, but the sold-out property rate only went from 21.7% to 30.0% | Become the catch-basin for demand overflowing from the full first three days | |
| Within two weeks (close-in to the run) | Decide in advance the order in which you will phase out consecutive-night conditions and minimum length-of-stay restrictions for Sep 23 (Wed, hol.) | The market’s estimated OCC has moved only +2.7pt, from 72.1% at 30 days out to 74.8% at the latest reading | Switch from multi-night demand tied to the first three days to picking up single-night demand |
| Widen the range of room types and occupancy conditions on sale for Sep 24 and 25 (including whether to open single occupancy) | Against the latest readings of 77.3% and 74.1%, a gap remains to the completed-month results of 94.6% on Thursdays and 89.3% on Fridays (August 2026) | Go after the headroom to build back up to the baseline of a weekday-demand market | |
| Looking to next month (designing for October onward) | Build a fixed three-checkpoint review — 45 days out, 30 days out, close-in — into your pricing calendar | The difference between 45 days out and the latest reading is +32.7pt for Sep 19 and +29.9pt for Sep 25 — almost identical, so the size of the pickup cannot separate strong dates from weak ones | Shift to an operating routine that judges on the pickup within each stretch |
| Refresh your monthly price-level range and check where your own rate band sits against it | Estimated settled ADR for Tokushima business hotels settled July 2026 at ¥5,450 (N=74 properties), +0.3% year on year | Revisit where to set your ceiling and floor in a flat market |
Source: MetroEngines Research; compiled by the HotelBank Editorial Team
Summary — three yardsticks to take away from Tokushima’s September holiday run
Yardstick 1: look at the pickup from 30 days out to the latest reading, not the level at 45 days out. Saturday, September 19 added +27.1pt, from 72.6% at 30 days out to 99.7% at the latest reading; Wednesday, September 23 (holiday) added +2.7pt, from 72.1% to 74.8%. The level at 30 days out was almost the same on both dates, yet the behaviour afterwards was the exact opposite. A low reading at 45 days out is no proof that the date is weak (for how to turn three checkpoints into a working routine, see Okayama Booking Curves: 3 Checkpoints, Aug 8 Late-Surges +11.8pt).
Yardstick 2: always read estimated OCC and the sold-out property rate as a pair. At the latest reading (observations as of September 3, 2026), estimated OCC is 74.8% on September 23 and 74.1% on September 25 — practically the same level — yet their sold-out property rates are 6.8% and 8.3%, under one in ten. Sunday, September 20, by contrast, is at 100.0% estimated OCC (as of September 3, 2026) with a 100.0% sold-out property rate. Even at the same “high occupancy,” the distribution of inventory left in the market is completely different.
Yardstick 3: measure daily judgments against the completed-month baseline by day of week. The August 2026 result for Tokushima business hotels was a monthly average of 90.6%, with weekdays high at 94.9% on Wednesdays and 94.6% on Thursdays. The readings after the break — 77.3% on Thursday, September 24 and 74.1% on Friday, September 25 — are best assessed by their distance from that normal level. On the pricing side, the monthly estimated settled ADR (settled July 2026 at ¥5,450, N=74 properties, +0.3% year on year) is the reference point to anchor your ceiling and floor.
About the data
■ Data sources
MetroEngines Research; aggregated by the HotelBank Editorial Team. We used our own aggregated data, observing room inventory sold on OTAs and its listed prices daily for business hotels and city hotels in Tokushima. The booking curves use the observation series from 45 days before each stay date through to September 3, 2026, for stay dates from September 19 to September 25, 2026. Completed-month results use daily observations for July and August 2026, and the price level uses the monthly estimated settled ADR series (settled figures).
■ Calculation assumptions
Estimated OCC uses listed inventory observed under a query condition of two adults in one room for both numerator and denominator. Estimated settled ADR is a multi-channel ensemble estimate (tax-excluded equivalent) obtained by applying property-type coefficients to the cheapest-plan level, and only settled figures for past months are quoted. Curve assessment is fixed at three checkpoints — 45 days out, 30 days out and the latest reading — and for “30 days out” an observation point one day either side was substituted only on dates where the observation was missing. Completed-month results by day of week average that month’s daily values within each day of the week.
■ Limitations and caveats
Estimated OCC is an estimate based on how OTA-listed inventory is being absorbed, and is defined differently from actual room occupancy (it reads higher). The sold-out property rate is likewise the share of properties whose listed inventory can no longer be confirmed, not confirmed information that they are full. Note that city hotels sit on a small base of N=10 properties, so the movement of a single property can shift the overall figure considerably. This article describes inventory absorption across the market as a whole; it does not indicate the sales results of individual properties or any causal relationship. The figures are a snapshot at the time of retrieval, and close-in readings change daily.
- Definition of estimated OCC: OTA-listed-inventory occupancy = 100 − 100 × rooms still listed on OTAs ÷ total rooms. It is an estimate based on how inventory sold on OTAs is being absorbed, and is defined differently from actual room occupancy (it reads higher). This article writes it as “estimated OCC (based on OTA-listed inventory).”
- Booking curve: based on observations from 45 days before the stay date through to the latest reading. The stay dates covered are September 19 to September 25, 2026. “Latest” means the reading as of September 3, 2026 (16–22 days before the stay date). For “30 days out”, a small number of dates use an observation point one day either side.
- Sold-out property rate: the estimated share of properties whose listed inventory can no longer be confirmed on OTAs and similar channels.
- Definition of estimated settled ADR: the transaction price level (tax-excluded equivalent) estimated from OTA and other sales data (cheapest-plan level × property-type coefficient, ensembled across multiple channels). Past months are settled figures; the current and future months are estimates based on present sales conditions. Median error against published operating results is 6.6%. Only settled figures are quoted in this article.
- Breakdown of N: Tokushima business hotels, booking curves N=59–60 properties (4,131–4,154 rooms; 53–59 properties observed on each observation date) / city hotels N=10 properties (872 rooms; 10 properties observed). Completed-month results (July and August 2026) are N=61 properties. Estimated settled ADR is N=74–76 properties for business hotels and N=10 properties for city hotels.
- Data as of: September 4, 2026. Sales conditions and inventory change daily, so the figures in this article are a snapshot at the time of retrieval.
Related reading
- Awaodori 2026: 98.8% Sold 45 Days Out — 39.4pt Over Normal Weekends
- Okayama Booking Curves: 3 Checkpoints, Aug 8 Late-Surges +11.8pt
- Ibaraki Sep Booking Curves: Peak Sep 19-21 at 74.9%, Sep 23 55.7%
- Nagano September: Wed 58.7% vs Holiday Sat 93.0%, 34pt Gap Holds
- Nagasaki Early Sep Booking Curves: 9/12 OCC 82.7%, Ryokan 24.2pt Gap
- Booking Curves Across 47 Prefectures: +4.1pt Median Pickup from T-45