

When a rebuild is on the table, the number that lands on the desk is almost always “what will the new building cost.” What actually breaks the business plan, however, are two costs that are not on that sheet. The first is that rebuilding shrinks your floor area. The second is what it costs to tear the old building down. This article converts both into actual yen figures using public information only.
First, how this piece differs from our earlier work. “Where Can Hotels Be Built — Development Capacity in Five Major Commercial Districts, Read Through Zoning, FAR and Land Prices” dealt with how to increase the FAR ceiling. This article takes the opposite case: the existing building already exceeds today’s ceiling, so rebuilding makes it smaller. “Japan’s Pre-1981 Hotel Stock: 236,000 Rooms, 19.1% of All Guest Rooms — Retrofit or Rebuild, the Tipping Point Across 588 Buildings” framed the decision around seismic standards; this article adds cost to that same tipping point along two different axes — floor area ratio and demolition cost (figures from the earlier articles are cited as given and are not recalculated here). Our earlier analysis of new-build unit costs put hotel construction at ¥20.67 million per room, derived from an average guest-room floor area of 35.0 m² across 31 planned projects. This article covers what comes before that: demolition cost, and how much floor area you can actually secure after rebuilding.
Metric Definitions Used in This Article
- ADR (average daily rate) = an estimated settled rate (tax-exclusive equivalent) calculated by applying a segment-specific adjustment coefficient to the lowest published plan rate each property lists on OTAs (double occupancy, per-room rate, tax included). Cross-checked against property-level actuals disclosed by listed hotel REITs (91 properties, trailing three months), the median error is approximately 7%. These are estimates and differ from each property’s actual transaction prices and accounting figures. Area-level ADR is the median across the properties in scope (the level of a typical property in that area).
- OCC (occupancy rate) = sold rooms as a share of total rooms in the area (an estimate based on OTA sales inventory; consistency checks against monthly REIT disclosures confirm accuracy within roughly a few percentage points). Used only as a macro indicator at the prefecture and municipality level.
- Designated FAR = the floor area ratio set by city planning (Building Standards Act, Article 52(1)). Base FAR = where the frontage road is under 12 m wide, the ceiling calculated as road width (m) × statutory coefficient (4/10 in residential zones, 6/10 elsewhere) (same article, paragraph 2). The effective ceiling is the lower of the two.
- Demolition cost per m² = the contract value of demolition work published by the municipality (consumption tax included) ÷ the published gross floor area of the buildings to be demolished.
- Data sources: MetroEngines Research & Consulting / Ministry of Land, Infrastructure, Transport and Tourism (MLIT) Real Estate Information Library (zoning) / MLIT “Statistical Survey on Building Demolition” / bid results and contract disclosures published by each municipality.
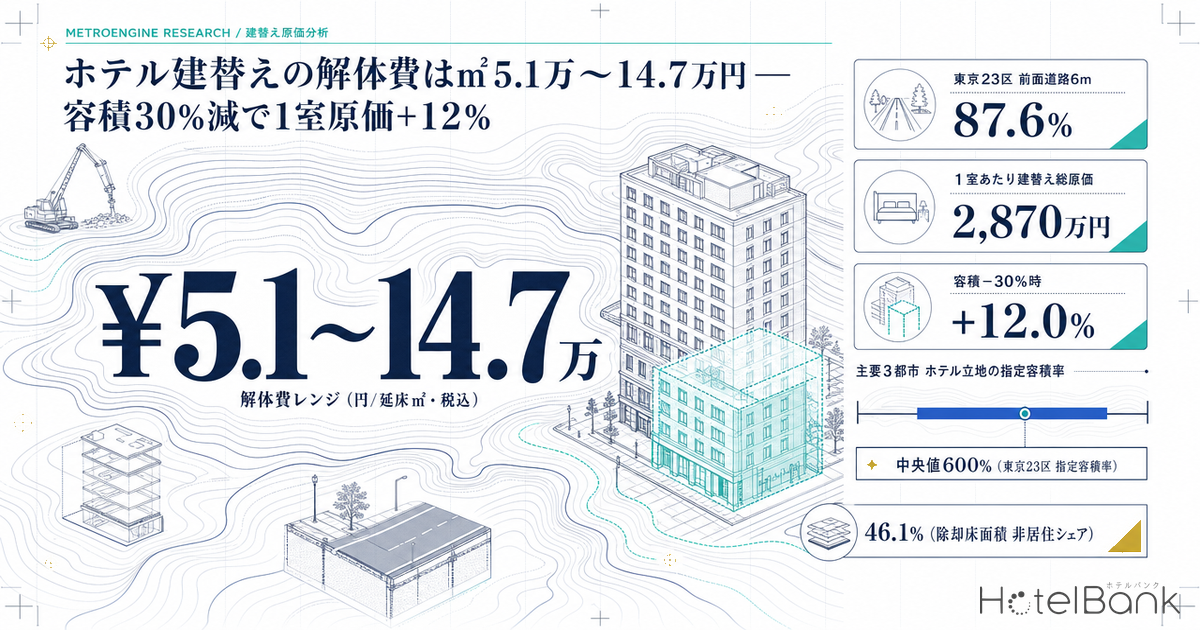
- — Across five demolition contracts published by three municipalities, cost ran ¥51,025 to ¥146,983 per m² of gross floor area (tax included). The average was ¥87,760/m² and the median ¥67,658/m², a spread of nearly threefold driven by whether pile removal and dense-urban site conditions were involved.
- — Assuming a 6 m frontage road, 87.6% of hotel sites in Tokyo’s 23 wards (N=2,663) cannot use their full designated FAR, and the unusable portion averages −35.3%. Kyoto City: 62.1% (N=1,194); Sendai City: 70.1% (N=187).
- — For a 100-room, 3,500 m² model, total rebuild cost is ¥28.70 million per room. Of that, demolition at 11.0% plus 30 months of forgone GOP during closure at 17.0% — 28.0% in total — never appears on a new-construction quotation.
- — If post-rebuild floor area falls 30%, total cost per room rises 12.0% (to ¥32.14 million). Annual GOP yield excluding land acquisition falls from 6.80% to 6.07%; including ¥1.5 billion of land, from 4.47% to 3.64%.
- — Across the two axes of demolition unit cost and FAR reduction, total cost per room spans ¥27.34 million to ¥34.99 million (a 1.28× range). Where floor area shrinks, holding the property as a legally non-conforming existing building and extending its life through renovation acquires economic logic.
Legally non-conforming is not illegal — but the moment you rebuild, current rules apply in full
Article 3(2) of the Building Standards Act provides that where a building has ceased to comply with current rules because of a legal amendment or a change to the city plan, those rules do not apply to it. This is the legally non-conforming existing building (kizon futekikaku). It is not an illegal structure, and continuing to use it as-is is entirely lawful. Hotel owners rarely have occasion to think about it in day-to-day operations.
The problem arrives when you rebuild. Once you demolish and build new, the new building must comply with current rules in full. Designated FAR, base FAR derived from frontage road width, road and adjacent-lot setback lines, shadow regulations, road-access obligations, and municipal parking provision ordinances all bite at once. The spread in required parking spaces reaches 2.5× between cities, as set out in our separate comparison of the ordinances in seven major cities. Among buildings put up in the 1960s and 1970s, a substantial number have since been through zoning changes, FAR reductions and the introduction of shadow regulations, so that the same floor area could not be built under today’s rules.
Three typical patterns can be distinguished.
| Pattern | What drives it | What happens after rebuilding |
|---|---|---|
| 1. Designated FAR was reduced | A city planning review changed the zoning designation, or the FAR was lowered | Current gross floor area exceeds the new designated FAR. A reduction in floor area is locked in. |
| 2. Capped by frontage road width | Article 52(2). If the frontage road is under 12 m, width × 0.6 (0.4 in residential zones) is added as a ceiling | Even with a designated FAR of 600%, a 6 m frontage road gives a base FAR of 360%. Only 60% of the designation is usable. |
| 3. Height and form controls added later | Shadow regulations, height-control districts imposing absolute height limits, landscape controls, and similar | Even where the FAR would allow the volume, the combination of storeys and floor plate is constrained, so the FAR cannot be fully used. |
Pattern 2 is the one most often overlooked. A commercial-zone location commonly carries a designated FAR of 600% or 700%, but that is only the ceiling where the frontage road is wide enough. On a site with a 6 m frontage road in a commercial zone (coefficient 0.6), base FAR is 360%, and no matter how high the designated FAR, 360% becomes the effective ceiling. Buildings put up under the old law that now exceed the current base FAR — through the looser practice of the day or a history of extensions — are most likely to be found on the small, tight sites of central urban districts.
Designated FAR measured across 4,044 hotels — median 600% in Tokyo’s 23 wards, 400% in Kyoto City
So where do actual hotel sites sit in the FAR distribution? Among the properties tracked by MetroEngines Research, we took those located in Tokyo’s 23 wards, Kyoto City and Sendai City with at least 10 guest rooms and known coordinates, and overlaid them on the zoning data in MLIT’s Real Estate Information Library. Properties whose coordinates fall inside a zoning polygon were included: Tokyo’s 23 wards N=2,663 (out of a base population of 2,691 properties, a 99.0% match rate), Kyoto City N=1,194 (of 1,207, 98.9%) and Sendai City N=187 (of 195, 95.9%), retrieved 1 September 2026.
In Tokyo’s 23 wards the 500–600% band accounts for 42.8% of sites and the 700–800% band a further 24.1%; the median is 600%. By zoning designation, 76.8% sit in commercial zones, rising to 84.6% once neighbourhood commercial zones are included. Kyoto City, by contrast, has a median of 400%, with 66.3% of sites at 400% or below. The 16.6% in the 700% band sit in the commercial zone around Kyoto Station, but across the city as a whole the weight lies in the lower FAR bands. Sendai City has 500% as its modal band (38.0%) yet also 25.1% at 200% or below — a polarised distribution.
On the map, the 700% band clusters north of Kyoto Station along Hachijo and Karasuma streets; move outward and the 400%-and-below band spreads across the city. Gion and Higashiyama to the east and Nishijin to the north-west are dominated by the 200–300% bands. On top of that, Kyoto City designates height-control districts across a wide swathe of its urbanization promotion area, layering absolute height limits such as the 31 m district (Kyoto City, “Height Control Districts,” updated 23 April 2026). Sites are squeezed from both the FAR and the height side.
At a 6 m frontage road, 87.6% of hotel sites in Tokyo’s 23 wards cannot use their full designated FAR
The distribution of designated FAR alone cannot tell you whether floor area will shrink. Base FAR derived from frontage road width (Article 52(2)) has to be laid over it. Because the actual frontage road width of each property is unknown, we calculated mechanically how many sites would have a base FAR below their designated FAR under assumed widths of 4 m, 6 m, 8 m and 10 m. Coefficients follow the zoning designation: 0.4 in residential zones, 0.6 elsewhere.
| Assumed frontage road | Tokyo 23 wards | Kyoto City | Sendai City | Note |
|---|---|---|---|---|
| 4 m (the level of an Article 42(2) road) | 96.4% (avg −53.5%) | 92.5% (−41.8%) | 93.0% (−44.6%) | Base FAR of 240% in commercial zones |
| 6 m | 87.6% (−35.3%) | 62.1% (−28.6%) | 70.1% (−28.9%) | 360% in commercial zones |
| 8 m | 69.6% (−21.5%) | 33.7% (−25.2%) | 58.8% (−10.1%) | 480% in commercial zones |
| 10 m | 25.8% (−18.9%) | 16.6% (−14.3%) | 2.1% (−14.3%) | 600% in commercial zones |
Read it this way. Because hotel sites in Tokyo’s 23 wards carry high designated FAR (median 600%), they are highly sensitive to frontage road width. At 6 m, 87.6% of sites cannot use their designated FAR, and the unusable portion averages 35.3%. Kyoto City, where designated FAR is lower to begin with, stays at 62.1% even with a 6 m frontage road and drops to 33.7% once the road widens to 8 m. In Sendai City a 10 m width all but eliminates the constraint, at 2.1%. Being located in a high-FAR commercial district does not mean floor area can be secured on rebuild — if anything, the wider the gap between designated and effective FAR, the more the business plan swings on road-access conditions.
Type A: narrow-frontage temple-town pattern (Kyoto City)
Designated FAR of 400% or below at 66.3% of sites (N=1,194). Commercial and neighbourhood commercial zones account for 78.2%, but the absolute FAR level is low, and absolute height limits in height-control districts sit on top. Because floor area is thin to begin with, the reduction on rebuild is relatively small — but there is almost no room to add floor area either.
Type B: commercial zone, capped by road access (Tokyo 23 wards)
Commercial zones 76.8%, median designated FAR 600% (N=2,663). The designation is high, but a 6 m frontage road gives a base FAR of 360%. At 87.6% of sites the designation cannot be fully used, with an average reduction of −35.3%. This is the type where legally non-conforming risk most readily materialises.
Type C: polarised regional station-front pattern (Sendai City)
Commercial zones 70.1% with 500% as the mode (38.0%), yet 25.1% at 200% or below (N=187). Quasi-industrial zones 5.9%, neighbourhood commercial 4.8%. Along 10 m arterial roads the constraint all but disappears, while the low-FAR hinterland behind them readily loses floor area on rebuild.
Demolition cost in actual yen — ¥51,000 to ¥147,000 per m² across five contracts in three municipalities
The second uncosted item is demolition. Plenty of market-rate information circulates on private quotation-comparison sites; here we use only the actual bid results and contract amounts published by municipalities, together with the equally public gross floor area of the buildings to be demolished. The five contracts (three municipalities) where both the awarded amount and the floor area could be confirmed as primary sources are set out below.
| Municipality | Project | Structure and scale | Gross floor area | Contract value (tax incl.) | ¥/m² |
|---|---|---|---|---|---|
| Nagasaki City | Kinkai Junior High School buildings and other structures, demolition | RC 3 storeys + 2 single-storey steel buildings + single-storey timber. Includes exterior works and electrical and mechanical services | 4,457 m² | ¥227,417,087 | 51,025 |
| Tsukuba City | Kamihirooka Nursery School demolition | Timber with partial steel, single storey. Building, play equipment, planting and buried piping as a package | 557 m² | ¥32,219,000 | 57,844 |
| Tsukuba City | Iwasaki Nursery School demolition | Timber with partial steel, single storey. As above | 499 m² | ¥33,761,200 | 67,658 |
| Tsukuba City | Former Kamigo High School demolition | Two 4-storey RC buildings + 2-storey RC and others. Includes removal of ancillary buildings, sports ground and car park (site area 70,089 m²) | 7,389 m² (the three main buildings with published floor areas) | ¥851,884,000 | 115,291 indicative of the upper end |
| Yashio City | Former city hall demolition | Former city hall and ancillary facilities. Dense-urban site works including pile removal, backfilling and grading | 8,002.33 m² | ¥1,176,208,000 (after contract variation) | 146,983 |
The simple average of the five is ¥87,760/m² and the median ¥67,658/m². The near-threefold spread comes from differences in scope. The cheapest, in Nagasaki City, was a suburban school site where work was limited to demolishing the buildings and removing exterior works and services. The most expensive, in Yashio City, was a city hall on a dense urban site where pile removal, backfilling and grading were all inside the scope. Hotel rebuilds frequently require existing piles to be dealt with before new foundations can be driven, and on tight central-city sites the constraints of temporary works and haulage routes add further cost. Hotel estimates should therefore look at the middle-to-upper end of the range rather than the lower bound.
One more item that rarely surfaces on a quotation is worth confirming. The project outline Yashio City distributed at its neighbourhood briefing lists, as part of the works: perimeter hoarding (safety fencing), soundproof panels, traffic marshals, vibration and noise monitoring equipment, water spraying and cleaning, and a resident site supervisor. In other words, temporary works and neighbourhood mitigation are already priced into the contract value, so there is no need to add them on top of the unit rates above. Construction supervision, on the other hand, is customarily a separate contract: for the demolition of Kiryu City’s former main hall, supervision services cost ¥12,100,000 against demolition works of ¥643,500,000 — a ratio of 1.88%.
Programme is also a decision input. Published contract durations were: Kiryu City’s former main hall (demolition works) from 19 December 2024 to 30 September 2025, about 9.5 months; Nagasaki City’s Kinkai Junior High School (4,457 m²) from the resolution date to 28 November 2025; Yashio City’s former city hall (8,002 m²) from 5 February 2024 to 30 September 2025, about 20 months; and Tsukuba City’s former Kamigo High School from August 2025 to 30 November 2026, about 16 months. For a 3,500–4,500 m² building, allow roughly 10 months for demolition alone.
22.83 million m² demolished a year — non-residential accounts for 46.1% of that floor area
Demolition is not an exotic event. Aggregating the most recent 12 months from MLIT’s “Statistical Survey on Building Demolition” (June 2025 to May 2026, through the latest month published on 31 August 2026), demolished buildings total 108,609 buildings and 22,826,516 m². Of that, non-residential uses account for 20,148 buildings and 10,531,524 m² — just 18.6% by building count, but 46.1% by floor area. Average gross floor area per building is 522.7 m² for non-residential against 139.0 m² for residential, making the non-residential side 3.8 times larger.
By structure type, the 12-month totals were 79,859 timber buildings at 9,376,590 m² and 28,750 non-timber buildings at 13,449,926 m². Timber accounts for 73.5% by building count, but non-timber flips ahead at 58.9% by floor area. Narrowing to non-residential and non-timber gives 15,739 buildings and 9,611,321 m², or 610.7 m² per building. Mid-size RC and steel-frame buildings are the main story in demolished floor area.
The largest are Osaka at 1,969,670 m², Tokyo at 1,962,742 m², Hokkaido at 1,667,410 m² and Kanagawa at 1,346,297 m². Non-residential shares run highest in Kanagawa at 75.1%, Miyagi at 66.2%, Osaka at 65.9%, Kyoto at 61.0% and Tokyo at 56.2% — well above the national average of 46.1%. The more urban the area, the more what is being torn down is not housing but non-residential buildings.
The same survey also publishes the assessed value of demolished buildings, totalling ¥331.52 billion over the trailing 12 months. Divided by floor area, that is ¥14,524/m². Against demolition unit costs of ¥51,025–146,983/m² from the previous section, the cost of tearing a building down is roughly 3.5 to 10 times the value still carried in it. Demolition is not the disposal of an asset but a net cash outflow — and this asymmetry is a structural force pulling rebuild decisions toward continued ownership.
For accommodation facilities specifically, the Japan Tourism Agency runs a “Town Development Support Programme for Regional Hot Spring Resorts through Removal and Regeneration of Derelict Buildings,” subsidising removal and floor-area reduction costs at a two-thirds rate (a combined first- and second-round cap of ¥600 million) for derelict ryokan and hotels of roughly 2,500 m² or more that have been out of use for roughly five years or more and sit in the tourism core of a regional hot spring resort (FY2026; applications open from 1 July 2026 to 26 February 2027). The premise that removal costs cannot be recovered on their own is written into the design of the public support itself.
Building it up in a 100-room, 3,500 m² model — total rebuild cost of ¥28.70 million per room
Now put these actual figures into a standard model. Using the guest-room floor area of 35.0 m² per room from our earlier article (the average across 31 planned projects), we construct the case of rebuilding a 100-room, 3,500 m² building. The assumptions are as follows, each with its basis and as-of date.
| Assumption | Value used | Basis and as-of date |
|---|---|---|
| Guest-room floor area unit | 35.0 m²/room | Average across 31 planned projects from our earlier article on ¥20.67 million per room. Cited here as given, not recalculated |
| Demolition cost per m² | ¥90,000/m² (tax incl.) | The simple average of the five contracts in this article, ¥87,760/m², rounded. Published contract values from three municipalities (bids and contracts from December 2024 to August 2025) |
| Temporary works and neighbourhood mitigation | Included in demolition cost | Yashio City, “Outline of the Former City Hall Demolition Works” (briefing materials, 4 February 2024), confirming hoarding, soundproof panels, traffic marshals, water spraying and cleaning, and a resident site supervisor are within scope |
| Demolition supervision fee | 1.88% of demolition cost | Kiryu City, former main hall demolition supervision services ¥12,100,000 ÷ demolition works ¥643,500,000 (contracted 23 December 2024). Shown separately in the table below |
| New construction cost | ¥20.67 million/room (¥590,571/m²) | From our earlier article. A unit rate back-solved from 31 planned projects in MLIT’s Building Construction Starts Statistics |
| ADR | ¥19,100 | Estimated settled ADR for Chuo Ward, Tokyo, trailing 12-month median of ¥19,116 (September 2025 – August 2026, N=152 properties). Retrieved 1 September 2026 |
| Occupancy | 80% | Set as a conservative figure below our estimated OCC (Tokyo 93.1% in July 2026, covering 1,354 properties and 182,896 rooms; Kyoto 83.8%) |
| GOP margin | 35% | A conservative figure below the 38.9% GOP actual disclosed by Invincible Investment Corporation across 91 MHM-operated properties (fiscal period ended December 2024) |
| Closure period | 30 months | Published demolition programmes (about 10 months for a 3,500–4,500 m² building) plus an assumed allowance for design, building confirmation and new construction |
| Line item | Amount | Per room | Share |
|---|---|---|---|
| (a) Demolition works (3,500 m² × ¥90,000) | ¥315,000,000 | ¥3.15M | 11.0% |
| (b) Temporary works and neighbourhood mitigation | included in (a) | — | — |
| (c) New construction (¥20.67M × 100 rooms) | ¥2,067,000,000 | ¥20.67M | 72.0% |
| (d) Forgone GOP over 30 months of closure | ¥488,005,000 | ¥4.88M | 17.0% |
| Total (excluding land acquisition) | ¥2,870,005,000 | ¥28.70M | 100.0% |
| (shown separately) Demolition supervision fee | ¥5,922,000 | ¥59k | — |
Look only at new construction and the figure is ¥20.67 million per room. Add demolition and the GOP forgone during closure and it becomes ¥28.70 million per room, a factor of 1.39. Demolition accounts for only 11.0% of total cost, but combined with the 17.0% of forgone GOP that is 28.0% — a little over a quarter of total rebuild cost never appears on a new-construction quotation.
What happens when floor area shrinks — a 30% FAR loss lifts cost per room 12.0%
Now layer the legally non-conforming effect on top. Where post-rebuild gross floor area is smaller than today’s, room count falls in proportion at 35.0 m² per room. Demolition cost, however, is set by the scale of the existing building and does not fall. Forgone GOP is set by the closure period and does not fall either. The result is fixed costs allocated across fewer rooms.
| FAR reduction | Post-rebuild floor area | Rooms | Demolition | New construction | Forgone GOP | Total cost per room | Increase |
|---|---|---|---|---|---|---|---|
| ±0% (unchanged) | 3,500 m² | 100 | ¥315M | ¥2,067M | ¥488M | ¥28.70M | — |
| −10% | 3,150 m² | 90 | ¥315M | ¥1,860M | ¥488M | ¥29.59M | +3.1% |
| −20% | 2,800 m² | 80 | ¥315M | ¥1,654M | ¥488M | ¥30.71M | +7.0% |
| −30% | 2,450 m² | 70 | ¥315M | ¥1,447M | ¥488M | ¥32.14M | +12.0% |
The rise in cost per room itself, from +3.1% to +12.0%, is not dramatic. But there is another figure to watch. Losing 30 rooms means the revenue capacity after reopening is permanently 30% smaller. On the assumptions above (ADR ¥19,100, occupancy 80%, GOP 35%), the annual GOP lost with those 30 rooms is roughly ¥58.5 million — every year.
In yield terms it looks like this. Annual GOP yield on the amount invested excluding land acquisition is 6.80% if floor area is unchanged (total cost ¥2.870 billion, annual GOP ¥195 million), 6.60% at −10%, 6.36% at −20% and 6.07% at −30% — a difference of 0.73 pt. That excludes the land, however, and land does not shrink when the building does. Add ¥1.5 billion of land acquisition and the same comparison becomes 4.47% against 3.64%, widening the gap to 0.83 pt. The burden of lost floor area shows up not in construction cost but in carrying undiminished fixed costs on a thinner revenue capacity.
Bracketing the assumptions with three scenarios and a two-axis grid
The calculation so far rests on single assumptions of ¥90,000/m² for demolition and a 30-month closure. The actual demolition costs confirmed in this article span ¥51,025–146,983/m², a spread of nearly threefold, and the closure period moves with how design, building confirmation and new construction are stacked on top of the published demolition programmes (about 10 months for a 3,500–4,500 m² building). We therefore set out three scenarios flexing demolition cost, FAR reduction and closure period together. All stay within the actual figures and published programmes sourced in this article; no new assumptions are introduced.
| Scenario | Demolition cost per m² | FAR reduction | Closure period | Rooms after rebuild | Total cost | Per room | Annual GOP yield (excl. land) | Same (incl. ¥1.5bn land) |
|---|---|---|---|---|---|---|---|---|
| Optimistic | ¥51,025/m² (the low end of the five contracts; suburban, no pile removal) | ±0% | 24 months | 100 | ¥2.636bn | ¥26.36M | 7.41% | 4.72% |
| Base | ¥90,000/m² (the ¥87,760/m² average of the five contracts, rounded) | −10% | 30 months | 90 | ¥2.663bn | ¥29.59M | 6.60% | 4.22% |
| Pessimistic | ¥146,983/m² (the high end of the five contracts; dense urban, with pile removal) | −30% | 36 months | 70 | ¥2.547bn | ¥36.38M | 5.36% | 3.38% |
Total cost per room spans 1.38×, from ¥26.36 million in the optimistic case to ¥36.38 million in the pessimistic one. On annual GOP yield excluding land acquisition, that is 7.41% against 5.36%, a gap of 2.05 pt. The range is wider than the 0.73 pt from FAR alone because demolition cost and closure period bite at the same time. Note that in the pessimistic scenario total cost itself, at ¥2.547 billion, is lower than the base case (¥2.663 billion) — because room count falls to 70 and new construction cost drops with it. The total goes down while the per-room figure goes up and the yield falls: the effect of lost floor area has to be read per unit, not in aggregate.
Next, we lay out total cost per room across the two axes with the widest spread — demolition cost per m² and FAR reduction. The closure period is fixed at 30 months.
| Demolition cost (¥ per m² of gross floor area, tax incl.) | ±0% | −10% | −20% | −30% |
|---|---|---|---|---|
| 51,025 (low end, Nagasaki City) | ¥27.34M | ¥28.08M | ¥29.00M | ¥30.19M |
| 67,658 (median) | ¥27.92M | ¥28.72M | ¥29.73M | ¥31.02M |
| 90,000 (value used in this article) | ¥28.70M | ¥29.59M | ¥30.71M | ¥32.14M |
| 115,291 (Tsukuba City, former Kamigo High School) | ¥29.59M | ¥30.58M | ¥31.81M | ¥33.41M |
| 146,983 (high end, Yashio City) | ¥30.69M | ¥31.81M | ¥33.20M | ¥34.99M |
The grid runs from ¥27.34 million (demolition at ¥51,025/m², FAR unchanged) to ¥34.99 million (¥146,983/m², FAR −30%) — a spread of only 1.28×. Because new construction accounts for 70% of total cost, a threefold move in demolition cost per m² shifts the per-room figure by only around 12%. Note, though, that the column direction (FAR reduction) and the row direction (demolition cost) are additive, so a dense urban site with pile removal where floor area also shrinks — Type B in this article being the archetype — sees both move against you at once.
Where floor area shrinks, holding and renovating acquires economic logic
Lining up the figures in this article, the structure of the rebuild decision comes out as follows.
| Question | What this article establishes |
|---|---|
| Does floor area shrink? | Designated FAR alone cannot answer it. Assuming a 6 m frontage road, 87.6% of hotel sites in Tokyo’s 23 wards (N=2,663) cannot use their designated FAR, and the unusable portion averages 35.3%. Kyoto City 62.1%, Sendai City 70.1%. |
| What does demolition cost? | ¥51,025–146,983 per m² of gross floor area in municipally published actuals (tax included; 5 contracts, 3 municipalities). Average ¥87,760/m². Nearly a threefold spread depending on pile removal and dense-urban site conditions. Supervision adds a separate 1.88% (Kiryu City actual). |
| Share of total cost | In the 100-room, 3,500 m² model, demolition is 11.0% and forgone GOP during closure 17.0%. Together, 28.0% never appears on a new-construction quotation. |
| How lost floor area bites | A 30% FAR reduction raises total cost per room 12.0%. Annual GOP yield excluding land falls from 6.80% to 6.07% (−0.73 pt); including ¥1.5 billion of land, from 4.47% to 3.64% (−0.83 pt). |
| Scale of the stock | National demolition runs 108,609 buildings and 22,826,516 m² a year (June 2025 – May 2026). Non-residential is 46.1% of floor area. Accommodation use cannot be isolated from this survey. |
What follows is not a conclusion that one option is better than the other. It is a conditional proposition: where floor area shrinks, there is economic logic in not rebuilding — in holding the property as a legally non-conforming existing building and extending its life through renovation. Continuing to use a legally non-conforming building is lawful, and works that stay within the scope of major repairs or major alterations avoid the situations where current FAR rules apply in full. Our analysis of five REITs’ IR disclosures puts capital expenditure at ¥134,000 to ¥624,000 per room a year; set against total rebuild cost of ¥28.70 million per room, renovation stands up at least as a way of buying time.
Conversely, where the frontage road is wide and the designated FAR can be fully used — on our figures, assuming a 10 m width, 97.9% of sites in Sendai City, 83.4% in Kyoto City and 74.2% in Tokyo’s 23 wards can secure their designated FAR — rebuilding modernises guest-room size and specification without losing floor area. For the same “ageing hotel,” road-access conditions can reverse which move to make. That is the point of adding FAR and demolition cost as two further axes to the retrofit-or-rebuild question for pre-1981 stock.
Three practical implications. First, confirm frontage road width and base FAR at the due diligence stage. A development-capacity calculation that looks only at designated FAR will overstate the case on tight central-city sites. Second, hold demolition cost as a rate per m² of gross floor area. As the five contracts here show, the rate moves threefold with pile removal and dense-urban site conditions; going into an acquisition with a view on “what it would cost to tear down” gives you material for price negotiation. Third, make the closure period explicit as a cost. Thirty months of forgone GOP is 17.0% of total cost — larger than demolition itself.
A note on supply-side context. Within the scope MetroEngines Research tracks, there are 27,162 accommodation properties and 1,266,933 rooms with confirmed operations nationwide (values retrieved as of 1 September 2026). Openings confirmed for 2026 number 1,369 properties averaging 26 rooms, of which whole-house rentals are the largest group at 658 and business hotels number 149. With new supply centred on smaller formats, how the existing mid-size stock is handled becomes a question that feeds directly into total room supply in the market.
Related reading
- Hotel Development Capacity 2026: Zoning, FAR & Land Price in 5 Markets
- Japan’s Pre-1981 Hotel Stock: 236k Rooms, 19.1% — Retrofit or Rebuild
References and Sources
■ Data sources
Zoning designations and designated FAR come from the city planning decision GIS data in MLIT’s Real Estate Information Library, overlaid with the accommodation properties we track that have at least 10 guest rooms and known coordinates (Tokyo 23 wards N=2,663 / 99.0% match rate, Kyoto City N=1,194 / 98.9%, Sendai City N=187 / 95.9%, retrieved 1 September 2026). Demolition costs are five contracts published by three municipalities in bid results, contract bills and project outline documents (limited to cases where both the contract value and the gross floor area are published). Demolished building counts, floor areas and assessed values are from MLIT’s “Statistical Survey on Building Demolition” (government statistics code 00600240), June 2025 through May 2026. Estimated settled ADR, estimated occupancy and property and room supply are aggregated data from MetroEngines Research & Consulting (27,162 properties and 1,266,933 rooms nationwide, retrieved 1 September 2026).
■ Calculation assumptions
The rebuild model is a 100-room, 3,500 m² building (35.0 m² of gross floor area per room, citing the 31-project average from our earlier article), with demolition at ¥90,000/m² (the ¥87,760/m² simple average of the five contracts here, rounded), new construction at ¥20.67 million per room (from our earlier article), estimated settled ADR of ¥19,100 (Chuo Ward, Tokyo; median of ¥19,116 for September 2025 – August 2026, N=152 properties), occupancy of 80% (an assumption, set conservatively below our estimated OCC of 93.1% for Tokyo as of July 2026, covering 1,354 properties and 182,896 rooms), a GOP margin of 35% (conservative against the 38.9% actual disclosed by Invincible Investment Corporation across 91 MHM-operated properties, fiscal period ended December 2024) and a 30-month closure as the base case. The ranges in the three scenarios and the two-axis grid are all set within the actual demolition costs sourced in this article (¥51,025–146,983/m²) and the published programmes; no new assumptions are introduced.
■ Limitations and caveats
Frontage road widths are assumed values of 4 m, 6 m, 8 m and 10 m, and on an individual site the outcome changes with corner-lot relaxations, specified-road relaxations, the comprehensive design system and urban regeneration special districts. Because registry records and building confirmation documents were not consulted, this does not determine whether any individual property is legally non-conforming; what it identifies are site types where the risk is more likely to materialise. The rebuild calculation is a simplified one excluding land acquisition, design fees, asbestos abatement, neighbourhood compensation and temporary relocation costs. The “Statistical Survey on Building Demolition” splits use only into residential and other, so accommodation use cannot be isolated, and no estimated breakdown by use has been constructed. ADR and occupancy are estimates based on OTA published inventory and differ from each property’s actual transaction prices and accounting figures.
■ Market data
- MetroEngines Research & Consulting — estimated settled ADR, estimated occupancy, property and room supply (27,162 properties and 1,266,933 rooms nationwide, retrieved 1 September 2026), 1,369 openings in 2026
■ Legislation and government statistics
- Building Standards Act (e-Gov Japanese Law Search) — Article 3(2) (legally non-conforming buildings), Article 52 (floor area ratio)
- MLIT Real Estate Information Library — city planning decision GIS data (zoning, designated FAR, building coverage ratio)
- MLIT “Statistical Survey on Building Demolition” (e-Stat, government statistics code 00600240) — summary and prefectural tables (June 2025 through May 2026, published 31 August 2026)
- MLIT “Survey of Demolished Buildings”
- Kyoto City, “Height Control Districts” (City Planning Division, Urban Planning Bureau, updated 23 April 2026)
- Japan Tourism Agency, “Town Development Support Programme for Regional Hot Spring Resorts through Removal and Regeneration of Derelict Buildings” (FY2026)
■ Municipal bid results and contract disclosures (primary sources for demolition cost)
- Nagasaki City, “February 2025 Council Session, Education and Welfare Committee Materials, Bill No. 44: Conclusion of a Construction Contract — Kinkai Junior High School Buildings and Other Structures, Demolition”
- Tsukuba City, “Bid Results, bids opened 31 July 2025 (demolition works)” (former Kamigo High School demolition) / the same bid notice (project outline)
- Tsukuba City, “Bid Results, bids opened 29 August 2025” (Iwasaki Nursery School and Kamihirooka Nursery School demolition)
- Yashio City, “Bill No. 85: Conclusion of a Variation to a Construction Contract (Yashio City Former City Hall Demolition)” (submitted 22 July 2025)
- Yashio City, “Document 1: Outline of the Yashio City Former City Hall Demolition Works” (works briefing, 4 February 2024)
- Kiryu City, “Conclusion of the Construction Contract for the Demolition of the Former Kiryu City Main Hall” / the same, “Conclusion of the Supervision Services Contract for the Demolition of the Former Kiryu City Main Hall”
■ Construction cost and GOP benchmarks
- MLIT “Building Construction Starts Statistics”
- Invincible Investment Corporation, “Financial Results Presentation for the Fiscal Period Ended December 2024” (disclosed 26 February 2025) — GOP ratio of 38.9% across 91 MHM-operated properties (+1.6 pt year on year) / the same, portfolio (monthly occupancy, ADR and RevPAR by property)