

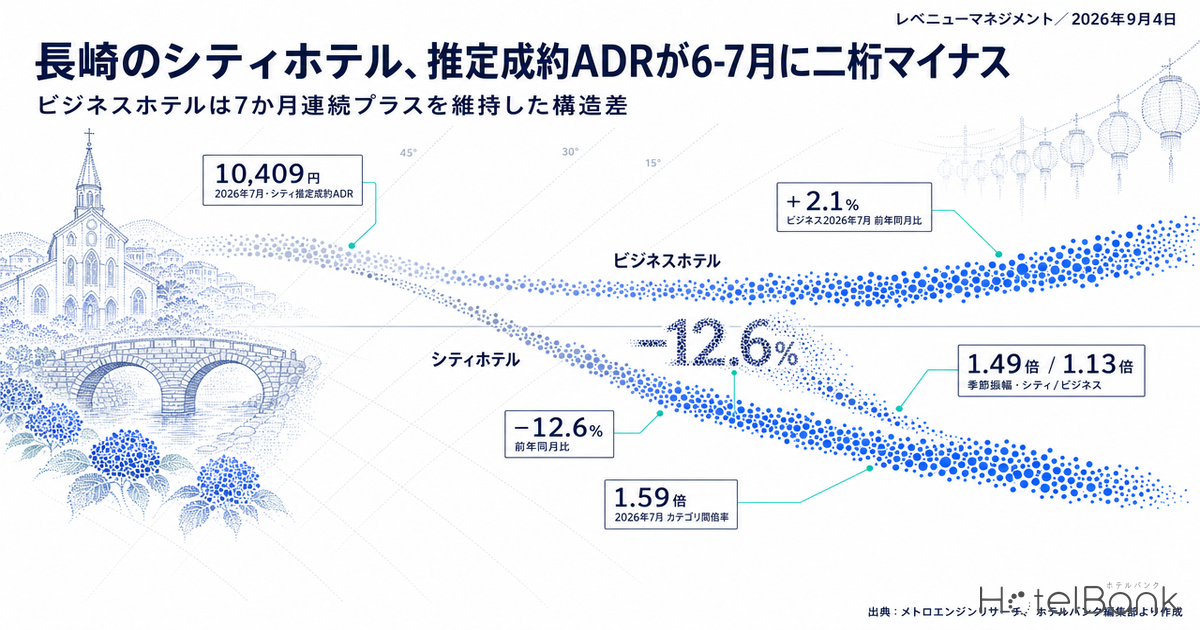
The estimated settled ADR for city hotels in Nagasaki Prefecture came to ¥10,409 in July 2026 (N=24 properties), down −12.6% from ¥11,916 (N=25 properties) a year earlier. June was −12.9%, making two consecutive months of double-digit declines. Yet business hotels in the same prefecture recorded ¥6,562 in July 2026 (N=127 properties), +2.1% year on year. Every month from January through July was positive, within a narrow band of +0.2% to +5.9%. Same prefecture, same months, same finalized measurement basis — and yet city hotels fell by double digits while business hotels edged up. City hotels had even been in positive territory at +12.2% in February 2026. That is a swing of more than 20 percentage points in six months. This article breaks down where that structural difference comes from, using four angles: year-on-year comparisons between finalized months, seasonal amplitude, estimated occupancy by day of week, and recent booking pace — and turns them into yardsticks that revenue managers selling rooms in Nagasaki can apply in practice.
Scope: city hotels in Nagasaki Prefecture N=24 properties, business hotels N=127 properties (as of July 2026). Price figures in this article are estimated settled ADR (the transaction price level estimated from OTA and other sales data, tax-exclusive equivalent); occupancy is an estimate based on OTA-listed inventory. Full definitions appear at the end of the article. Data as of September 4, 2026.
- — Estimated settled ADR for city hotels in Nagasaki Prefecture was ¥10,409 in July 2026 (N=24 properties), −12.6% year on year. June was −12.9% — two straight months of double-digit declines.
- — Business hotels were positive in all seven months from January to July 2026 (+0.2% to +5.9%). Same prefecture, same finalized basis, opposite directions by property type.
- — Within-year seasonal amplitude is 1.49x for city hotels and 1.13x for business hotels. City hotels absorb demand swings through price; business hotels absorb them without moving price.
- — Even among Saturdays, Sep 19 stood at an estimated OCC of 88.6% at 45 days out (city hotels, stay date September 19, 2026, as of 45 days prior) versus 71.6% for Sep 26 (same basis, stay date September 26, 2026) — a 17-point gap. Pricing calendars need to be built around connection to long weekends, not day-of-week labels.
City hotels: from +12.2% in February to −12.6% in July, a reversal in six months
First, a note on the ground rules. The estimated settled ADR used here mixes two measurement bases: months priced off confirmed history (past months) and months priced off current sales conditions (the current month and future months). Taking a year-on-year comparison across months on different bases measures the difference in basis rather than movement in the market. Every year-on-year figure in this article is therefore built only from pairs on the finalized basis — January to July 2025 against January to July 2026. Months from August 2026 onward sit on a different basis and are excluded from year-on-year comparison here.
On that finalized pairing, the estimated settled ADR for Nagasaki city hotels clearly bends in the first half of the year. January was ¥11,732, essentially flat at −2.0%; February was ¥14,968, a strong +12.2%. From there the declines widened month by month — March −1.4%, April −6.5%, May −5.7% — reaching double digits at −12.9% in June and −12.6% in July. Averaged across January to July, 2026 came to ¥11,924 against ¥12,402 in 2025, a decline of −3.9%. In other words, the full-period picture is a softening of a few percent, but its composition is “spring-to-summer declines eating up an early-year gain.” Summarizing this simply as “Nagasaki city hotels got cheaper” would miss what happened in February.
Source: MetroEngines Research; compiled by the HotelBank Editorial Team
Plotting the years on top of one another shows that Nagasaki city hotels follow much the same seasonal shape every year: peaks in February, May, August and October–November, troughs in March, June, September and December. That contour is common to 2024, 2025 and 2026. What changed is the depth of the troughs. The June trough was ¥11,255 in 2024 and ¥11,502 in 2025, but fell to ¥10,016 in 2026. July likewise went from ¥12,012 in 2024 and ¥11,916 in 2025 to ¥10,409 in 2026. Since the February peak in 2026 was the highest of the three years at ¥14,968, the more accurate reading is not that the ability to capture the upside weakened, but that the ability to defend the troughs weakened.
Business hotels were positive in all seven months — how to line up the year-on-year figures
By contrast, the estimated settled ADR for business hotels in Nagasaki Prefecture exceeded the prior year in every month from January to July 2026: January +3.2%, February +4.9%, March +3.2%, April +0.8%, May +5.9%, June +0.2%, July +2.1%. The maximum was +5.9% and the minimum +0.2% — seven straight months inside a narrow positive band. The January–July average was ¥6,688 in 2026 against ¥6,498 in 2025, or +2.9%. This run of seven positive months has been sustained despite new supply in Nagasaki Prefecture reaching 23 properties and 521 rooms in 2026, roughly 2.6 times the prior year.
Source: MetroEngines Research; compiled by the HotelBank Editorial Team
Placing the two year-on-year series side by side shows that the very character of the movement differs. Business hotels merely oscillate within a band of 0% to +6%, with a month-to-month spread of just under six points. City hotels swing across 25 points, from +12.2% to −12.9%. That difference in swing shows up not only in the year-on-year figures but also in seasonal amplitude within the year. For January to July 2026, the ratio of the highest month for city hotels (February, ¥14,968) to the lowest (June, ¥10,016) is 1.49x. For business hotels, the highest month (May, ¥7,196) to the lowest (June, ¥6,393) is only 1.13x. Put another way, city hotels are structured to absorb seasonal demand swings through price, while business hotels absorb them with price held almost still.
| Stay month | City 2025 | City 2026 | YoY | Business 2025 | Business 2026 | YoY |
|---|---|---|---|---|---|---|
| January | ¥11,969 | ¥11,732 | −2.0% | ¥6,440 | ¥6,644 | +3.2% |
| February | ¥13,343 | ¥14,968 | +12.2% | ¥6,571 | ¥6,894 | +4.9% |
| March | ¥11,989 | ¥11,821 | −1.4% | ¥6,486 | ¥6,691 | +3.2% |
| April | ¥11,637 | ¥10,881 | −6.5% | ¥6,390 | ¥6,438 | +0.8% |
| May | ¥14,461 | ¥13,638 | −5.7% | ¥6,792 | ¥7,196 | +5.9% |
| June | ¥11,502 | ¥10,016 | −12.9% | ¥6,381 | ¥6,393 | +0.2% |
| July | ¥11,916 | ¥10,409 | −12.6% | ¥6,426 | ¥6,562 | +2.1% |
| Jan–Jul average | ¥12,402 | ¥11,924 | −3.9% | ¥6,498 | ¥6,688 | +2.9% |
Estimated settled ADR (tax-exclusive equivalent); all months on the finalized basis on both sides. N = city hotels 25 properties in 2025 / 24 in 2026; business hotels 121–122 properties in 2025 / 124–128 in 2026. Source: MetroEngines Research; compiled by the HotelBank Editorial Team
There is one more shift visible in this table: the ratio between city and business hotel estimated settled ADR. In July 2025 city hotels sat at 1.85x business hotels; in July 2026 that had narrowed to 1.59x. June likewise narrowed from 1.80x to 1.57x. February moved the other way, widening from 2.03x to 2.17x. The price gap between categories is not fixed — it contracts in some months and widens in others. A narrowing ratio in summer means the price bands of the upper and lower categories are converging, so that from the guest’s point of view the options overlap more. This ratio tells you exactly when rate fences are most likely to thin out.
What day-of-week estimated occupancy reveals about the difference in demand base
To test whether the difference in price behavior is rooted in a difference in the nature of demand, look at occupancy rather than price. Averaging estimated OCC (based on OTA-listed inventory) for Nagasaki Prefecture across June–August 2026 (three months, by stay date) for each day of the week, the two categories trace entirely different shapes.
Source: MetroEngines Research; compiled by the HotelBank Editorial Team
City hotels stand out on Saturday at 89.9%, with troughs on Monday (80.5%) and Sunday (81.3%) — a weekend-led shape. Business hotels peak mid-week, at 88.7% on Wednesday, 88.8% on Thursday and 87.6% on Tuesday, with Sunday lowest at 78.8% — a weekday-led shape. Business hotels are also high on Saturday at 88.4%, but Saturday does not stand out the way it does for city hotels; it sits roughly level with Tuesday through Thursday. Three-month average estimated OCC runs 83.4–85.0% for city hotels and 85.0–86.5% for business hotels, so the levels themselves are not far apart (coverage: 24 city hotel properties, 115 business hotel properties).
What follows from this is that business hotel occupancy rests on weekday demand present nearly every day of the week, giving them three or four days a week that fill without large price moves. That is precisely why their year-on-year figures stay inside a narrow +0.2% to +5.9% band. City hotels, by contrast, concentrate their dependence on a single peak — Saturday — and competition for that peak feeds straight into price. The explanation that price adjustments made to fill Saturdays during the shoulder period between the rainy season and the summer holidays pulled down the whole category’s level in June and July is consistent with the day-of-week shape.
How the near term is selling — the same Saturday, completely different pace
So how are the stay dates ahead actually selling? Using booking curves based on observations from 45 days before the stay date through to the present, compare representative dates in September and October. September 19 (Saturday) is the first day of the three-day weekend that includes Respect for the Aged Day; city hotels were already at 88.6% at 45 days out, 89.4% at 30 days and 92.1% at 15 days — high throughout, from early on. Business hotels built up as well, from 85.5% at 45 days to 88.2% at 30 days and 93.2% at 15 days.
| Stay date | City, 45 days out | City, 30 days out | Business, 45 days out | Business, 30 days out |
|---|---|---|---|---|
| September 19 (Sat, start of long weekend) | 88.6% | 89.4% | 85.5% | 88.2% |
| September 24 (Thu) | 69.7% | 72.3% | 68.5% | 71.6% |
| September 26 (Sat) | 71.6% | 74.7% | 73.4% | 75.8% |
| October 1 (Thu) | 79.9% | 81.6% | 72.1% | 74.6% |
Estimated OCC (based on OTA-listed inventory). Based on observations from 45 days before the stay date through to the present. N = 24 city hotel properties, 115 business hotel properties. Source: MetroEngines Research; compiled by the HotelBank Editorial Team
What deserves attention is that two Saturdays — September 19 and September 26 — differ by 17 points at 45 days out (city hotels). It is not “strong because it is a Saturday” but “strong because it is a Saturday attached to a long weekend.” For September 26 (Saturday), city hotels moved from 71.6% at 45 days to 74.7% at 30 days, an addition of just 3.1 points over 15 days — barely different from the 2.6 points added on the weekday of September 24 (Thursday). Building a pricing calendar from day-of-week labels alone means losing this distinction. October 1 (Thursday), meanwhile, shows city hotels at 79.9% rising to 81.6%, ahead of business hotels (72.1% to 74.6%) — so there are weekdays on which city hotels fill first. Results from tracking early-September stay dates by property type from the same 45-day starting point are collected in Nagasaki Early Sep Booking Curves: 9/12 OCC 82.7%, Ryokan 24.2pt Gap.
For revenue managers running city and business hotels in Nagasaki — implications and an action plan
(1) Read it as “cut down in the troughs,” not “softened over the year.” The January–July average for city hotels is −3.9%, but that figure is the composite of +12.2% in February and −12.9% in June and −12.6% in July. Looking at your own year-on-year performance only in annual or half-year totals makes it impossible to tell whether you are earning on the peaks or being eroded in the troughs. Re-sorting your year-on-year figures at least monthly — and ideally into two groups, “peak months” and “trough months” — makes it clear whether the right move is raising prices or defending a floor. The market trough is June (city hotels ¥10,016) and the peak is February (¥14,968).
(2) The more the ratio between categories narrows, the more rate-fence design matters. The city-to-business ratio narrowed from 1.85x in July 2025 to 1.59x in July 2026. When upper-category prices approach those below them, more decisions get made on price proximity rather than differences in facilities or service. In the months when the ratio narrows (June and July), there is more room to protect rate integrity by making the reason for the price gap visible through added value — breakfast, late check-out, higher floors — than by cutting the room-only entry rate to chase volume. Conversely, February, when the ratio widened (2.03x to 2.17x), can be read as a month in which the upper price band could be pursued directly.
(3) Build the pricing calendar around connection to long weekends, not day-of-week labels. September 19 (Saturday) and September 26 (Saturday) are both Saturdays, yet their estimated OCC at 45 days out differs by 17 points — 88.6% versus 71.6%. And September 26’s build from 45 days to 30 days was 3.1 points, almost the same as the 2.6 points on the weekday of September 24 (Thursday). Applying a uniform weekend rate by day of week means losing share on Saturdays that are not attached to a long weekend, and leaving money on the table on those that are. The effective sequence is to segment first by connection to holidays and their adjacent days, and only then put day of week on the second axis.
(4) For business hotels, the value is in not moving. Nagasaki’s business hotels have been positive year on year for seven consecutive months, and their within-year seasonal amplitude stays at 1.13x. Given that estimated OCC on Tuesday through Thursday holds steady at 87.6–88.8%, holding the level on weekdays is more consistent with the shape of the market than moving prices up and down frequently. What is more worth working on is Sunday (78.8%), which should be treated as a separate day where the weekday operating logic does not fill rooms on its own.
| Time frame | Action | Decision trigger | Objective |
|---|---|---|---|
| Today to this week | Re-sort your own ADR for the past three months monthly, on year-on-year pairs of finalized months | Check whether your June and July move with or against the market (city −12.9% / −12.6%, business +0.2% / +2.1%) | Separate market factors from property-specific factors |
| Today to this week | Reclassify September–October inventory into three groups: long-weekend-attached dates, stand-alone Saturdays, and weekdays | Reflect in the calendar the fact that two Saturdays split to 88.6% and 71.6% in estimated OCC at 45 days out | Recover what uniform day-of-week operation leaves behind |
| Within two weeks | Document a floor price for the trough month (June), by category | Whether your own trough-month level has settled well below the market trough (city ¥10,016 / business ¥6,393) | Put a brake on rate erosion in the shoulder season |
| Within two weeks | For city hotels, take stock of value-added plans that justify the price gap (meals, timing, room type) | Whether your entry rate overlaps the price band of the category below, now that the inter-category ratio has narrowed from 1.85x to 1.59x over the summer | Rebuild the rate fence |
| Looking to next month | Prepare one dedicated selling condition for Sundays (estimated OCC 78.8%; average across June–August 2026 stay dates, business hotels, N=115 properties) | If Sunday remains the weakest day of the week, roughly 10 points below Tuesday–Thursday (87.6–88.8%) | Lift the thinnest day of the week |
| Looking to next month | Redesign the annual rate-revision calendar around “peak months = February and May / trough month = June” | Compare your own amplitude against the market’s within-year amplitude, which differs sharply by type at 1.49x for city hotels and 1.13x for business hotels | Optimize revision frequency to the seasonal shape |
The above are considerations derived from market data and do not guarantee results. Please judge them against your own sales performance and market conditions.
Summary — three yardsticks for Nagasaki
Yardstick 1: split year-on-year figures into “peak months” and “trough months.” Nagasaki city hotels averaged −3.9% across January to July, but February was +12.2% and June was −12.9%. An average cancels the two out. Re-sorting your own numbers the same way separates the months for pursuing the price ceiling from the months for defending the floor.
Yardstick 2: use the inter-category ratio to measure how well the price gap explains itself. The city-to-business ratio narrowed to 1.59x in July 2026 (1.85x a year earlier). Months in which the ratio narrows are months for preparing reasons for the price gap, not for adjusting price itself.
Yardstick 3: put the shape of demand — day of week and long-weekend connection — ahead of price. City hotels are weekend-led at 89.9% on Saturday; business hotels are weekday-led at 87.6–88.8% Tuesday through Thursday. And even among Saturdays, estimated OCC at 45 days out splits between 88.6% and 71.6%. Fixing the shape first and applying price second is a practical breakwater against double-digit downside.
Heading into the second half of 2026, the question is how far Nagasaki’s city hotels can recover the June–July trough. Note, however, that estimated settled ADR for the current and future months is calculated on a different basis from the finalized one, so year-on-year comparisons on the finalized basis only become usable once each month is finalized. What can be confirmed at this point is the structural difference visible across January to July on the finalized basis — and that difference reduces to a single point: demand has a different day-of-week shape by property type, and that shows up as a difference in the amplitude of price. One further note: from October, a travel subsidy programme covering seven Kyushu prefectures including Nagasaki begins, which may shift the demand-side assumptions themselves (the actual pace of inventory pickup is tracked on an ongoing basis in Kyushu Subsidy Starts Oct 1 in 7 Prefectures: Nov Pickup Level with Oct).
About the data
• Definition of estimated OCC (based on OTA-listed inventory): OTA-listed-inventory occupancy = 100 − 100 × rooms remaining on OTA listings ÷ total rooms. This is an estimate based on the pickup of inventory offered for sale on OTAs, and is defined differently from actual room occupancy (it reads higher). The day-of-week aggregation in this article covers stay dates from June to August 2026 (Nagasaki Prefecture; 24 city hotel properties / 115 business hotel properties).
• Booking curves: based on observations from 45 days before the stay date through to the present. Covers stay dates of September 19, 24 and 26 and October 1, 2026 (Nagasaki Prefecture).
• Definition of estimated settled ADR: the transaction price level (tax-exclusive equivalent) estimated from OTA and other sales data (lowest-plan level × property-type coefficient, ensembled across multiple channels). Past months are finalized values; the current and future months are estimates based on current sales conditions. Median error against published operating results is 6.6%. All year-on-year figures in this article are calculated from pairs of finalized values, and months on a different basis (August 2026 onward) are excluded from comparison.
• Breakdown of N: estimated settled ADR — city hotels (Nagasaki Prefecture) N=25 properties in 2025 / 24 in 2026; business hotels (Nagasaki Prefecture) N=121–122 properties in 2025 / 124–128 in 2026. Estimated OCC — 24 city hotel properties, 115 business hotel properties (as of July 2026). Ryokan and resort categories are not included in the scope of this article.
• Data as of September 4, 2026. Sales conditions and inventory change daily, so the figures in this article are a snapshot as of the time of retrieval.
References and sources
■ Data sources
Estimated settled ADR uses area-level monthly aggregation for city and business hotels in Nagasaki Prefecture (January 2024 to July 2026); estimated OCC uses daily inventory observations for the same prefecture (stay dates from June to August 2026); booking curves use observation series tracking the stay dates of September 19, 24 and 26 and October 1, 2026 from 45 days out. All aggregated by MetroEngines Research.
■ Calculation assumptions
Year-on-year figures are calculated only from pairs on the finalized basis (finalized values for past months); months based on the current or future months (August 2026 onward) are excluded from comparison. Day-of-week estimated OCC is a simple average of stay dates from June to August 2026 by day of week. Booking curves are limited to observations within a lead time of 45 days, comparing point values at 45, 30 and 15 days out. The inter-category ratio is estimated settled ADR for city hotels ÷ estimated settled ADR for business hotels; seasonal amplitude is the highest month within the year ÷ the lowest month.
■ Limitations and caveats
Estimated OCC is an estimate based on the pickup of OTA-listed inventory and reads higher than actual room occupancy. Estimated settled ADR is an estimate carrying a median error of 6.6% against published operating results. The number of properties aggregated varies by month and stay date; on an observation basis it ranged from 22 to 24 city hotel properties and 108 to 116 business hotel properties (the figures cited in the text are representative values). In addition, a demand-stimulus programme begins in seven Kyushu prefectures including Nagasaki from October 2026, so the demand environment assumed in this article may change from October onward. This article is intended to convey market levels and does not guarantee sales decisions for individual properties.
• Cabinet Office, “About National Holidays” https://www8.cao.go.jp/chosei/shukujitsu/gaiyou.html (used to confirm the September 2026 holiday calendar)
• Estimated settled ADR and estimated OCC: MetroEngines Research; compiled by the HotelBank Editorial Team
Related reading
- Nagasaki Early Sep Booking Curves: 9/12 OCC 82.7%, Ryokan 24.2pt Gap
- Kyushu Subsidy Starts Oct 1 in 7 Prefectures: Nov Pickup Level with Oct
- Autumn School Trips: Weekday Rate Floors in 5 Areas, Nagasaki +1.6pt
- Nagasaki Kunchi vs. Kishiwada Danjiri: Weekday vs. Weekend Hotel Demand
- Kumamoto Day-of-Week Occupancy Inverts by Type: Thu 88.3% vs Sat 89.9%
- Why Kyoto ADR Broke in Early Summer 2026: City −16.8%, Business −13.0%
- Miyagi Settled ADR: City −11.5% vs Business +8.5% in July 2026