

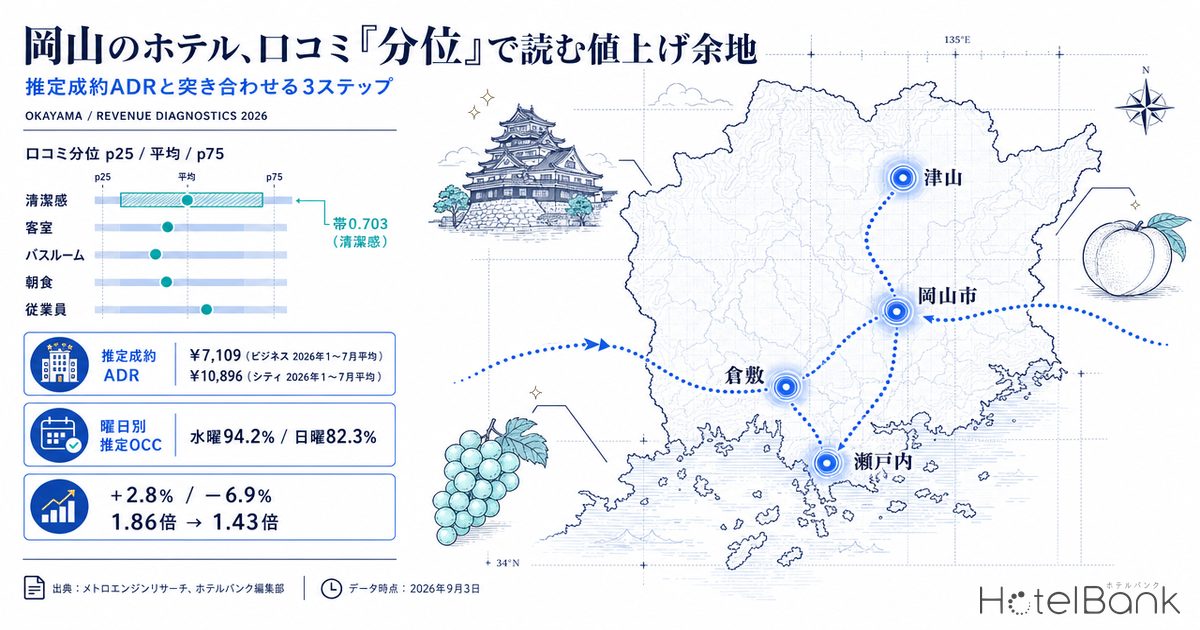
Break the guest-review scores of Okayama Prefecture’s business hotels down by category and the in-prefecture distribution looks completely different from one category to the next. Staff averages 4.079, with the middle 50% of properties contained in a 3.927–4.333 band (0.406 wide). Cleanliness runs 3.621–4.324 (0.703), a band nearly 1.7 times wider. The former is a category where properties barely separate; the latter is one where they clearly do. The same 0.1 of improvement moves your in-prefecture ranking differently in each.
Then the price side. Estimated settled ADR (confirmed) averaged ¥7,100 for business hotels over January–July 2026, against ¥6,900 in the same period a year earlier (N=92–96 properties), and ¥10,900 for city hotels against ¥11,700 (N=17–18 properties). Business hotels are up 2.8% year on year while city hotels are down 6.9%, and the gap between them has narrowed from 1.86x in July 2025 to 1.43x in July 2026. City hotels score higher on nine of the ten review categories, yet the price gap is closing. This article sets out a three-step self-diagnosis that uses review quartiles (p25 / median / p75) to separate the categories where you have pricing headroom from the ones that need improvement spending.
Scope: business hotels in Okayama Prefecture (review benchmarks N=12–65 properties / 451–17,599 reviews; estimated settled ADR N=92–96 properties) and city hotels (review benchmarks N=7–11 properties / 169–5,541 reviews; estimated settled ADR N=17–18 properties). The price metric in this article is estimated settled ADR (the settled price level inferred from OTA and other sales data, tax-exclusive equivalent); occupancy is an estimate based on OTA-listed inventory. Definitions for both appear at the end of the article. Data as of September 3, 2026.
- — Okayama’s business hotels show review-category bands that differ in width by as much as 1.9x. Cleanliness spreads the middle 50% across 0.703, while Breakfast covers only 0.365. Some categories reward improvement with a move up the in-prefecture ranking; others do not.
- — Estimated settled ADR averaged ¥7,109 (+2.8% year on year) for business hotels over January–July 2026 and ¥10,896 (−6.9%) for city hotels. The price multiple between them narrowed from 1.86x to 1.43x in a year.
- — City hotels score higher on 9 of the 10 review categories, but their edge is concentrated in food: Breakfast +0.424 and Meals +0.357. Staff +0.117 and Location +0.139 are close to even.
- — Estimated OCC in August 2026 was 94.2% on Wednesdays and 82.3% on Sundays — an 11.9-point gap. In our illustrative calculation, the day-of-week trough is more than five times larger per room than the effect of moving rate by 2.6%.
- — Overlay your own scores on p25 / mean / p75 and split them: “narrow band and above p75” goes into price, “wide band and near p25” goes into improvement spending. Three steps, set out below.
Okayama business hotels: read the band width, not the score height
The chart below shows, for business hotels in Okayama Prefecture, the in-prefecture distribution of each review category as a band (p25–p75, the middle 50%) together with the mean. Guest reviews from the past 24 months are aggregated per property, and the distribution is taken across those per-property averages.
Source: compiled by the HotelBank Editorial Team
The highest means are Amenities 4.144 (12 properties / 451 reviews), Location 4.105 (60 / 9,982) and Staff 4.079 (49 / 4,755). The lowest is Bathroom 3.550 (59 / 11,101), followed by Facilities 3.803 (47 / 4,307) and Service 3.868 (62 / 14,361). None of that is surprising. What matters operationally is not the height of the mean but the width of the band.
The widest bands are Cleanliness (p25 3.621 – p75 4.324, width 0.703), then Rooms (3.565–4.240, 0.675) and Bathroom (3.199–3.872, 0.673). These three are where properties visibly separate within the prefecture, which makes them the areas where improvement moves your in-prefecture position. Cleanliness in particular is a category guests mention heavily: our tag analysis of 12,733 hotels nationwide found that foreign-language reviews mention it 1.5 times as often as Japanese-language ones. The narrow bands are Breakfast (3.700–4.065, width 0.365) and Staff (3.927–4.333, 0.406). Almost every property clusters at much the same level on these two, so scoring slightly above the mean is weak differentiation. Read the other way round: clearing the Staff p75 of 4.333 means standing out clearly inside a narrow band.
Amenities has the highest mean but the smallest base — 12 properties and 451 reviews. Values drawn from thin samples move around, so when you place your own property, give priority to the categories with heavy review counts: Rooms, Service and Cleanliness.
City hotels lead on almost every category, but the price gap is closing
Run the same aggregation for city hotels and they beat the business-hotel mean on nine of the ten categories. The margins, though, are far from uniform.
| Category | Business mean (p25–p75) |
City mean (p25–p75) |
Gap | N (properties / reviews) Business | City |
|---|---|---|---|---|
| Breakfast | 3.891 (3.700–4.065) | 4.315 (4.111–4.476) | +0.424 | 39 / 4,509 | 9 / 1,815 |
| Meals | 3.942 (3.663–4.231) | 4.299 (4.143–4.494) | +0.357 | 35 / 1,864 | 10 / 850 |
| Rooms | 3.884 (3.565–4.240) | 4.090 (3.858–4.428) | +0.206 | 65 / 17,599 | 11 / 5,541 |
| Service | 3.868 (3.595–4.164) | 4.043 (3.782–4.264) | +0.175 | 62 / 14,361 | 11 / 4,875 |
| Bathroom | 3.550 (3.199–3.872) | 3.700 (3.377–4.067) | +0.150 | 59 / 11,101 | 11 / 3,385 |
| Cleanliness | 3.896 (3.621–4.324) | 4.043 (3.782–4.450) | +0.147 | 57 / 9,622 | 11 / 3,042 |
| Facilities | 3.803 (3.509–4.155) | 3.951 (3.611–4.246) | +0.148 | 47 / 4,307 | 10 / 1,394 |
| Location | 4.105 (3.868–4.389) | 4.244 (3.943–4.489) | +0.139 | 60 / 9,982 | 11 / 3,224 |
| Staff | 4.079 (3.927–4.333) | 4.196 (4.036–4.507) | +0.117 | 49 / 4,755 | 10 / 1,325 |
| Amenities | 4.144 (3.832–4.386) | 4.138 (3.706–4.417) | −0.006 | 12 / 451 | 7 / 169 |
Source: compiled by the HotelBank Editorial Team (Okayama Prefecture; guest reviews over the past 24 months, aggregated per property)
The large gaps are Breakfast +0.424 and Meals +0.357. The restaurant operation city hotels carry, and the work they put into breakfast, show up directly as a rating gap. Staff +0.117, Location +0.139 and Amenities −0.006, by contrast, are close to nothing. In Okayama, in other words, business hotels have effectively caught up on service and location, and the city-hotel advantage sits mainly in food. The same comparison run for Osaka — our analysis of Osaka review scores against estimated settled ADR — also found that meals were the one category able to explain the city-versus-business price gap.
Estimated settled ADR: business +2.8%, city −6.9%, and a narrowing gap
Now the price side, year over year. The figures below are confirmed estimated settled ADR for Okayama Prefecture (January–December 2025 and January–July 2026).
Source: compiled by the HotelBank Editorial Team from MetroEngines Research
Business hotels averaged ¥7,109 over January–July 2026 (N=92–96 properties), up 2.8% on a year-on-year month basis against ¥6,914 in the same period last year. By month, the year opened strong — January +9.7%, February +7.1% — before settling back to roughly last year’s level more recently, with June at −3.9% and July at −0.3%. The confirmed July figure was ¥7,069 (N=95 properties), almost identical to ¥7,092 in July last year.
City hotels averaged ¥10,896 over January–July 2026 (N=17–18 properties), down 6.9% from ¥11,705 a year earlier. Some months were positive — March +4.9%, May +2.3% — but the second-half drop was steep, with June at −16.6% and July at −23.3%. As a result, the city-to-business price multiple narrowed from 1.86x in July 2025 to 1.43x in July 2026. As the previous section showed, city hotels score higher on nine of the ten review categories, and yet the price gap has visibly closed within a single year. One caveat: the city-hotel sample is limited to around 17 properties, so a change of sales policy at a handful of them moves the overall average easily. A thin base of this kind widens the year-on-year swing itself, which is why city-hotel year-on-year figures in prefectures of this size should be read with that discount applied.
For August onward, current estimates based on live sales conditions run ¥9,214–¥10,571 for business hotels and ¥14,145–¥18,923 for city hotels. These are computed on a different basis from confirmed values and move with day-to-day sales, so they should not be compared directly with confirmed figures; wait for month-end confirmation before judging them.
The demand base: a 12-point gap across the week
Before talking about pricing headroom, it is worth fixing how thick demand actually is. Estimated OCC (based on OTA-listed inventory) for Okayama Prefecture business hotels in August 2026 averaged 89.6% for the month (87–88 properties, 10,958 rooms, with observation coverage of 94.5%). Averaged by day of week, it looks like this.
Source: compiled by the HotelBank Editorial Team from MetroEngines Research
The highest day is Wednesday at 94.2%, followed by Thursday at 93.2%. The lowest is Sunday at 82.3%, 11.9 points below Wednesday. Within the month the high was 98.1% on Saturday, August 22, and the low 76.4% on Sunday, August 30. Thick midweek and thin on Sunday: the shape you would expect in an area whose demand is driven by business travel. A structural Sunday vacancy also means that the pricing response for filling Sundays and the pricing response for not leaving weekday revenue on the table have to be designed separately. On how to handle the Sunday trough, our examination of Aichi’s 12.6-point Sunday gap against Saturday is a useful reference.
Reference | How much does per-room revenue move with rate, and with day of week?
When you are judging “pricing headroom,” laying out in advance how large a rate change is relative to the day-of-week spread in occupancy makes the discussion faster. The table below takes the two measured values used in this article — estimated settled ADR ¥7,069 (confirmed July 2026, N=95 properties) and estimated OCC (August 2026, based on OTA-listed inventory) — and multiplies them mechanically. The vertical axis runs roughly ±5% around the confirmed ADR; the horizontal axis uses the actual day-of-week range observed here (Sunday 82.3% to Wednesday 94.2%).
| Estimated settled ADR \ estimated OCC | 82.3% Sunday average | 85.0% | 89.6% August average | 92.0% | 94.2% Wednesday average |
|---|---|---|---|---|---|
| ¥6,700 | ¥5,514 | ¥5,695 | ¥6,003 | ¥6,164 | ¥6,311 |
| ¥6,900 | ¥5,679 | ¥5,865 | ¥6,182 | ¥6,348 | ¥6,500 |
| ¥7,069 | ¥5,818 | ¥6,009 | ¥6,334 | ¥6,503 | ¥6,659 |
| ¥7,250 | ¥5,967 | ¥6,162 | ¥6,496 | ¥6,670 | ¥6,830 |
| ¥7,450 | ¥6,131 | ¥6,332 | ¥6,675 | ¥6,854 | ¥7,018 |
Source: compiled by the HotelBank Editorial Team from MetroEngines Research (illustrative calculation)
The values in this table are the product of estimated settled ADR (tax-exclusive equivalent) and estimated OCC (based on OTA-listed inventory), and are defined differently from actual RevPAR. Estimated OCC runs higher than true room occupancy, so the level itself cannot be compared directly against your own results. What to read here is the difference between cells. Taking the current position (¥7,069 × 89.6%) as the base, lifting rate from ¥7,069 to ¥7,250 — 2.6% — adds ¥162 per room, whereas occupancy falling from Wednesday’s 94.2% to Sunday’s 82.3% subtracts ¥841. The day-of-week trough is more than five times larger. For an Okayama business hotel, in other words, the decision to move rate by a few hundred yen and the decision to fill the Sunday trough differ by an order of magnitude in effect. Before working on the “pricing headroom” of Step 2, check whether your own day-of-week trough has the same shape as the prefecture average.
A three-step self-diagnosis: using quartiles to separate pricing headroom from improvement spending
Step 1 | Overlay your own category scores on the prefecture’s p25 / mean / p75. For each of the ten categories, record where you sit: below p25, between p25 and the mean, between the mean and p75, or above p75. For a business hotel, Rooms gives you 3.565 / 3.884 / 4.240 and Bathroom 3.199 / 3.550 / 3.872 as the yardstick. The point is to read your position within the prefecture rather than the absolute level.
Step 2 | Categories above p75 with a narrow band belong in your messaging and your price. Staff (width 0.406) and Breakfast (width 0.365) are categories where properties in the prefecture bunch together, so clearing p75 there (4.333 and 4.065 respectively) means you have broken out of a narrow band. Move them to the front of your plan copy and photo order, and there is room to capture that in price with confidence. Conversely, if you sit around the mean on one of these narrow-band categories, spending more there will barely move your in-prefecture ranking.
Step 3 | Categories near p25 with a wide band move up the improvement queue. Cleanliness (width 0.703), Rooms (0.675) and Bathroom (0.673) are where properties separate within the prefecture, so if you are sitting near p25 there (3.621, 3.565 and 3.199 respectively), improvement translates readily into in-prefecture position. Bathroom in particular has the lowest prefecture mean of any category at 3.550 and is observed across a heavy 11,101 reviews — which also makes it the point guests raise most.
The value of these three steps is that they replace a vague goal — “raise our ratings” — with a decision: which category will actually move our ranking? The same 0.1 means something different inside a wide band than inside a narrow one.
For revenue managers running business and city hotels in Okayama — implications and an action plan
1. The price yardstick is ¥7,069 / ¥10,109 (confirmed July 2026). If your own July result sits below that level, it is not because the market is weak. The business-hotel prefecture average was essentially flat against July last year at −0.3%, and up 2.8% across January–July. Underperformance while the whole market is rising points to something in your own rate setting or product messaging, so start by matching it against where you sit on the review categories.
2. The narrowing city multiple (1.86x → 1.43x) is a signal that the upper price band has to justify itself. Look at what the rating gap is made of: the city advantage is concentrated in Breakfast +0.424 and Meals +0.357, while Staff +0.117, Location +0.139 and Amenities are essentially level. If you are holding an upper price band, there is room to anchor the justification for that gap explicitly in the food experience. Seen from the business-hotel side, service and location are areas where you are effectively level, which is a starting point for arguing for price.
3. A high score in a narrow-band category has to be priced, or it is never recovered. An in-prefecture distribution of Staff 4.079 with a 0.406 band, and Breakfast 3.891 with a 0.365 band, tells you these are read as table stakes. If you are above p75 and your price is merely at the prefecture average, you are failing to convert a rating asset into price.
4. Treat Sunday and Wednesday as separate design problems. Estimated OCC in August 2026 was 94.2% on Wednesdays against 82.3% on Sundays, an 11.9-point gap. Sunday’s reluctance to fill will not necessarily yield to price alone; length-of-stay conditions and arrival-day design are worth considering alongside it. Wednesday and Thursday, meanwhile, are the days where rate is most easily left on the table.
| Horizon | Action | Trigger | Objective |
|---|---|---|---|
| Today–this week | List all ten of your review categories, each positioned against the prefecture’s p25 / mean / p75 (Step 1) | Record it as top priority if Bathroom sits near the prefecture p25 of 3.199, or Cleanliness near 3.621 | Separate the categories for improvement spending from those for pricing action |
| Today–this week | Match your July ADR result against the confirmed prefecture figure | If you were clearly below ¥7,069 as a business hotel, or ¥10,109 as a city hotel | Separate market factors from property factors |
| Within two weeks | Move above-p75 categories to the front of plan copy and photos | If you clear p75 on a narrow-band category — Staff above 4.333, Breakfast above 4.065 | Lay the groundwork to convert a rating asset into price |
| Within two weeks | Review Wednesday and Thursday pricing on their own | If prefecture estimated OCC is thick at 94.2% on Wednesday and 93.2% on Thursday while your own property sells out early on those days | Stop leaving midweek revenue on the table |
| Toward next month | Revisit the conditions attached to Sundays, and to stays that include a Sunday | If the 11.9-point gap against the prefecture’s Sunday 82.3% shows up at your property too | Fill the day-of-week trough by means other than price |
| Toward next month | Build an annual plan that concentrates improvement budget on the wide-band categories — Cleanliness, Rooms, Bathroom | If those categories sit near the prefecture p25 and carry a heavy review count at your property too | Focus investment where in-prefecture position actually moves |
Source: compiled by the HotelBank Editorial Team from MetroEngines Research
In summary — three yardsticks you can use in Okayama
Yardstick 1: band width. Among Okayama business hotels, Cleanliness 0.703, Rooms 0.675 and Bathroom 0.673 are wide, while Breakfast 0.365 and Staff 0.406 are narrow. Wide categories move your ranking when you improve them; narrow ones are where a high score belongs in your price.
Yardstick 2: the prefecture price benchmark. Confirmed estimated settled ADR for July 2026 was ¥7,069 for business hotels (N=95 properties) and ¥10,109 for city hotels (N=17 properties). Across January–July, business hotels were up 2.8% year on year and city hotels down 6.9%, narrowing the multiple between them from 1.86x to 1.43x.
Yardstick 3: the day-of-week trough. Estimated OCC in August 2026 was 94.2% on Wednesdays and 82.3% on Sundays. That 11.9-point gap is the basis for designing a rate calendar that varies by day of week.
Neither ratings nor prices are decision-grade as standalone numbers. Only once they are converted into a relative position within the prefecture’s distribution does the three-way choice — raise it, fix it, leave it alone — become clear.
About the data
■ Data sources
This article uses the OTA-published rate and inventory data we collect on an ongoing basis, together with aggregated guest-review scores. Review benchmarks cover 12–65 business-hotel properties / 451–17,599 reviews and 7–11 city-hotel properties / 169–5,541 reviews in Okayama Prefecture (the property count and review count differ by category, so N (properties / reviews) is shown alongside each figure). Estimated settled ADR covers 92–96 business-hotel properties and 17–18 city-hotel properties. Estimated OCC covers 87–88 business-hotel properties and 10,958 rooms in Okayama Prefecture for August 2026 (the 1st to the 31st), with daily average observation coverage of 94.5%. Data as of September 3, 2026. Sources throughout are MetroEngines Research and research by the HotelBank Editorial Team. Property names and individual property scores are not disclosed.
■ Calculation assumptions
Estimated OCC (occupancy based on OTA-listed inventory) = 100 − 100 × rooms still listed on OTAs ÷ total rooms. Estimated settled ADR is the settled price level (tax-exclusive equivalent) inferred from OTA and other sales data (lowest-plan level × a segment coefficient, ensembled across multiple channels); past months are confirmed values, while the current and future months are estimates based on live sales conditions. Every year-on-year comparison in this article is between confirmed values. Review scores are the per-property averages of guest reviews over the past 24 months, and the mean, median, p25 and p75 are computed from the in-prefecture distribution of those per-property averages. The table under “Reference | How much does per-room revenue move with rate, and with day of week?” is a simple product of estimated settled ADR ¥7,069 (confirmed July 2026, N=95 properties) and estimated OCC (August 2026); its vertical axis runs roughly ±5% around the confirmed value and its horizontal axis uses the actual day-of-week range observed here (Sunday 82.3% to Wednesday 94.2%).
■ Limitations and caveats
Estimated OCC is inferred from how inventory sold on OTAs is absorbed, and is defined differently from actual room occupancy (it comes out higher). The level itself therefore cannot be compared directly against your own results; what to read is the relative difference. How absorption splits from property to property is covered in our piece dividing 38 Yamagata properties into three absorption types. Estimated settled ADR carries a median error of 6.6% against published operating results. The city-hotel sample is limited to around 17 properties, so a change of sales policy at a small number of them moves the overall average easily. Values for thin categories such as Amenities — 12 properties and 451 reviews — also move around, so give priority to categories with heavy review counts when placing your own property. Estimated settled ADR from August onward is computed on a different basis from confirmed values and cannot be compared with them directly. Sales conditions and inventory change daily, so the figures in this article are a snapshot at the time of collection.