

When “going OTA-free” comes up in day-to-day operations, the phrase usually splits into two different things. One is a question of volume — pulling every booking back from online travel agents into the hotel’s own direct channel. The other is a question of cost — cutting the total commission bill. Seen from the inventory data, however, neither of those is what a property can actually move. What can be moved is three things: inventory allocation, the acquisition cost of each channel, and rate parity — and going OTA-free means designing those three. This article combines measured inventory allocation ratios across 12,941 properties nationwide with estimated settled ADR by property type and the Japan Tourism Agency’s reported occupancy rates, to establish where the commission burden sits and how large it is, expressed as a figure per room.
Metric Definitions Used in This Article
- Inventory allocation ratio: the maximum number of bookable rooms simultaneously observable on online sales channels during the observation window ÷ the property’s total room count (%). Calculated on a room basis; plan counts are not used. It is a lower bound on the volume of rooms assigned to online sales channels — the true allocation is at least this large. Because it excludes rooms sold before observation begins (90 days’ lead time), it reads lower than reality on high-demand dates. Figures are quoted from our previously published measurements.
- ADR (average daily rate): an estimated settled rate (tax-exclusive equivalent) derived by applying property-type correction factors to the lowest published plan level each property lists on online sales channels (two guests per room, per-room rate, tax-inclusive). Median error against property-level actuals disclosed by listed hotel REITs is approximately 7%. These are estimates and differ from each property’s actual transacted rates or accounting figures. The property-type ADRs in this article are 12-month averages for August 2025 to July 2026, calculated by weighting the monthly medians of all 47 prefectures by the number of properties covered.
- Reported occupancy rate: room occupancy by property type from the Japan Tourism Agency’s “Overnight Travel Statistics Survey,” 2025 annual figures (final). Not our own estimate.
- Commission rate: this article does not use the terms of any specific contract. Rates are assumptions set as a range based on levels generally presented in publicly available information. They do not assert the terms of any actual contract.
- Data sources: MetroEngines Research / Japan Tourism Agency, “Overnight Travel Statistics Survey”
Key Takeaways
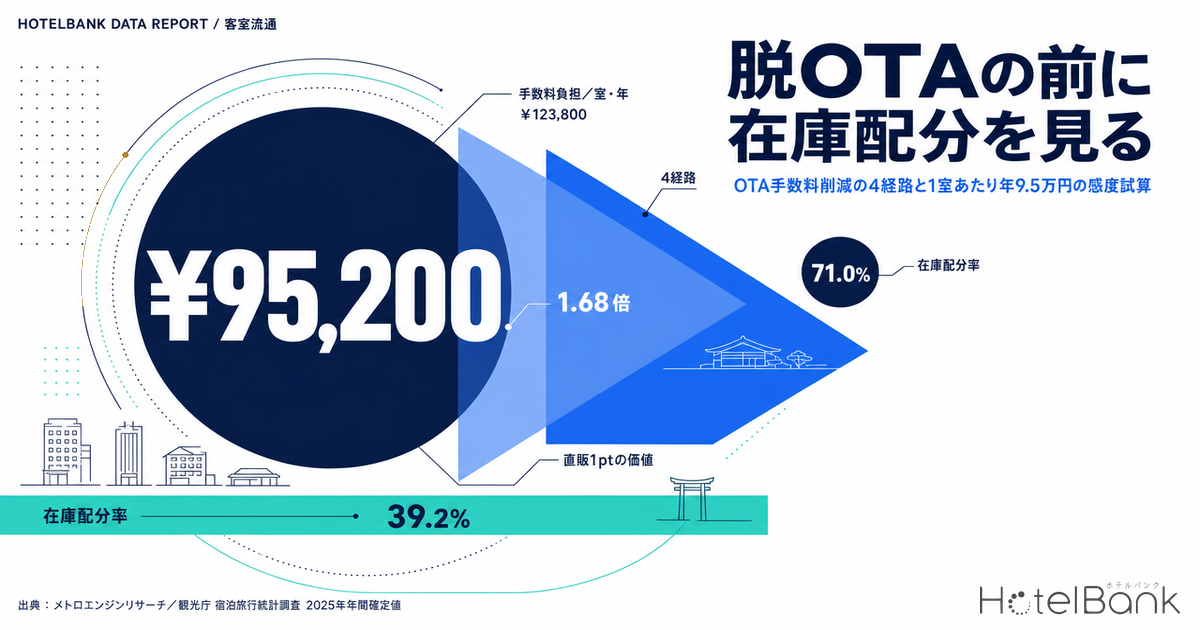
— 39.2% — the median inventory allocation ratio, calculated from inventory observation across 12,941 properties and 1,110,175 total rooms nationwide. Ryokan are highest at 41.7% and city hotels lowest at 23.7%, an 18.0pt spread by property type. This sets the ceiling on how much room there is to move.
— ¥95,200 per room per year — the commission burden generated through online channels for a business hotel, applying a 39.0% allocation ratio and a 10% commission rate to annual revenue per room (estimated settled ADR ¥8,900 × reported occupancy 75.3% (January–December 2025 full year, final) × 365 days = approximately ¥2.44M). By property type, resort hotels are highest at ¥123,800 and ryokan lowest at ¥88,500.
— The value of 1pt of direct share depends on neither allocation ratio nor scale. It is determined by annual revenue per room × 1% × commission rate: ¥2,400 a year for business hotels, ¥3,700 for city hotels. What does vary is the ceiling on how far you can move.
— 1.68x — the ratio between properties of 19 rooms or fewer (allocation ratio 50.0%) and those of 200 rooms or more (29.8%) in the online commission burden carried per room. Small properties may face smaller absolute amounts, but the load per room is heavier.
— 71.0% — the share of matched pairs that differed by not a single yen, from our previously published measurement of 9,030 like-for-like pairs. Price gaps are the result of design rather than chance, and rate parity — the official site not being disadvantaged on identical terms — is a precondition for growing direct bookings.
Going OTA-free is not about volume — start by checking your own allocation ratio
The starting point for the discussion is a simple fact: what share of your rooms are currently placed in online sales channels? Without knowing that, saying “commissions are too high” gives no view of the ceiling on what can be cut.
Our previously published Median 39.2% of Rooms Online — Allocation Across 12,941 Hotels calculates the inventory allocation ratio from room-based inventory observation across 12,941 properties and 1,110,175 total rooms nationwide. The median is 39.2%. The distribution is not concentrated at any single point: 11.8% of properties fall in the 0–10% band, and 7.7% fall in the 90–100% band. There is no allocation ratio that can be called an industry standard.
Cut by property type, ryokan are highest at 41.7% (N=5,126) and city hotels lowest at 23.7% (N=546). Overlay the reported occupancy rates from the Japan Tourism Agency’s “Overnight Travel Statistics Survey” 2025 annual final figures, and the structure becomes clear. City hotels build reported occupancy of 74.1% (January–December 2025 full year, final) largely outside a public allocation that accounts for less than a quarter of their total rooms. This is a property type that already holds thick channels of its own — room nights tied to banquets and weddings, corporate contracts, MICE, and blocks held by travel agencies. Ryokan are the mirror image: reported occupancy of 38.2% (January–December 2025 full year, final) is the lowest of any type, yet their allocation ratio is the highest, a design that entrusts a heavy share of inventory to online sales channels.
In other words, the segment that already has a thick direct side and the segment that leans on online channels divide cleanly by property type, and the same prescription does not fit both. For the former, the task is maintaining and extending existing channels; for the latter, it is adding channels. It bears repeating that the inventory allocation ratio is a proxy for a lower bound, and the figure does not translate directly into “share of revenue booked online.” What it shows is the allocation of room counts, not a measurement of revenue mix.
Source: MetroEngines Research / Japan Tourism Agency, “Overnight Travel Statistics Survey” 2025 annual figures (final), compiled by the HotelBank Editorial Team
Inventory allocation ratio, reported occupancy, and annual commission burden per room by property type (assuming a 10% commission rate)
| Property type | Estimated settled ADR |
Reported occupancy 2025 final |
Annual revenue per room |
Allocation ratio median |
Commission burden per room / year |
Value of 1pt direct |
|---|---|---|---|---|---|---|
| Resort hotels | ¥16,900 | 56.9% | ¥3.51M | 35.3% | ¥123,800 | ¥3,500 |
| Business hotels | ¥8,900 | 75.3% | ¥2.44M | 39.0% | ¥95,200 | ¥2,400 |
| City hotels | ¥13,800 | 74.1% | ¥3.74M | 23.7% | ¥88,600 | ¥3,700 |
| Ryokan | ¥15,200 | 38.2% | ¥2.12M | 41.7% | ¥88,500 | ¥2,100 |
Estimated settled ADR is based on N = 7,368 business / 1,096 city / 1,550 resort / 6,684 ryokan properties (47 prefectures, 12-month average August 2025 to July 2026, weighted by property count). Inventory allocation ratio is based on N = 6,182 business / 546 city / 1,049 resort / 5,126 ryokan properties.
Source: MetroEngines Research / Japan Tourism Agency, “Overnight Travel Statistics Survey” 2025 annual figures (final), compiled by the HotelBank Editorial Team
The two right-hand columns are the heart of this article. Multiply annual revenue per room by that property type’s allocation ratio and a 10% commission rate, and you get an indicative figure for the commission arising through online channels. The largest is ¥123,800 per room per year for resort hotels, where the burden concentrates in a type that is high on both rate and allocation. City hotels are the reverse: despite a high rate, they stop at ¥88,600. An allocation ratio of 23.7% translates directly into a lighter burden.
The far-right column deserves attention. The amount freed up by moving direct share by 1pt depends on neither the allocation ratio nor property scale. It is a pure function of rate, determined by annual revenue per room × 1% × commission rate. City hotels’ ¥3,700 exceeds business hotels’ ¥2,400 not because their allocation ratio is lower, but because their rate and occupancy are higher. Where the allocation ratio matters is the ceiling — how many times that 1pt can be stacked — and conflating the two makes the discussion talk past itself.
Four routes to cutting OTA commissions — acquisition cost never falls to zero
The ways to reduce commissions sort into four broad routes. What matters is that every route carries its own acquisition cost, and moving volume to direct does not make that cost disappear. Commission on bookings through online travel agents is a performance-linked and therefore legible cost, but direct carries the monthly fee for a booking engine, the funding behind a membership programme, advertising spend, and above all labour. The comparison to make is not “commission versus free” but “acquisition cost per booking, route by route.”
Four routes to cutting OTA commissions — upfront cost, operating load, and where each works best
| Route | What it involves | Upfront cost | Operating load | Property types and conditions where it works |
|---|---|---|---|---|
| 1. Direct booking on the official site (membership, rate parity) | Deploying a booking engine, designing a membership programme and repeat-visit paths, and writing down explicit rate parity rules for identical terms | Medium Setup fee plus fixed monthly cost | High Inventory and rate synchronisation, plus ongoing membership operations | Ryokan and resorts with high repeat rates. Locally rooted business hotels with a fixed catchment |
| 2. Negotiated sales to corporate accounts, travel agencies and groups | Annual rate agreements, securing group blocks, MICE bids, and continuing business with travel agencies | Low to medium Mainly sales labour | High Relationships take years, and renewal negotiations recur annually | City and business hotels with corporate demand. The 100-rooms-and-above band that can support a sales team |
| 3. Metasearch and hotel ad integration (cost per click) | Listing official rates on comparison surfaces and buying traffic on a cost-per-click basis rather than a performance-linked one | Low Campaign setup only | Medium Continuous bid and budget tuning; unit cost fluctuates | Resorts and city hotels with high rates and large gross margin per booking. Properties with longer stays |
| 4. Designing inventory allocation and rate parity | Varying the allocation by demand date, and maintaining a state in which the official site is not disadvantaged on identical terms | Near zero A change to existing operations | Medium Requires demand forecasting and allocation rules | All property types, and especially properties whose allocation ratio exceeds the third quartile for their type |
Source: MetroEngines Research, compiled by the HotelBank Editorial Team
Of the four routes, 1, 2 and 3 are measures that reacquire demand itself through a different entrance. They require capital and time, and the run-up before results appear is long. Route 4, by contrast, only changes how inventory and rates are positioned, so it carries almost no upfront cost. As our published inventory allocation study shows, the range for business hotels is wide — a first quartile of 16.7% and a third quartile of 70.0% — and if your property sits above the third quartile within that distribution, it is worth examining whether the demand generated by a thick public allocation is in balance with the commission burden it creates. Starting with route 4 and investing in 1, 2 and 3 while measuring its effect is the realistic order for properties with limited resources.
Route 4 also has a second angle: varying the allocation itself by demand date. Our published study found that when a Saturday in a long weekend was compared with an ordinary weekday across the same set of properties, the weekday allocation ratio came out 10.7pt higher for business hotels. The stronger the demand, the faster the public allocation clears. Holding a thicker allocation for direct and repeat guests on strong dates while widening the public allocation on weak ones is territory that many properties have yet to touch.
Sensitivity model — how the burden shifts as commission rate and direct share move
■ Model assumptions
- Rate: estimated settled ADR (tax-exclusive equivalent). Business hotels ¥8,900, city hotels ¥13,800, resort hotels ¥16,900, ryokan ¥15,200 (all shown rounded to the nearest ¥100; the model uses the unrounded values). A 12-month average for August 2025 to July 2026, weighting the monthly medians of all 47 prefectures by the number of properties covered.
- Occupancy: room occupancy by property type from the Japan Tourism Agency’s “Overnight Travel Statistics Survey,” 2025 annual figures (final). Business 75.3%, city 74.1%, resort 56.9%, ryokan 38.2%.
- Annual revenue per room = ADR × occupancy × 365 days. Rooms revenue only; food and beverage, banqueting and other departments are excluded.
- Online share: the share of rooms revenue arising through online travel agents. Treated as a variable separate from the inventory allocation ratio (the allocation ratio is an assignment of room counts, not a revenue mix). The model varies it from 15% to 40% in 5pt steps.
- Commission rate: four levels — 8%, 10%, 12% and 15%. These are assumptions set as a range based on levels generally presented in publicly available information, and do not indicate the terms of any actual contract. The effective figure moves up or down depending on whether attendant costs such as loyalty-point funding are included.
- Not included in this model: acquisition costs on the direct side (booking engine fees, advertising, membership funding, labour), payment processing fees, and differences in cancellation rates. The figures shown are therefore the total commission arising through online travel agents, not an amount that becomes profit simply by moving volume to direct.
Start with a single business hotel room, and lay out the annual commission burden across two axes: online share and commission rate. Annual revenue per room is approximately ¥2.44M. The structure of that calculation — ADR × occupancy × 365 days — is broken down by property type in What Is RevPAR? ADR × Occupancy, and this article layers allocation ratio and commission rate on top of that per-room revenue.
Source: MetroEngines Research / Japan Tourism Agency, “Overnight Travel Statistics Survey” 2025 annual figures (final), compiled by the HotelBank Editorial Team
Business hotels: annual commission burden per room (¥) — online share × commission rate
| Commission rate | 40% | 35% | 30% | 25% | 20% | 15% | Saved per 5pt improvement |
|---|---|---|---|---|---|---|---|
| 8% | 78,118 | 68,353 | 58,588 | 48,823 | 39,059 | 29,294 | 9,765 |
| 10% | 97,647 | 85,441 | 73,235 | 61,029 | 48,823 | 36,618 | 12,206 |
| 12% | 117,176 | 102,529 | 87,882 | 73,235 | 58,588 | 43,941 | 14,647 |
| 15% | 146,470 | 128,162 | 109,853 | 91,544 | 73,235 | 54,926 | 18,309 |
Modelled figures based on annual revenue per room of ¥2.44M (estimated settled ADR of approximately ¥8,900 × reported occupancy 75.3% (January–December 2025 full year, final) × 365 days). The commission rate is an assumption, not the terms of any actual contract.
Source: MetroEngines Research / Japan Tourism Agency, “Overnight Travel Statistics Survey” 2025 annual figures (final), compiled by the HotelBank Editorial Team
There are two ways to read it. The first is to read across: the far-right column shows how much is freed up per room per year by improving direct share by 5pt. Assuming a 10% commission rate, that is ¥12,200 a year; at 15%, ¥18,300. For 100 rooms, that is ¥1.22M a year in the first case and ¥1.83M in the second. Whether that amount balances against the annual cost of a booking engine and the funding behind membership initiatives is the starting point for the investment decision on route 1.
The second is to read down. At the same 30% online share, the burden is ¥58,600 at an 8% commission rate and ¥109,900 at 15% — a 1.88x spread. For properties with a high share of bookings from overseas-based booking sites, revisiting which channels are used and how heavily may pay off sooner than moving direct share. Shifting weight toward lower-rate channels is a smaller operational change than moving the ratio itself.
Note that the figures in this table are the total commission arising through online travel agents, not an amount that becomes profit simply by moving volume to direct. Route 1 carries booking engine fees and membership funding; the cost-per-click route 3 carries advertising spend. If ¥12,200 is freed up by moving 5pt, but more than ¥12,200 is spent reacquiring those 5pt, nothing is left over. Comparing the commission rate and the acquisition cost on the direct side on the same footing is what this model is properly for.
A 1.68x gap by scale — small properties carry a heavier load per room
Our published inventory allocation study confirms a stable relationship between room count and allocation ratio. Properties of 19 rooms or fewer have a median of 50.0% (N=3,597); those of 200 rooms or more, 29.8% (N=1,416). The larger the property, the lower the share placed in public allocation. Large properties more readily hold their own sales organisation, corporate contracts and annual business with travel agencies, which leaves them more room to distribute inventory elsewhere.
Multiply those allocation ratios by the business hotel figure of ¥2.44M in annual revenue per room and a 10% commission rate, and the annual commission burden per room by scale band emerges.
Source: MetroEngines Research / Japan Tourism Agency, “Overnight Travel Statistics Survey” 2025 annual figures (final), compiled by the HotelBank Editorial Team
Properties of 19 rooms or fewer come to ¥122,100 per room per year, against ¥72,700 for those of 200 rooms or more — a ratio of 1.68x. The 100–199 room band, at ¥91,100, exceeds the 50–99 room band’s ¥82,500, so the curve is not a clean downward slope — a point our published study also noted — but the gap between the two ends is unmistakable.
One misreading is worth heading off. In absolute terms, large properties carry far more. Modelled at 200 rooms, the annual figure is ¥14.55M; at 19 rooms, ¥2.32M. The total burden scales with size. That the per-room figure is nonetheless heavier at the small end comes down to the allocation ratio itself being higher. Measured per room as a unit of resource, small properties generate a larger share of the same revenue through online travel agents.
And as established in the previous section, the value of 1pt of direct share does not itself depend on scale. What scale changes is how much room there is to move. Between properties of 19 rooms or fewer at 50.0% and those of 200 rooms or more at 29.8%, the theoretical range differs by 20.2pt. The proposition that “direct improvement works best at small properties with high allocation ratios” holds not in the sense that each point delivers more, but in the sense that there is more room to move and the load currently carried per room is heavier. Building a plan while leaving that distinction vague leads to overestimating the expected value.
That said, there are practical reasons small properties choose a high allocation ratio. Constrained sales resources leave little room to develop corporate contracts or group business in-house. Reducing the public allocation must not become an end in itself. Cutting commissions while losing occupancy achieves nothing. The aim is to diversify the channel mix while holding occupancy steady. At a 19-room scale, simply tidying up the booking path for repeat guests can move part of the allocation. Relatedly, as shown in 76.8% of Japan’s 27,248 Hotels Are Independent — 42.5% by Rooms, independents account for the large majority of the market on a property-count basis. That most properties cannot presume access to a chain headquarters’ distribution network is a structural premise worth holding on to here.
Rate parity is the precondition — make sure the official site is not disadvantaged on identical terms
Any design for growing direct bookings has a precondition: rate parity. If a state persists in which the official site is more expensive on like-for-like terms, the money spent on route 1 will not be recovered.
On this point, the measurements in our published OTA Price Gaps: 71% Identical Across 9,030 Matched Pairs (2026) are instructive. Of 9,030 pairs (4,710 properties) matched across two channels with property, stay date and booking conditions all held identical, 71.0% did not differ by a single yen. A gap appeared in 29.0%, with a median of approximately ¥1,000 (6.9% against the cheaper side). Across most of the market, prices are aligned.
More important is the nature of the gaps. Among the 363 properties where a gap was observed, 93.1% had the same channel cheaper on every stay date. Price gaps are therefore not day-to-day noise but the result of design. Whether deliberately, or as the residue of settings left untouched, a particular channel ends up structurally cheaper. The same can happen between the official site and booking sites.
The practical implication is plain. Before any initiative to move direct share, inspect how rates line up on identical terms. Hold the conditions constant — room-only, same room type, same cancellation policy — and check whether the official site is at a disadvantage. Designing member rates and perks under route 1 can wait until that alignment is in place. Spend on advertising while parity is broken and guests will compare, and the booking will land on the channel carrying the commission after all.
Note also that parity clauses in booking-site contracts for the accommodation sector have been raised repeatedly by the Japan Fair Trade Commission as an issue under the Antimonopoly Act. Because contract terms differ property by property, any actual change in operations should proceed only after confirming your own contract.
Conclusion — reducing it to three design variables
The conclusions of this article come down to three points.
First, going OTA-free is an argument about allocation, not about volume. Across 12,941 properties nationwide, the median inventory allocation ratio is 39.2%, with an 18.0pt spread from ryokan at 41.7% to city hotels at 23.7%. Where your property sits within that distribution sets the ceiling on how much there is to move. If you are above the third quartile, there is room to examine whether the demand your public allocation generates balances against the commission burden. If you are near the first quartile, you are already a property with thick alternative channels, and the task is maintaining and extending them.
Second, the value of 1pt of direct share and the room available to move are different quantities. The amount freed up per point is annual revenue per room × 1% × commission rate — ¥2,400 for business hotels, ¥3,700 for city hotels — and depends on neither allocation ratio nor scale. Meanwhile, properties of 19 rooms or fewer (allocation ratio 50.0%) and those of 200 rooms or more (29.8%) differ by 20.2pt in the range available, and the current per-room burden differs 1.68x, at ¥122,100 against ¥72,700. Small properties with high allocation ratios have more room to work with on direct improvement, and carry a heavier load per room today. The effect per point is not larger; the room to move is wider.
Third, what should be compared is the commission rate against the acquisition cost on the direct side. Commission is made visible by being performance-linked, but direct carries booking engine fees, advertising, membership funding and labour. The figure of ¥73,200 per room per year, assuming a 30% online share and a 10% commission rate, is not an amount that becomes profit simply by moving volume to direct. Move 5pt and free up ¥12,200 a year, and if the cost of reacquiring those 5pt exceeds it, nothing is left over. Of the four routes, the only one with near-zero upfront cost is route 4, inventory allocation and rate parity, and starting there and investing in routes 1, 2 and 3 while measuring the effect is the realistic order for most properties.
The inventory allocation ratio is one of the few structural variables a property sets for itself. Where analysis of sell-out timing speaks to how demand was handled, the allocation ratio speaks to where you decided to sell in the first place. The former is a variable moved through daily operations; the latter belongs to management design on an annual horizon. Treating commission reduction as a question of the latter gives it a far longer reach.
⚠ On the treatment of modelled figures: every commission burden figure in this article is a modelled value calculated from estimated settled ADR, the Japan Tourism Agency’s reported occupancy rates, and assumed commission rates and online shares. Estimated settled ADR is an estimate with a median error of approximately 7% against property-level actuals disclosed by listed hotel REITs, and differs from each property’s actual transacted rates or accounting figures. Commission rates are set as a range based on levels generally presented in publicly available information, and do not indicate the terms of any actual contract. The inventory allocation ratio is a lower bound on the rooms assigned to online sales channels, not a measurement of the share of revenue booked online. When applying this to a decision at your own property, recalculate using your actual contracted rates, revenue mix by channel, and acquisition costs on the direct side.
Related reading
- Median 39.2% of Rooms Online — Allocation Across 12,941 Hotels
- OTA Price Gaps: 71% Identical Across 9,030 Matched Pairs (2026)
- 76.8% of Japan’s 27,248 Hotels Are Independent — 42.5% by Rooms
- What Is RevPAR? ADR × Occupancy, and Why GOP Splits 1.81x in 2026
- What Is Hotel ADR? Settled Rates 34–57% of Listed Prices, 2026
- JTA 2025 Final OCC 61.6%: 0.2pt Revision from 61.8% by Property Type
References and Sources
■ Data sources
This article combines MetroEngines Research room-based inventory observation (12,941 properties analysed, 1,110,175 total rooms, observed within a 90-day lead time) and estimated settled ADR by prefecture and property type (47 prefectures, 12-month average of finalised months from August 2025 to July 2026, weighted by property count) with room occupancy by property type from the Japan Tourism Agency’s “Overnight Travel Statistics Survey” for the January–December 2025 full year (final). Commission rates are assumptions set as a range based on levels generally presented in publicly available information.
■ Model assumptions
The rate, occupancy, online share and commission rate levels used in the model are stated under “Model assumptions” in the body text. Annual revenue per room = estimated settled ADR × room occupancy × 365 days, covering rooms revenue only (food and beverage, banqueting and other departments are excluded).
■ Limitations and caveats
Every commission burden figure in this article is a modelled value. Estimated settled ADR is an estimate with a median error of approximately 7% against property-level actuals disclosed by listed hotel REITs, and differs from each property’s actual transacted rates or accounting figures. The inventory allocation ratio is a lower bound on the volume of rooms assigned to online sales channels, not a measurement of the share of revenue booked online. Commission rates and online shares are assumptions and do not indicate the terms of any actual contract. The model also excludes acquisition costs on the direct side (booking engine fees, advertising, membership funding, labour), payment processing fees, and differences in cancellation rates. When applying this to a decision at your own property, recalculate using your actual contracted rates, revenue mix by channel, and acquisition costs on the direct side.
■ Market data
- MetroEngines Research — estimated settled ADR by prefecture and property type (47 prefectures, 12-month average of finalised months from August 2025 to July 2026, N = 7,368 business hotels / 1,096 city hotels / 1,550 resort hotels / 6,684 ryokan)
- MetroEngines Research — room-based inventory allocation ratio for accommodation properties in Japan (12,941 properties analysed, 1,110,175 total rooms, observed within a 90-day lead time). Quoted from our published article “Median 39.2% of Rooms Online”
- MetroEngines Research — like-for-like listed price matching (9,030 pairs / 4,710 properties). Quoted from our published article “OTA Price Gaps: 71% Identical Across 9,030 Matched Pairs”
■ Government statistics and public documents
- Japan Tourism Agency, “Overnight Travel Statistics Survey” — room occupancy by property type, 2025 annual figures (final). Overall 61.6%, business hotels 75.3%, city hotels 74.1%, resort hotels 56.9%, ryokan 38.2%
- Japan Tourism Agency, press release on the “Overnight Travel Statistics Survey (2025 annual figures)”
- Japan Fair Trade Commission, “Fact-Finding Survey Reports” — issues concerning parity clauses in the accommodation sector
- Japan Fair Trade Commission, “Fact-Finding Survey on the Trade Practices of Digital Platform Operators”
■ Publicly available information used for the commission rate assumptions
- Relo Hotel Solutions, “Comparison of accommodation booking site commissions (2026 edition)” — general commission levels for domestic and overseas-based sites
- Connector Japan, “Booking site commission list” — breakdown of referral commissions and attendant costs such as loyalty-point funding
- Yadoken, “Comparing commissions and characteristics of domestic and overseas accommodation booking sites (updated January 2026)”
* Commission rates are assumptions based on the general ranges presented in the publicly available information above, and do not indicate the actual contract terms of any specific operator. This article does not name individual booking sites.