

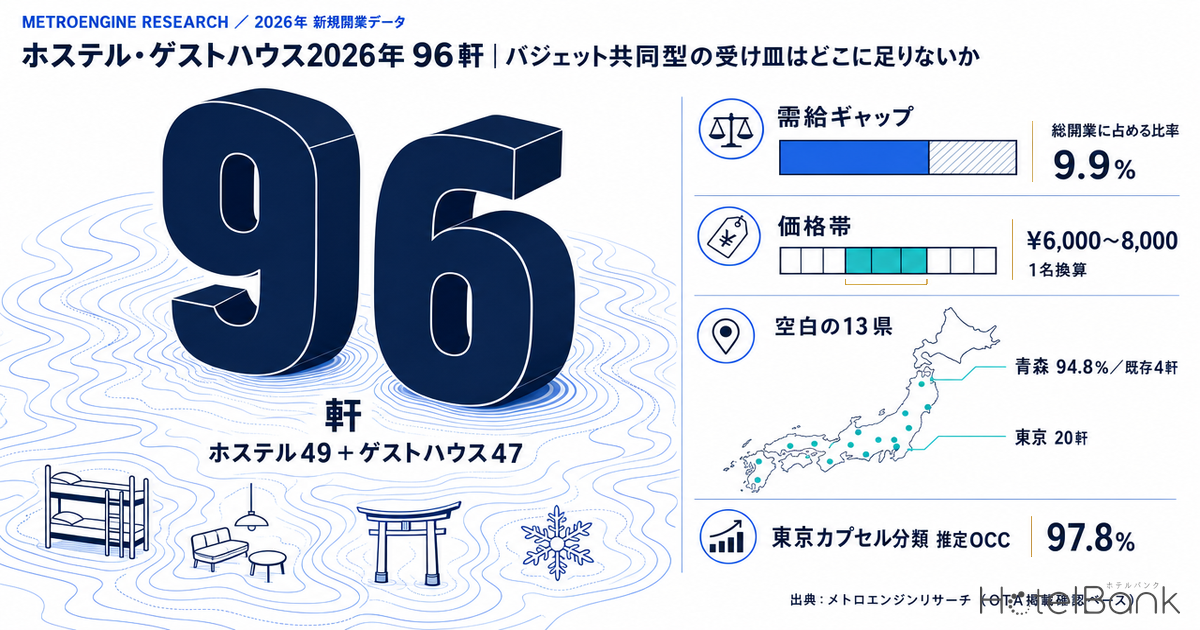
Within the scope tracked by MetroEngines Research (based on major OTA listings and publicly available information), 972 lodging facilities were confirmed to have opened in Japan in 2026. Of these, 49 hostels and 47 guesthouses — 96 properties in the “budget shared” segment — make up roughly one tenth of the total. Yet supply and demand in this price band are tighter than in any other category in Japan’s major cities. This article aggregates where these 96 properties opened, at what scale, and in what price range, then cross-references the supply picture with official demand statistics to identify the places where capacity is missing.
Metric Definitions Used in This Article
- ADR (average daily rate): An estimated transacted rate (tax-exclusive equivalent), calculated by applying category-specific adjustment coefficients to the lowest publicly listed plan rate each property shows on OTAs (double occupancy, per-room rate, tax included). Cross-checked against property-level actuals disclosed by listed hotel REITs (91 properties, most recent three months), the median error is approximately 7%. These are estimates and differ from each property’s actual transacted prices and accounting figures. Area-level ADR is the median across the target properties (the level of a typical property in that area).
- Listed price: The selling price published on OTAs as-is. Per-room rate for double occupancy (tax included). Whether a figure is an “all-plan average” or a “lowest plan” is specified each time.
- OCC (occupancy rate): The share of sold rooms against total rooms within an area (an estimate based on OTA sales inventory). Used only as an aggregate at the prefecture and municipality level.
- Budget shared accommodation: In this article, low-price lodging formats premised on dormitories and shared lounges/bathrooms; hostels and guesthouses as classified in the facility taxonomy are the aggregation target. The capsule hotel category is used alongside them as a proxy indicator of supply-demand conditions.
- Data sources: MetroEngines Research (based on confirmed OTA listings) / Japan Tourism Agency, “Overnight Travel Statistics Survey” / Japan National Tourism Organization (JNTO)
- — 96 properties (9.9%) — Of the 972 openings confirmed in 2026, the budget shared segment accounts for 49 hostels and 47 guesthouses. Its share of total openings has fallen for three consecutive years: 15.6% → 13.9% → 12.5% → 9.9%.
- — 11.2 rooms on average, median 5.5 — The 96 properties total 1,072 rooms. Half of them — 48 properties — have five rooms or fewer, making this predominantly a micro-scale operating segment.
- — Estimated OCC of 95–99% — The capsule category, used here as a supply-demand proxy, posted the highest figure of any category in major cities in June 2026, running 3 to 16 points above the business hotel category in the same prefecture.
- — ¥6,000–8,000 per person is the modal band — The lowest plans at the 96 new properties (N=87) sit between the capsule band (¥3,000–5,000) and single occupancy at a business hotel.
- — 13 prefectures form the gap — Estimated OCC of 88% or higher with 25 or fewer existing shared-accommodation properties. They cluster across northern Tohoku and northern Kanto — Aomori, Akita, Miyagi, Ibaraki, Saitama — and seven of them recorded zero openings in this segment in 2026.
96 shared-accommodation openings in 2026 — property counts have thinned for three straight years, and the share has now fallen below 10%
Start with the overall picture. Of the 972 openings confirmed in 2026, vacation rentals dominate at 444 properties, followed by business hotels at 126 and unclassified properties at 83. Hostels (49) and guesthouses (47) form the next tier, and their combined 96 properties are the subject of this article. Against an average of 31 rooms across all 972 properties, the 96 shared-accommodation properties average 11.2 rooms with a median of 5.5 — skewed to the extreme small end.
Viewed over time, new openings in this segment continue to contract: 312 properties in 2023 (107 hostels + 205 guesthouses), 273 in 2024 (93 + 180), 211 in 2025 (96 + 115), and 96 so far in 2026 (49 + 47). Their share of total annual openings has also declined for three consecutive years, from 15.6% to 13.9% to 12.5% to 9.9%. The “renewed expansion of shared accommodation” that gets discussed as a theme is not, at least on a new-supply property count basis, actually happening.
Source: MetroEngines Research & Consulting (based on confirmed OTA listings; 2026 observation still in progress)
How to read this data (important): Opening data are observations anchored to the point at which an OTA listing could be confirmed. Some listings appear several months before opening, others only some time after, so recent months and the latter half of the current year are structurally undercounted. Indeed, the 2026 monthly breakdown falls sharply from 12 properties in January, 17 in February and 33 in March to 6 in June and 2 in July — not because supply disappeared, but because observation has yet to catch up. The figure of 96 properties for 2026 will rise as further listings are added. Year-on-year comparisons should be read as comparisons between lower bounds measured on the same observational basis.
That said, the decline in the share itself is hard to explain by observation lag alone. Shared-accommodation properties are mostly small, and they tend to have shorter OTA listing lead times than large hotels — which means the current year loses proportionally more to undercounting. Even so, restricting the view to 2023 through 2025, three years in which observation has fully settled, the trend is consistently downward: 312 → 273 → 211. The direction — that this is not a segment in expansion — does not change.
Where the 96 properties landed — 20 concentrated in Tokyo, spread across only 29 prefectures
The 96 properties are located across 29 prefectures. Tokyo leads with 20 (17 hostels + 3 guesthouses), or 21% of the total, followed by Hokkaido with 9, Okinawa with 6, Hiroshima with 6, Kyoto with 5 and Fukuoka with 5. The top six prefectures alone account for 51 properties, or 53% of the total. Put the other way round, 18 prefectures saw no shared-accommodation openings observed at all in 2026.
Source: MetroEngines Research & Consulting (based on confirmed OTA listings, N=96 properties)
The scale picture is more extreme still. The 96 properties total 1,072 rooms, averaging 11.2 rooms each. By band, 48 properties (50%) have 1–5 rooms, 19 have 6–10, 13 have 11–20, 12 have 21–50, and just 4 have 51 or more. Because shared accommodation includes dormitories, room count does not translate directly into guest capacity — but as a business scale, the picture is one in which half of all properties are micro operations of five rooms or fewer. Measured by total room count, the concentration at the top is even stronger than by property count: Tokyo 379 rooms, Hokkaido 177, Okinawa 96, Osaka 85, Fukuoka 74.
Source: MetroEngines Research & Consulting (based on confirmed OTA listings, N=96 properties)
A note on classification: The hostel and guesthouse categories include not only dormitory-style properties with shared facilities but also small apartment-style and residence-style properties. A considerable share of recent openings is thought to involve conversions or rebrands of existing buildings, and the opening type (new build / conversion / rebrand) cannot be determined uniformly from public information alone. This article names no individual properties and deals only with trends in the aggregate.
The budget band is the tightest of any category — estimated OCC in the capsule segment runs 95–99%
Supply is thinning; what about demand? Taking June 2026 check-in dates, we aggregated estimated OCC by prefecture and category. In Tokyo, all facilities combined came to 94.2% (1,336 properties, 181,869 rooms), against 93.7% for business hotels (861 properties) and 92.9% for city hotels (100 properties) — while the capsule hotel category reached 97.8% (26 properties, 3,909 rooms), the highest of any category.
The same pattern holds across major cities: Osaka 98.5%, Fukuoka 98.3%, Hiroshima 98.9%, Aichi 97.9%, Hokkaido 97.2%, Kyoto 95.3%, Okinawa 96.0%. Each runs 3 to 16 points above the business hotel band in the same prefecture. Capsules absorb the same “low per-person rate, shared-facility” demand as the shared-accommodation segment, which indicates that inventory in this band is the first to sell out.
Source: MetroEngines Research & Consulting (June 2026 check-in dates, estimated OCC)
Note: The capsule category comprises few properties (Tokyo 26, Osaka 5, Kyoto 3, Hokkaido 3, Okinawa 2, Fukuoka 5, Hiroshima 2, Aichi 3), so prefecture-level figures are readily swayed by movements at a small number of properties. Read them as a contrast against the business hotel category (Tokyo 861 properties, and so on).
The relationship with official statistics is worth clarifying. According to the Japan Tourism Agency’s “Overnight Travel Statistics Survey” for May 2026 (first preliminary figures), the room occupancy rate for simple lodgings (kan’i shukusho) was 28.9% (down 0.8 points year on year), far below business hotels at 74.1% and city hotels at 72.6%. Taken at face value, that looks like the opposite of the estimated OCC presented here — but the difference lies in the population being measured. Simple lodgings include many properties with very limited operations, and many that place no inventory on OTAs at all. The estimated OCC used here, by contrast, measures how fast inventory actually offered for sale on OTAs is being consumed. The sound reading is not “this format has low occupancy” but “inventory at the properties that are selling clears quickly, while a large number of properties that are not selling sit in the denominator.” The growth headroom in the low-price band is also examined in our analysis of the simple-lodging category, where the format’s 29.6% share of confirmed 2025 figures is set against its supply structure.
The price band the 96 new properties entered — lowest plans cluster at ¥6,000–8,000 per person
Of the 96 properties, 87 had a selling price confirmable on OTAs for July 2026 check-ins. For these 87, the listed price of the lowest plan (double occupancy, per room, tax included) had a median of ¥15,100, a first quartile of ¥11,600 and a third quartile of ¥27,100. Converted mechanically to a per-person basis, the median works out to about ¥7,500. The distribution is heaviest in the ¥6,000–8,000 band with 21 properties, followed by ¥4,000–6,000 with 17, ¥10,000–15,000 with 18 and ¥15,000 and above with 16 — a polarisation between the low band and the mid band.
Source: MetroEngines Research & Consulting (July 2026 check-ins, N=87 of 96 properties)
Compare this with the existing budget band. Estimated ADR for the capsule category in June 2026 was ¥5,100 in Tokyo (N=39 properties), ¥5,200 in Hokkaido (N=4), ¥4,800 in Fukuoka (N=6), ¥4,200 in Kyoto (N=5), ¥4,100 in Aichi (N=4), ¥3,800 in Osaka (N=10), ¥3,500 in Okinawa (N=3) and ¥2,800 in Hiroshima (N=3). For the same month, the business hotel category came to ¥11,900 in Tokyo (N=915), ¥10,000 in Fukuoka (N=340), ¥9,600 in Kyoto (N=324), ¥9,500 in Hokkaido (N=429) and ¥7,900 in Osaka (N=495).
In other words, the ¥6,000–8,000 per-person range the 96 new shared-accommodation properties occupy is the middle ground above the capsule band (¥3,000–5,000) and below single occupancy at a business hotel (¥8,000–12,000 per room). This is not positioning as “the cheapest option available” but as “cheaper than a private business hotel room, more liveable than a capsule.” The upper-quartile group above ¥27,100 appears designed to capture rate through private and suite-type rooms while retaining shared facilities — a clear strategic split within the same classification.
| Prefecture | Capsule category estimated ADR |
Properties | Capsule category estimated OCC |
Business category estimated ADR |
Properties | 2026 shared openings |
|---|---|---|---|---|---|---|
| Tokyo | ¥5,100 | 39 | 97.8% | ¥11,900 | 915 | 20 |
| Osaka | ¥3,800 | 10 | 98.5% | ¥7,900 | 495 | 3 |
| Kyoto | ¥4,200 | 5 | 95.3% | ¥9,600 | 324 | 5 |
| Hokkaido | ¥5,200 | 4 | 97.2% | ¥9,500 | 429 | 9 |
| Fukuoka | ¥4,800 | 6 | 98.3% | ¥10,000 | 340 | 5 |
| Okinawa | ¥3,500 | 3 | 96.0% | ¥11,200* | 179 | 6 |
| Hiroshima | ¥2,800 | 3 | 98.9% | — | 162 | 6 |
Estimated ADR and OCC are both for June 2026. *The Okinawa business category figure is an average on a listed-price basis. Source: MetroEngines Research & Consulting
The demand side — totals are down year on year, yet FIT-heavy markets set June records
Check the demand environment against official statistics. The Japan Tourism Agency’s “Overnight Travel Statistics Survey” for May 2026 (first preliminary figures) records 53.39 million person-nights (down 4.8% year on year), of which 39.57 million were Japanese (down 1.4%) and 13.82 million were foreign (down 13.4%). The overall room occupancy rate was 60.6% (down 1.1 points). On the numbers alone, this is a decelerating phase.
The breakdown, however, changes the assessment. According to Japan National Tourism Organization (JNTO) estimates, inbound visitors in June 2026 numbered approximately 3.15 million, down 6.8% year on year — a third consecutive month of decline. The main drag was the Chinese market, which fell to 340,700 visitors, down 57.3% year on year, or less than half. Meanwhile, South Korea at 787,100 (+7.8%), Taiwan at 670,400 (+14.6%), Hong Kong at 214,300 (+28.5%) and the United States at 354,500 (+2.7%) all grew, and 15 markets set record highs for the month of June. The first-half cumulative total was 21.08 million (down 2.0% year on year).
This is the point that matters for shared accommodation. What is shrinking are the markets with a relatively high share of group travel; what is growing are the markets centred on free independent travel (FIT). Shared accommodation, built around dormitories and shared lounges, functions as capacity for small parties, solo travellers and long-stay guests rather than for large groups. Hong Kong’s resurgence and the regional orientation of Korean and Taiwanese travellers are the clearest cases of this shift. Reading the year-on-year fall in the headline total straight through as “budget demand is contracting” gets the direction wrong.
Where capacity could grow — 13 prefectures with tight supply-demand and almost no shared-accommodation stock
Finally, set supply against demand. The horizontal axis plots each prefecture’s existing shared-accommodation stock (the number of operating properties classified as hostel, guesthouse, dormitory or youth hostel); the vertical axis plots estimated OCC for the business hotel category in June 2026 (a proxy for tightness across the budget-to-mid band); and bubble size represents the number of shared-accommodation openings in 2026.
Source: MetroEngines Research & Consulting (estimated OCC for June 2026; existing stock on an operating-property basis; covering the 46 prefectures with 30 or more properties in the business category)
The upper-left region — high estimated OCC but thin shared-accommodation stock — is occupied by the prefectures running from northern Tohoku into northern Kanto. Aomori sits among the highest in the country with an estimated OCC of 94.8% in the business category (as of June 2026, N=80 properties), yet has just 4 existing shared-accommodation properties and zero openings in 2026. Akita records an estimated OCC of 90.5% with 2 existing properties and zero new; Yamagata 93.0% with 3 existing and 1 new; Miyagi 90.5% with 13 existing and zero new; Fukushima 89.0% with 6 existing and zero new. The same structure appears in northern Kanto and the Tokyo commuter belt, with Ibaraki at an estimated OCC of 88.2% (as of June 2026) with 2 existing and zero new, and Saitama at 88.8% with 7 existing and zero new. Miyagi’s price-band structure in particular shows a traceable gap in the low-rate range when the market is broken into three tiers.
| Prefecture | Business category estimated OCC (June 2026) |
Properties (N) | Existing shared stock |
2026 shared openings |
|---|---|---|---|---|
| Aomori | 94.8% | 80 | 4 | 0 |
| Yamagata | 93.0% | 56 | 3 | 1 |
| Niigata | 90.6% | 109 | 17 | 1 |
| Akita | 90.5% | 53 | 2 | 0 |
| Miyagi | 90.5% | 126 | 13 | 0 |
| Fukushima | 89.0% | 127 | 6 | 0 |
| Chiba | 88.9% | 134 | 22 | 2 |
| Fukui | 88.8% | 39 | 2 | 2 |
| Saitama | 88.8% | 128 | 7 | 0 |
| Ibaraki | 88.2% | 152 | 2 | 0 |
| Tokushima | 88.1% | 62 | 14 | 2 |
| Saga | 88.0% | 41 | 9 | 0 |
| Okayama | 88.0% | 85 | 22 | 2 |
Source: MetroEngines Research & Consulting (based on confirmed OTA listings)
In contrast, four prefectures extend far to the right: Kyoto (679 existing properties), Okinawa (331), Tokyo (288) and Osaka (255). These four alone hold more than half of the national shared-accommodation stock — and 34 of the 96 new properties in 2026 landed in them. Kyoto’s estimated OCC in the business category is 87.4% (as of June 2026) and Osaka’s is 82.9%, at or below the national average, producing a cycle in which supply flows toward places that already have plenty of it and away from places that have little. Which price bands and guest segments this same “distributed low-rate supply” actually absorbs is examined for Kyoto, Okinawa and Tokyo in Minpaku Hits 10% of Inbound Stays: Kyoto, Okinawa, Tokyo Analysis.
That said, the skew has a rational side. Shared accommodation depends less on the absolute level of occupancy than on whether a steady flow of FIT and foreign independent travellers passes through year-round. Concentrating in gateway cities and famous tourist destinations is the result of prioritising certainty of demand capture. Put the other way round, the conditions for shared accommodation to work in a regional city rest on being able to stack three things: year-round business demand, event demand, and inbound travel as it disperses into the regions. On absorption capacity in regional core cities, see Supply Absorption Capacity in 8 Regional Core Cities; on the economics of converting existing building stock, see Simple Lodging × Vacant Home Reuse 2026.
Sensitivity of the capacity range — expanding per-person rate × occupancy as an identity
Taking the two ranges this article has presented — the ¥6,000–8,000 per-person level at the 96 new properties, and the 88.0–94.8% estimated OCC in the business category across the 13 gap prefectures (as of June 2026) — and applying them to the identity annual sales per bed = per-person rate × occupancy rate × 365 days shows the spread of revenue scale that adding capacity would imply. This is not a new measurement or a revenue forecast; it simply expands figures already stated in the text.
| Scenario | Per-person rate | Occupancy | Annual sales per bed | Basis of the range (figures stated in this article) |
|---|---|---|---|---|
| Pessimistic | ¥5,000 | 88.0% | approx. ¥1.61m | The lower bound of estimated OCC across the 13 gap prefectures (Okayama and Saga at 88.0%) and the ¥5,000 lower rate bound given in the conclusion |
| Middle | ¥6,000 | 91.4% | approx. ¥2.00m | The ¥6,000 lower bound of the modal band at the 96 new properties and the midpoint of estimated OCC across the 13 gap prefectures |
| Optimistic | ¥7,000 | 94.8% | approx. ¥2.42m | The ¥7,000 upper rate bound given in the conclusion and the upper bound of estimated OCC (Aomori at 94.8%) |
The gap between the lower and upper bounds is only about 1.5×. That is because the spread in rate (¥5,000–7,000 = 1.40×) is wider than the spread in occupancy (88.0–94.8% = 1.08×), which means revenue scale in this band is determined almost entirely by rate. Even in a prefecture with the highest occupancy in the country, cutting the rate by ¥1,000 could not be recovered by lifting occupancy seven points.
| Rate \ Occupancy | 88.0% | 89.7% | 91.4% | 93.1% | 94.8% |
|---|---|---|---|---|---|
| ¥5,000 | 161 | 164 | 167 | 170 | 173 |
| ¥5,500 | 177 | 180 | 183 | 187 | 190 |
| ¥6,000 | 193 | 196 | 200 | 204 | 208 |
| ¥6,500 | 209 | 213 | 217 | 221 | 225 |
| ¥7,000 | 225 | 229 | 234 | 238 | 242 |
The shaded cell is the middle case (¥6,000 per person × 91.4% occupancy). Both rate and occupancy fall within the ranges stated in the text.
Limits of this table: This is an arithmetic expansion using only the rate range and estimated OCC range stated in the text, with no assumptions whatsoever about operating costs, capital expenditure or seasonal variation in occupancy. It therefore cannot be used as a basis for yield calculations or investment decisions. In addition, bed-level occupancy in a dormitory is defined differently from the estimated OCC used here (room-level, business category), so the figures should be read as an indication of order of magnitude.
Conclusion — read this not as a growing format but as an undersupplied one
Pulling the aggregation together: first, new openings in the budget shared segment stand at 96 properties on current observation for 2026 (49 hostels, 47 guesthouses), and their share of total openings has fallen for three consecutive years to 9.9%. No “renewed expansion” is visible on a property-count basis. Second, supply and demand in this band are the tightest anywhere, with estimated OCC in the capsule category at 95–99% in major cities, above every other category. Third, the price band the 96 new properties entered peaks at ¥6,000–8,000 per person, between the capsule band and single occupancy at a business hotel.
Fourth, on the demand side, total inbound arrivals have fallen year on year for three consecutive months, but the driver is the decline in the Chinese market, while FIT-heavy South Korea, Taiwan, Hong Kong and the United States all set June records. The demand pool that shared accommodation serves is, if anything, thickening. And fifth, supply is concentrating in existing clusters and is not flowing to the prefectures where supply and demand are tight — Aomori, Akita, Yamagata, Miyagi, Fukushima, Ibaraki and Saitama.
Stack these five points together and budget shared accommodation reads less as “a growth format with momentum” than as “a format whose capacity has not kept up with demand.” Its small scale limits the impact of any single property, but an average of 11 rooms brings an agility that suits conversion of existing buildings and phased rollouts. The prefectures of northern Tohoku and northern Kanto in particular have base occupancy secured by business demand while almost no low-rate options exist. Placing shared-accommodation capacity there in the ¥5,000–7,000 per-person range would leave room to open up new demand without competing for the same guests as existing hotels. How far the actual 2026 count builds up as further listings are added will serve as a measure of how much of that headroom is being picked up.
Related Reading
- Supply Absorption Capacity in 8 Regional Core Cities — GW2026 Sellout Rate × New Openings Map
- Simple Lodging × Vacant Home Reuse 2026: Kyoto, Osaka & Naha Whole-House IRR
- Minpaku Hits 10% of Inbound Stays: Kyoto, Okinawa, Tokyo Analysis
References and Sources
■ Data sources
The property counts, room counts, prices and estimated OCC in this article are based on publicly available data aggregated by MetroEngines Research & Consulting from listing and inventory information on major OTAs. New openings cover full-year 2026 (observed as of July 2026) on a confirmed-OTA-listing basis, with N=972 properties, of which 49 hostels and 47 guesthouses — 96 in total — are the subject here. Estimated OCC and estimated ADR are aggregated by prefecture × category for June 2026 check-in dates; listed prices are for July 2026 check-ins (confirmed for 87 of the 96 shared-accommodation properties). On the demand side, the Japan Tourism Agency’s “Overnight Travel Statistics Survey” for May 2026 (first preliminary figures) and JNTO’s estimate of inbound visitors for June 2026 were referenced.
■ Calculation assumptions
Year-on-year comparisons are treated as comparisons between lower bounds measured on the same aggregation basis for each year (confirmed OTA listings). The capsule hotel category is used as a supply-demand proxy for the shared segment, and estimated OCC for the business hotel category is used as the measure of regional tightness. The screening condition for “prefectures with thin capacity” is an estimated OCC of 88% or higher in the business category and 25 or fewer existing shared-accommodation properties, across the 46 prefectures with 30 or more properties in the business category. Per-person prices are reference values obtained by mechanically dividing the double-occupancy listed price by two. Annual sales per bed in the sensitivity table are calculated solely from the identity “per-person rate × occupancy rate × 365 days,” with no assumptions about operating costs, capital expenditure or seasonality.
■ Limitations and caveats
Because opening data are observations anchored to the point at which an OTA listing could be confirmed, recent months and the latter half of the current year are structurally undercounted, and the 96 properties recorded for 2026 will rise as further listings are added. Estimated OCC is an estimate based on how fast inventory offered for sale on OTAs is consumed, and its population differs both from a property’s true overall occupancy and from the simple-lodging occupancy rate in Japan Tourism Agency statistics. Because figures continue to edge up as observations accumulate even for check-in months already in the past, the estimated OCC here is a snapshot as of the date of writing (26 July 2026). The capsule category comprises only 2 to 39 properties per prefecture, so its level is swayed by movements at a small number of properties. The hostel and guesthouse categories also include small apartment-style and residence-style properties, and new build, conversion and rebrand cannot be distinguished from public information alone. Actual transacted prices and accounting figures at individual properties differ from the estimates presented here.
■ Market data
- MetroEngines Research & Consulting — new opening data (confirmed OTA listings, 2026 N=972 properties, of which N=96 in the shared segment), estimated OCC (June 2026 check-in dates, by prefecture × category), estimated ADR and listed prices (June–July 2026), existing property stock (operating-property basis)
■ Government statistics and official data
- Japan Tourism Agency, “Overnight Travel Statistics Survey (April 2026 second preliminary figures, May 2026 first preliminary figures, and 2025 annual confirmed figures)”
- Japan National Tourism Organization (JNTO), “Foreign Visitors to Japan (June 2026 estimates)”
- Japan Tourism Agency, “Overnight Travel Statistics Survey” (statistics top page)
■ News coverage
- Weekly Hotel Restaurant, “Japan Tourism Agency releases first preliminary figures of the ‘Overnight Travel Statistics Survey’ for May 2026” (7 July 2026)
- Travel Voice, “Inbound visitors down 6.8% year on year to 3.15 million in June 2026 — a third straight month of decline, yet record highs in 15 markets” (15 July 2026)
- Yamatogokoro.jp, “3.15 million inbound visitors in June 2026; first-half cumulative total of 21.08 million, down 2.0% year on year”
- Honichi Lab, “13.82 million foreign guest-nights in May [Japan Tourism Agency Overnight Travel Statistics, April and May 2026]”
About the data scope of this article: The new openings, property counts, prices and estimated OCC in this article are aggregated within the scope tracked by MetroEngines Research (based on major OTA listings and publicly available information) and do not constitute a complete census. Properties not listed on OTAs are not included. Estimated OCC is an estimate based on how fast inventory offered for sale on OTAs is consumed and differs from a property’s true overall occupancy. Because opening data are anchored to confirmation of an OTA listing, they also tend to appear understated for the most recent months.