

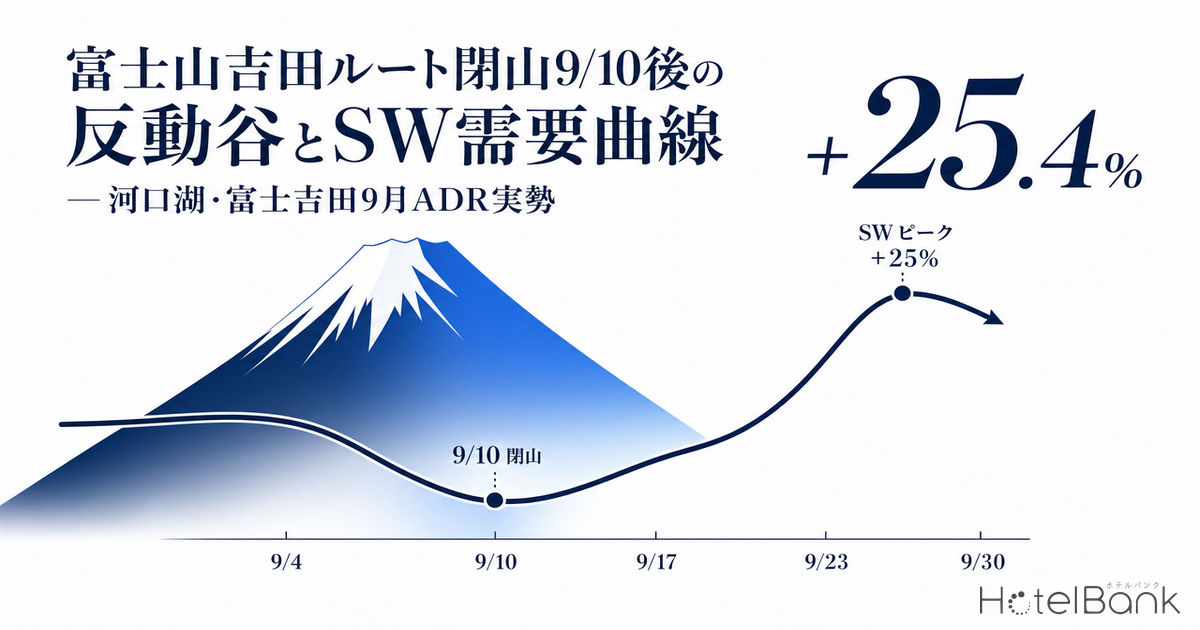
The Mt. Fuji Yoshida Route closes on September 10, 2026 (per the official Yamanashi Prefecture announcement). Does the week immediately after the climbing rush disappears (9/11–9/17) become a “reactionary trough” for lodging demand at the mountain’s base? We test this hypothesis using lodging inventory data for Kawaguchiko, Fujiyoshida and Lake Yamanaka (N=223 properties). The conclusion up front: the reaction right after the closure is surprisingly small, and the true demand driver lies in the following week’s Silver Week (SW) holiday. Listed prices during the SW peak run +21.4% above the immediate post-closure level and +26.6% year-on-year — confirming that the base area builds its pricing on “growing leisure demand” rather than “the end of the climbing rush.”
Metric Definitions Used in This Article
- ADR (Average Daily Rate): An estimated transaction rate (tax-excluded equivalent) calculated by applying a segment-specific adjustment coefficient to the lowest publicly listed plan rate each property shows on OTAs (per room, double occupancy, tax included). Cross-checked against property-level actuals disclosed by listed hotel REITs (91 properties, most recent 3 months), the median error is approximately 7%. These are estimates and differ from each property’s actual transaction prices and accounting figures. Area-level ADR is the median of the target properties (the level of a typical property in the area).
- Occupancy (OTA-listed-inventory basis, estimated): The ratio of sold rooms to total rooms in the area (an estimate based on OTA sales inventory). It is an estimate based on how OTA-listed inventory is being sold down, and differs from each property’s overall actual occupancy.
- Listed price: The level used in this article’s daily price trend is the all-plan average of the per-room rate (tax included) for double occupancy.
- Data source: MetroEngines Research (Yamanashi northern-foot-of-Fuji area, N=223 properties, daily listing data September 4–September 30)
- — The post-closure reactionary trough is effectively zero. The real floor in listed prices is not the week after closure but 9/18 (Fri), just before SW, at ¥51,900.
- — The SW peak (9/19–9/23) is the only clear spike. +21.4% vs. immediate post-closure (¥64,700) and +26.6% YoY; the strongest growth rate is at Lake Yamanaka (+27.0%), the highest of the three areas.
- — The late-September revenue backbone is built from the 5 SW peak days plus the lakeside “afterglow” weekend (9/26 & 9/27) — 7 days in total. The strategic axis is “maximizing the leisure demand curve” rather than “countering a closure slump.”
The Post-Closure Trough Is “Nearly Zero” — Re-examining the Conventional Wisdom
Per Yamanashi Prefecture’s official announcement, the Mt. Fuji Yoshida Route will, as in prior years, open on July 1 and close on September 10 in 2026. Operational rules such as the 4,000-person daily entry cap and the ¥4,000 climbing fee also continue. The question we focus on here is how far the disappearance of climbers due to the closure affects demand at the base-area hotels and ryokan. The hypothesized scenario is that “demand drops sharply the day after closure and stays in a reactionary trough until the following week’s Silver Week peak.” We analyzed the demand-absorption structure of the opening day in Mt. Fuji 2026: ¥4,000 Climbing Fee + Lodging Tax Double-Tax Structure, and the closure-side reaction is the paired counterpart to that analysis. But the data clearly refutes this hypothesis.
Aggregating daily listed prices across the 5 municipalities and N=223 properties of Kawaguchiko, Fujiyoshida, Lake Yamanaka, Oshino and Narusawa, the average for the final week of the climbing season (9/4–9/10) was ¥53,100, versus ¥53,300 for the week right after closure (9/11–9/17) — essentially flat. Compared with the same immediate-post-closure week a year earlier (2025, 9/11–9/17, ¥52,600), it is +1.4%, a marginal increase. At least as far as listed prices show, the demand drop from closure does not appear as a price decline.
What is more interesting is that while the week right after closure does not become a “genuine trough,” listed prices dip once to ¥51,900 on the Friday just before SW (9/18), then jump sharply from Saturday 9/19. Here we see that the true demand driver of the base area is leisure travelers, not climbers.
Source: MetroEngines Research; compiled by the HotelBank Editorial Team (N=223 properties)
A Tiered Comparison of 5 Periods — SW Peak +21.4% Is the Only Clear Spike
Dividing September 4 to September 30 into five periods makes the price-band staircase clear. Taking the immediate post-closure level as the baseline (¥53,300), the SW peak (9/19–9/23) is +21.4% (¥64,700) and the post-SW normalization week (9/24–9/30) is +3.4% (¥55,100). The Friday just before SW (9/18) is the lowest at ¥51,900, and this is the effective “trough.” The post-closure trough is barely observable in the numbers, confirming that the single day just before SW is the true bottom.
| Period | Days | Sample properties | Avg. listed price | vs. post-closure | vs. 2025 same period |
|---|---|---|---|---|---|
| Final climbing week 9/4–9/10 | 7 | 223 | ¥53,100 | -0.3% | +5.6% |
| Immediately post-closure 9/11–9/17 | 7 | 221 | ¥53,300 | baseline | +1.4% |
| Just before SW 9/18 (Fri) | 1 | 206 | ¥51,900 | -2.7% | — |
| SW peak 9/19–9/23 | 5 | 218 | ¥64,700 | +21.4% | +26.6% |
| Post-SW 9/24–9/30 | 7 | 216 | ¥55,100 | +3.4% | +9.8% |
Especially notable is the SW peak’s +26.6% year-on-year growth. September 19–23, 2025 (Sat–Sun–Mon–Tue–Wed) and September 19–23, 2026 (Sat–Sun–Mon–Tue–Wed) have nearly the same weekday composition, so this reads as a genuine price increase rather than a simple day-of-week effect. That the SW peak’s growth (+26.6% YoY) far exceeds the immediate-post-closure week’s growth (+1.4% YoY) confirms that the base area’s growth driver is Silver Week leisure, not climbing. The week after closure is closer to a “lull in normal operations” than a “reactionary trough.” The details of the double-tax structure — where the ¥4,000 climbing fee overlaps with the lodging tax during the open season — are laid out in Mt. Fuji 2026 Opening × Summer Peak Booking Progress.
By Area — The Reactionary Gap Across Kawaguchiko, Lake Yamanaka and Fujiyoshida
Looking at the three main areas individually, the SW-peak jump differs. Fujiyoshida City has the highest SW-peak listed price at ¥75,700, +21.3% vs. immediate post-closure. However, with N=24 properties it is small in scale, and its composition — many properties in urban business locations — pushes the price band up. Kawaguchiko is ¥62,400 (+20.0%) across N=123 properties, a mixed zone of lakeside leisure lodgings and sightseeing ryokan. Lake Yamanaka, at N=66 properties, is ¥58,700 (+27.0%), the largest SW-peak growth rate of the three areas.
| Area | N | Final climbing week | Post-closure | SW peak | SW growth | Post-SW |
|---|---|---|---|---|---|---|
| Kawaguchiko | 124 | ¥51,961 | ¥52,004 | ¥62,427 | +20.0% | ¥53,518 |
| Lake Yamanaka | 66 | ¥45,688 | ¥46,256 | ¥58,723 | +27.0% | ¥45,867 |
| Fujiyoshida | 25 | ¥63,191 | ¥62,350 | ¥75,659 | +21.3% | ¥66,837 |
Behind Lake Yamanaka’s high growth rate is its highland location at an average elevation of 980m. In midsummer it functions as a cool-weather retreat, and from mid-September onward as a leisure season. Kawaguchiko, a lakeside sightseeing staple, draws stable visitors year-round, but its SW-peak jump is more modest than Lake Yamanaka’s. Because Fujiyoshida is an urban location, leisure/sightseeing demand mixes with business and climbing-related demand, so even at the SW peak the concentration of demand is less sharp than at the lakesides.
Source: MetroEngines Research; compiled by the HotelBank Editorial Team
By Elevation Band — Highland and Lakeside React Differently
Re-bundling the areas by elevation band brings out the difference in the shape of the demand curve. The highland area at 950m and above (Lake Yamanaka Village, Oshino Village, Narusawa Village, N=157 properties) is flat at +1.2% from the final climbing week to immediately post-closure, jumps sharply at the SW peak (+26.4%), then settles back to normal at -0.8% post-SW. The lakeside area at 700–900m (Kawaguchiko Town, Fujiyoshida City, N=247 properties) moves within a narrow range through the climbing season, post-closure and just-before-SW, then rises +20.2% at the SW peak and retains an afterglow at +4.4% post-SW.
Source: MetroEngines Research; compiled by the HotelBank Editorial Team
The pattern where the lakeside area retains a +4.4% afterglow post-SW while the highland area returns to baseline suggests the lakeside more readily captures post-normalization weekend demand (Sat 9/26, Sun 9/27). This is presumably because autumn-foliage drive demand flows into lakeside sightseeing on the final September weekend, giving lakeside-located lodgings the strength to design late-September revenue not only around the SW “one-week peak” but also the following “one-to-two-week afterglow.”
By Grade — Growth Across All Price Bands, With Similar Rates
By grade, the SW-peak growth rates are roughly level: Luxury +20.8%, High-grade +21.1%, Upper +22.7%, Economy +23.1%, Budget +12.6% — showing that demand grows evenly regardless of price band. Only the budget band, at +12.6%, is modest, because many guesthouses, minshuku and small lodges operate at “normal rates even on holidays” and do not actively adopt dynamic-pricing plans. Put the other way, the budget band still has upside for SW pricing design that leverages price elasticity.
| Grade | Properties | Post-closure | SW peak | SW growth |
|---|---|---|---|---|
| Luxury | 25 | ¥73,140 | ¥88,343 | +20.8% |
| High-grade | 19 | ¥50,090 | ¥60,655 | +21.1% |
| Upper | 55 | ¥43,339 | ¥53,166 | +22.7% |
| Economy | 58 | ¥26,217 | ¥32,265 | +23.1% |
| Budget | 63 | ¥20,061 | ¥22,589 | +12.6% |
Source: MetroEngines Research; compiled by the HotelBank Editorial Team
SW Growth Ranking by Individual Property — Lodgings With Visible Upside
Comparing SW-peak and immediate-post-closure listed prices at the individual-property level, the properties that stand out by growth rate come into view. Below is a list of the top 8 properties, conditioned on a scale of 10 rooms or more; all of them apply pricing that lifts the listed price substantially for the SW peak. Lodgings that move their listed prices flexibly can be said to be maximizing a demand peak like SW as a revenue opportunity.
| Rank | Property | Area | Rooms | Grade | Post-closure | SW peak | Growth |
|---|---|---|---|---|---|---|---|
| 1 | Pension & Rental Villa Step House (ペンション&貸別荘 ステップハウス) | Lake Yamanaka Village | 13 | Economy | ¥32,857 | ¥58,800 | +79.0% |
| 2 | Kawaguchiko Hotel (河口湖ホテル) | Fujikawaguchiko Town | 38 | Upper | ¥40,873 | ¥71,903 | +75.9% |
| 3 | Fujikawaguchiko Onsen Hotel Gengo (富士河口湖温泉 ホテル源吾) | Fujikawaguchiko Town | 14 | Economy | ¥21,253 | ¥34,359 | +61.7% |
| 4 | Family Lodge Hatagoya Lake Yamanaka (ファミリーロッジ旅籠屋・山中湖店) | Lake Yamanaka Village | 14 | Budget | ¥14,914 | ¥23,700 | +58.9% |
| 5 | Fuji Lake Yamanaka Hotel (富士山中湖ホテル) | Lake Yamanaka Village | 48 | Upper | ¥18,790 | ¥29,599 | +57.5% |
| 6 | Royal Hotel Kawaguchiko (ロイヤルホテル河口湖) | Fujikawaguchiko Town | 38 | Upper | ¥35,733 | ¥56,015 | +56.8% |
| 7 | PICA Fuji Saiko (PICA富士西湖) | Fujikawaguchiko Town | 62 | Budget | ¥26,727 | ¥40,475 | +51.4% |
| 8 | Yamagishi Ryokan (山岸旅館) | Fujikawaguchiko Town | 57 | High-grade | ¥37,095 | ¥55,732 | +50.2% |
Pension & Rental Villa Step House (Lake Yamanaka, 13 rooms) recorded the largest jump, +79.0%, from ¥32,900 immediately post-closure to ¥58,800 at the SW peak. Likewise, Kawaguchiko Hotel (38 rooms, Upper) is +75.9% and Fuji Lake Yamanaka Hotel (48 rooms, Upper) +57.5% — rental villas, pensions and lakeside sightseeing hotels occupy the top of SW pricing design. This tendency reflects the concentration of individual and group leisure demand during the SW peak, and shows that particularly large revenue opportunities exist for whole-rental, lakeside and leisure-focused lodgings. Meanwhile, business-travel-oriented lodgings find it hard to move SW prices much, and their pricing-design room is limited.
Implications for Q4 Revenue Design
From this data, we confirmed that there is effectively no demand fault line bordering the closure date (9/10), and that the 5 days of the SW peak (9/19–9/23) create the bulk of late-September revenue. Viewed across September as a whole, the monthly-revenue backbone is built from 7 days: the 5 SW-peak days plus the 2 post-SW afterglow-weekend days (9/26, 9/27) in the lakeside area. The overall picture of nationwide SW booking progress, sellout rates and price ceilings is surveyed in Silver Week 2026 Booking Progress Map, a useful reference for grasping where the base area sits. The revenue-design implications we can read from this are as follows.
First, the week after closure (9/11–9/17) is not a “period to endure” but can already be operated as a stable, normal-demand period. Listed prices in this period hold at roughly the same level as the final climbing week, so weekday-to-weekend occupancy can likely be secured without major price cuts.
Second, the Friday just before SW (9/18) is the single day when listed prices sink the most, leaving room to design a “SW eve plan” or “Friday one-night early-holiday plan” aimed at this day alone. The context of a single day just before prices leap the next day is easy to use as a demand-creation narrative.
Third, for the 5 SW-peak days, budget and economy lodgings can expect further upside on top of their +12.6% to +23.1% growth by improving listed-price flexibility. The budget band in particular (+12.6%) has the most modest growth rate by grade, and by finely designing the price-band staircase there is room to lift it to around +20%.
Fourth, lakeside lodgings can design late September as a whole — including the post-SW weekend (9/26, 9/27) — capturing early-autumn-foliage afterglow demand in addition to “cashing in” on the SW peak. The highland area’s demand peak is compressed into one week, but the lakeside has the strength to accumulate demand thinly and broadly across two weeks.
The Closure Date Is Not a “Boundary” but a “Waypoint” — Conclusion
The data confirms that the Mt. Fuji Yoshida Route closure date is not a clear “boundary” for base-area lodging demand, but one waypoint within a continuous demand curve running from mid-to-late September. The true boundary lies rather between the Friday just before SW (9/18) and the following Saturday (9/19). For base-area lodgings, a late-September revenue strategy built along the leisure-demand curve — “how to maximize the 5 SW-peak days,” “design late September as a whole through the afterglow weekend (9/26, 9/27) if lakeside-located,” and “use the single day just before SW as a hook to create one-night demand” — leads to results far more reliably than one centered on “countering a post-closure slump.”
This data confirms that the disappearance of the climbing rush is, for base-area lodgings, not “demand lost” but “demand that was small to begin with.” The fact that the SW-peak listed price grew to +26.6% year-on-year backs up that the base area’s demand driver lies in leisure and sightseeing, and revenue design that accounts for this structure leaves room for late-September revenue to grow steadily.
⚠ Note on ADR for future dates: ADR and listed prices from September 17 onward in this article are the average of sale prices publicly listed on OTAs at the time of the survey, and fluctuate as the check-in date approaches. Please note that prices set high at present may fall due to last-minute discounting.
Related Reading
- Mt. Fuji 2026: ¥4,000 Climbing Fee + Lodging Tax Double-Tax Structure
- Silver Week 2026 Booking Progress Map — First 9-Day Holiday in 11 Years: Sellout Rates and Price Ceilings as of May
- Silver Week 2026, First in 11 Years — 9-Day Holiday ADR Analysis and Pricing Strategy Read Through the Booking Curve
References & Sources
- Yamanashi Prefecture, “Mt. Fuji Climbing in FY2026” — official announcement of the Yoshida Route open July 1 to close September 10
- Mt. Fuji Official Site, “[Yoshida Route] On Mt. Fuji Climbing Restrictions (2026)” — operational details of traffic restrictions, the ¥4,000 climbing fee and the 4,000-person daily cap
- Fuji-no-Kuni Yamanashi Tourism Net, “Mt. Fuji Climbing [Yoshida Route]: Traffic Restrictions and the Entry Reservation System”
- MetroEngines Research — OTA listed-price data for the northern-foot-of-Fuji area (Fujikawaguchiko Town, Fujiyoshida City, Lake Yamanaka Village, Oshino Village and Narusawa Village, Yamanashi Prefecture), N=404 properties, daily aggregation September 4–September 30