

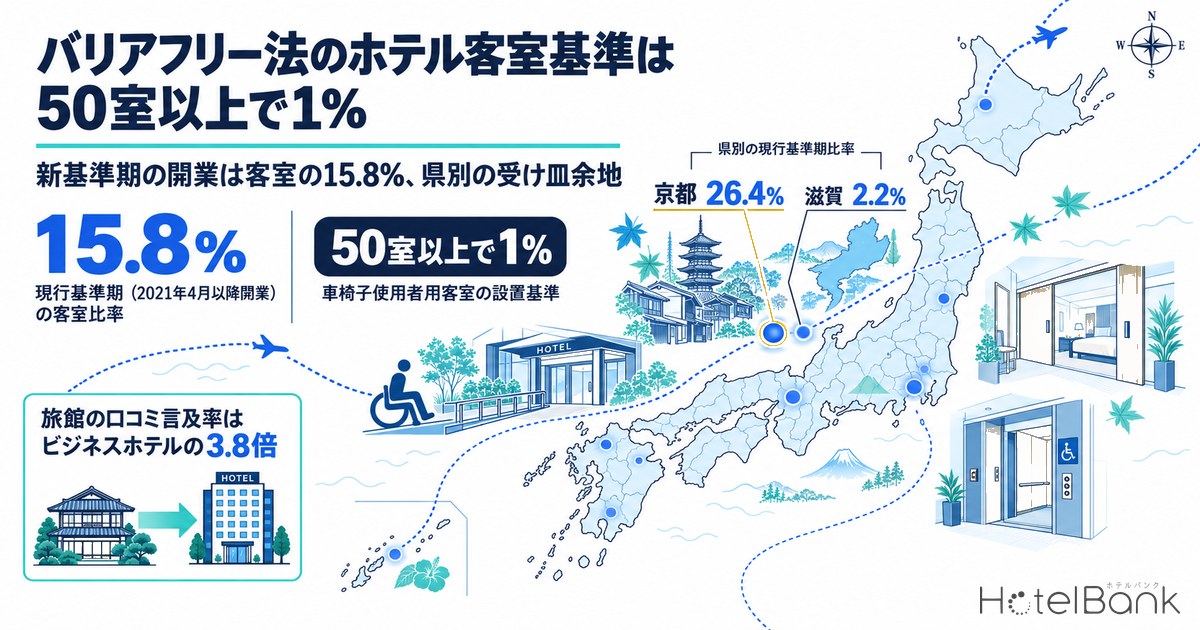
Japan’s Barrier-Free Act enforcement order requires any hotel or ryokan with 50 or more guest rooms that is newly built, extended or rebuilt to provide wheelchair-accessible guest rooms equal to at least 1% of its total rooms. This “1% rule” took effect on September 1, 2019, and does not reach buildings whose construction began before that date. We split the 8,069 properties and 1,214,767 rooms with 50+ rooms listed on major booking sites by opening date: stock opened in or after April 2021 — the cohort likely to have started construction after the rule took effect — accounts for 15.8% of rooms. This article confirms the rule’s exact scope from primary sources, measures the depth of this newer stock prefecture by prefecture, and overlays it with the interest in accessibility that shows up in guest reviews to identify where the headroom for accessible capacity lies.
Metric Definitions Used in This Article
- Population: among properties listed on major booking sites (OTAs etc.) with rates confirmed in the latest 12 months (October 2025 – September 2026) and a known room count, the 8,069 business hotels, city hotels, resort hotels, ryokan and deluxe hotels with 50 or more rooms (1,214,767 rooms). This is not a full census; properties not listed on booking sites are excluded.
- Opening-period bands: the 7,704 properties with a known opening month are split into (1) opened in or before August 2019, (2) opened September 2019 – March 2021 (transition band) and (3) opened in or after April 2021 (current-standard period). Because the 1% rule applies to construction started on or after September 1, 2019, band (3) — allowing for the build period between groundbreaking and opening — is treated as “stock that may fall under the current standard.” This is an estimate from opening dates; individual properties’ construction-start dates, floor areas and compliance status were not checked. The 365 properties with an unknown opening month are excluded from the ratio denominators.
- Estimated required rooms: the sum of each property’s total rooms × 1/100 (fractions rounded up), applied mechanically. This is not a count of wheelchair-accessible rooms that actually exist.
- Review mention rate: the share of guest reviews in the latest 24 months (October 2024 – September 2026) that mention in-property accessibility, such as steps, wheelchairs or elevators. It measures how often the topic comes up, not whether ratings are high or low.
- Data sources: room stock = MetroEngines Research / reviews = HotelBank Editorial Team / regulations = e-Gov Laws and Regulations Search, Ministry of Land, Infrastructure, Transport and Tourism (MLIT) / demand size = Japan Tourism Agency, Ministry of Internal Affairs and Communications, Cabinet Office
Key Takeaways
| In force since Sep 1, 2019 | The 1% rule was introduced by Cabinet Order No. 298 of 2018 and applies to new builds, extensions, rebuilds and changes of use started on or after the effective date. It does not apply retroactively to existing buildings, for which it is only a duty to make efforts. |
| Current-standard period: 15.8% | Of the 8,069 properties with 50+ rooms, 1,154 properties and 187,041 rooms opened in or after April 2021. About one room in six may fall within the scope of the new standard. |
| Kyoto 26.4% to Shiga 2.2% | The current-standard share differs twelvefold between prefectures, with a median of 14.4%. It is highest in the cities and tourist areas that saw the most recent openings. |
| Ryokan mention rate: 3.8x | Of 6,934,690 reviews, 15,523 (0.22%) mention accessibility. Ryokan reach 0.47%, 3.8 times the 0.12% of business hotels — yet only 4.2% of rooms at ryokan with 50+ rooms are current-standard stock. |
| Age 70+: 31.8M person-trips | In 2025, people aged 70 and over made 31.8 million domestic overnight person-trips and spent about ¥2.3 trillion. Raising trips by people in their 70s by just 0.1 per person would add about 1.61 million person-trips. |
The Barrier-Free Act room standard — 1% at 50+ rooms, for construction started from September 2019
Let us first check the rules against primary sources. Article 14(1) of the Act on Promotion of Smooth Transportation, etc. of Elderly Persons, Disabled Persons, etc. (the Barrier-Free Act) obliges building owners who construct a Specified Building for Special Use above a size set by Cabinet Order to comply with the Building Accessibility Standards. Hotels and ryokan are Specified Buildings for Special Use, and Article 9 of the enforcement order sets the size threshold at a total floor area of 2,000 m². “Construction” here covers not only new builds but also extensions, rebuilds and changes of use; for extensions, rebuilds and changes of use, the floor area of the affected part is what counts.
The guest-room standard sits in Article 16(1) of the current enforcement order. It provides that “where the total number of guest rooms is fifty or more, wheelchair-accessible guest rooms shall be provided in a number not less than the total number of guest rooms multiplied by one hundredth (rounded up where there is a fraction of less than one),” and sets no number for properties with 49 rooms or fewer. A 120-room property would therefore need 2 rooms and a 250-room property 3. When it came into force in 2019 this provision was Article 15(1); it moved down to Article 16 under the amendment effective June 1, 2025 (Cabinet Order No. 221 of 2024), which added a new provision on theater seating. That is why older documents refer to “Article 15.”
The amendment unfolded as follows. The previous requirement of “at least one room where there are 50 or more rooms” was changed to “at least 1% of total rooms” by Cabinet Order No. 298 of 2018 (promulgated October 19, 2018), and this part took effect on September 1, 2019. Paragraph 2 of that order’s supplementary provisions states that the amended rules apply to “construction started after the effective date,” while construction started before it “remains subject to the previous rules.” In other words, the standard is not retroactive. A building whose construction began in or before August 2019 can lawfully continue operating under the old standard unless it later undergoes an extension, rebuild or change of use above the threshold size.
Does that mean nothing is asked of existing properties? Not quite. Article 14(5) of the Act requires building owners outside the compliance obligation to make efforts to take the measures needed to bring the Specified Buildings for Special Use they own or manage into line with the standards. It is a duty to make efforts rather than an obligation, and the timing and scope of any retrofit are left to each property. Note also that April 1, 2021 — a date often confused with this one — is the effective date of a separate amendment (Cabinet Order No. 302 of 2020) that added public elementary and junior high schools, not the effective date of the guest-room standard.
| Item | Content | Legal basis |
|---|---|---|
| Scope of the compliance obligation | New builds, extensions, rebuilds and changes of use of hotels and ryokan with a total floor area of 2,000 m² or more | Act Art. 14(1); Enforcement Order Art. 9 |
| Guest-room standard | With 50 or more total guest rooms, wheelchair-accessible rooms equal to at least 1% of total rooms (rounded up) | Enforcement Order Art. 16(1) (Art. 15(1) when it took effect) |
| Standard before the amendment | With 50 or more total guest rooms, at least one room | Enforcement Order Art. 15(1) before the amendment |
| Amending order | Cabinet Order No. 298 of 2018 (promulgated October 19, 2018) | Same order |
| Effective date of the 1% rule | September 1, 2019 | Same order, Supplementary Provisions para. 1, item 2 |
| Transitional measures | Applies to construction started after the effective date; construction started earlier follows the previous rules (not retroactive) | Same order, Supplementary Provisions para. 2 |
| Existing properties | Make efforts to take the measures needed to comply with the standard (duty to make efforts) | Act Art. 14(5) |
| Local add-ons | Local ordinances may lower the size threshold or add requirements | Act Art. 14(3) |
Source: compiled by HotelBank Editorial Team from the Barrier-Free Act and its Enforcement Order on e-Gov Laws and Regulations Search
As the last row of Table 1 shows, some local governments add to the national standard by ordinance. Tokyo amended its Building Barrier-Free Ordinance to set standards such as doorway width for regular guest rooms at hotels and ryokan with a floor area of 1,000 m² or more (promulgated March 29, 2019, effective September 1 the same year). Developers should check early in the design stage what add-ons the building authority for their site applies. A nationwide tally of the number of wheelchair-accessible rooms legally required is the subject of a separate HotelBank analysis, so this article focuses on the time axis — when each building was built. That analysis’s figures of “6,967 properties with 50+ rooms and 12,890 legally required rooms” are based on properties confirmed as operating on OTAs with a registered room count as of August 2026; they differ in population and timing from this article’s 8,069 properties and 15,825 rooms, which count five property categories with rates confirmed on major booking sites in the latest 12 months.
Stock with 50+ rooms — 1,154 properties and 15.8% of rooms opened in the current-standard period
Because the rules are not retroactive, how far the standard reaches depends on how new the stock is. Counting properties with 50+ rooms that are listed on major booking sites and have a known room count in MetroEngines Research data gives 8,069 properties and 1,214,767 rooms across the five categories. Table 2 splits the 7,704 properties and 1,181,366 rooms with a known opening month into three opening periods.
| Opening period | Properties | Property share | Rooms | Room share | Est. rooms under 1% rule |
|---|---|---|---|---|---|
| Up to Aug 2019 (pre-standard period) | 6,018 | 78.1% | 899,263 | 76.1% | 11,734 rooms |
| Sep 2019 – Mar 2021 (transition band) | 532 | 6.9% | 95,062 | 8.0% | 1,210 rooms |
| Apr 2021 onward (current-standard period) | 1,154 | 15.0% | 187,041 | 15.8% | 2,393 rooms |
| Opening month unknown | 365 | — | 33,401 | — | 488 rooms |
| Total | 8,069 | — | 1,214,767 | — | 15,825 rooms |
Source: MetroEngines Research; compiled by HotelBank Editorial Team (estimated rooms apply the current standard mechanically and are not a count of wheelchair-accessible rooms that actually exist)
Properties opened in or after April 2021 number 1,154, with 187,041 rooms — 15.0% of properties and 15.8% of rooms. The cutoff is set at April 2021 because the standard applies to “construction started after the effective date.” Hotels with 50+ rooms often take one to two years from groundbreaking to opening, so spring 2021 was taken as the point when buildings started from September 2019 onward would begin to open. The 532 properties and 95,062 rooms opened between September 2019 and March 2021 fall in a transition band whose treatment depends on whether construction started before or after the effective date. Even including the transition band the share is 23.9%, meaning just over three-quarters of rooms are stock built in the old-standard era.
Source: MetroEngines Research (based on confirmed OTA listings; N=2,868 properties opened from 2014); compiled by HotelBank Editorial Team (properties with 50+ rooms and a known opening month; 2026 covers listings confirmed up to the survey date)
Arranged by opening year, new openings with 50+ rooms were thickest around the time the rule took effect: 54,890 rooms in 2018, 60,972 in 2019 and 59,140 in 2020. Much of that peak is likely to be projects started before the effective date, which is why the transition band weighs so heavily. From 2021 onward, stock has accumulated at 27,646–44,351 rooms a year, so the current-standard share grows by roughly 2–4 points annually. The 2026 figure covers listings confirmed up to the survey date (early October 2026) and may rise as more listings appear.
Applying the 1% rule mechanically to the 1,154 current-standard properties gives 2,393 estimated rooms, or 0.20% of the 1,214,767 rooms at properties with 50+ rooms. If all 8,069 properties had been built under the current standard, the figure would be 15,825 rooms (1.30%); the 13,432-room difference is the headroom that may take shape through rebuilds, major renovations or voluntary retrofits. This estimate, however, does not check the 2,000 m² floor-area requirement or individual compliance, and many pre-standard properties do have wheelchair-accessible rooms. Read the figures only as a guide to “how far the standard’s reach extends.”
There is a range of reasonable cutoffs. The shorter the assumed build period from groundbreaking to opening, the larger the current-standard cohort; the longer, the smaller. Table 3 uses Table 2 and the opening-year breakdown (chart above) to show the size of the current-standard cohort as the cutoff month moves. A cutoff at the September 2019 effective date gives 23.9% of rooms, January 2020 gives 21.8%, and delaying it to January 2022 gives 13.1%; this article’s 15.8% sits in the middle. Whichever cutoff is chosen, over three-quarters of rooms are stock opened before it, so the reading that “the 1% rule still reaches only part of the stock” does not depend on the assumption.
| Start of current-standard period (opening month) | Assumed groundbreaking-to-opening period | Properties | Property share | Rooms | Room share |
|---|---|---|---|---|---|
| Sep 2019 onward (incl. transition band) | 0 months (all openings from the effective date) | 1,686 | 21.9% | 282,103 | 23.9% |
| Jan 2020 onward | About 4 months | 1,561 | 20.3% | 257,663 | 21.8% |
| Jan 2021 onward | About 1 year 4 months | 1,228 | 15.9% | 198,523 | 16.8% |
| Apr 2021 onward (this article’s definition) | About 1 year 7 months | 1,154 | 15.0% | 187,041 | 15.8% |
| Jan 2022 onward | About 2 years 4 months | 940 | 12.2% | 154,172 | 13.1% |
Source: MetroEngines Research; compiled by HotelBank Editorial Team (N=7,704 properties. Values for the January 2020, January 2021 and January 2022 cutoffs are built up from the opening-year breakdown (N=2,868 properties). Periods are approximate, measured from the September 1, 2019 effective date to the cutoff month)
By category — ryokan draw the most review interest, and their new stock is still to come
| Category | Properties (50+ rooms) | Rooms (same) | Current-standard properties | Rooms (same) | Room share | Est. rooms | Accessibility mention rate | Parent/grandparent mention rate |
|---|---|---|---|---|---|---|---|---|
| Business hotels | 5,363 | 792,154 | 814 | 130,539 | 17.0% | 1,674 rooms | 0.12% | 0.06% |
| City hotels | 994 | 198,905 | 127 | 28,559 | 14.5% | 351 rooms | 0.18% | 0.22% |
| Resort hotels | 782 | 116,582 | 145 | 20,602 | 18.1% | 265 rooms | 0.36% | 0.77% |
| Ryokan | 787 | 69,285 | 31 | 2,697 | 4.2% | 41 rooms | 0.47% | 1.12% |
| Deluxe hotels | 143 | 37,841 | 37 | 4,644 | 12.3% | 62 rooms | 0.18% | 0.28% |
Source: room stock = MetroEngines Research, compiled by HotelBank Editorial Team / reviews = HotelBank Editorial Team (N=16,680 properties, 6,934,690 reviews, October 2024 – September 2026; mention rates cover each whole category regardless of room count)
Splitting by category makes the relationship between supply and interest clear. Within stock with 50+ rooms, the current-standard room share is 18.1% for resort hotels, 17.0% for business hotels and 14.5% for city hotels — all in the mid-to-high teens — while ryokan stand at just 4.2%. Only 31 of the 787 ryokan with 50+ rooms opened in or after April 2021; most large ryokan are buildings that were already operating before the standard changed.
Guest reviews, by contrast, reverse the order. Of the 6,934,690 guest reviews tallied by HotelBank Editorial Team (16,680 properties, October 2024 – September 2026), 15,523, or 0.22%, mention in-property accessibility such as steps, wheelchairs or elevators. By category, ryokan are highest at 0.47%, followed by resort hotels at 0.36%, city and deluxe hotels at 0.18%, and business hotels at 0.12% — ryokan run 3.8 times higher than business hotels. Reviews mentioning trips with elderly parents or grandparents follow the same order, with ryokan at 1.12%, 18 times business hotels’ 0.06%.
Source: room stock = MetroEngines Research, compiled by HotelBank Editorial Team / reviews = HotelBank Editorial Team (N=16,680 properties, 6,934,690 reviews)
What emerges is that the categories where interest in accessibility is discussed most intensively are not the ones where new-standard stock is piling up. Differences in clientele are the likely reason. Ryokan and resort hotels see much use by three-generation families and senior couples, for whom ease of moving around and bathing tends to determine satisfaction with a stay. The way Japanese ryokan are built — tatami floors, raised entrance steps, the route to the large communal bath — also tends to generate mentions. How accessibility is described in reviews is covered in detail in our article on finding step-free stays through reviews, so here we limit ourselves to confirming the gap between categories. For ryokan, adding even one accessible room during a renovation looks likely to become a point of differentiation that speaks directly to a clientele with strong interest.
By prefecture — Kyoto 26.4%, Osaka 24.3%, median 14.4%
By prefecture, the current-standard room share is highest in Kyoto at 26.4%, followed by Osaka at 24.3%, Saitama at 22.4%, and Kumamoto and Ishikawa at 22.1% each. All of these saw a run of hotel openings from the 2020s onward, and including the transition band Kyoto and Osaka reach 40.5% and 36.4% respectively. The median across the 47 prefectures is 14.4%, and the bottom of the table includes Shiga at 2.2%, Kochi at 6.9%, Yamagata at 7.3%, Shizuoka at 7.4% and Aomori at 7.5%. In prefectures with few properties a handful of openings can move the ratio substantially, so the figures should be read alongside property counts.
Source: MetroEngines Research; compiled by HotelBank Editorial Team (7,704 properties with 50+ rooms and a known opening month; room basis)
Source: MetroEngines Research; compiled by HotelBank Editorial Team. Circles are placed at each prefectural capital; size shows rooms at properties with 50+ rooms opened in or after April 2021, and colour shows the four segments defined in the next section
On the map, current-standard rooms cluster in the large circles of Osaka (27,505 rooms), Tokyo (24,745), Hokkaido (13,001) and Kyoto (12,479). These four alone account for 41.6% of the national total of 187,041 rooms. Tokyo has many rooms in absolute terms, but its thick existing stock puts its share at 13.7%, just below the median. The overall picture is that new stock is concentrated in cities and major inbound destinations, while prefectures with many hot-spring resorts are still at the stage of building it up.
Overlaying review interest — 16 prefectures where mentions are high and new stock is still to come
Next, as a pointer to the demand side, we tallied the review mention rate by prefecture and set it against the current-standard room share. The mention rate is highest in Saga at 0.43%, followed by Gunma at 0.40%, Shimane at 0.39%, and Yamaguchi and Wakayama at 0.38% — prefectures where hot-spring resorts and ryokan carry the most weight. Osaka and Tokyo, by contrast, are low at 0.13% and Kyoto at 0.14%, suggesting the topic rarely comes up at urban hotels where flat floors are taken for granted. The median across the 47 prefectures is 0.27%. The correlation coefficient between the two metrics is −0.35, a mild inverse correlation: prefectures with stronger review interest tend to have a smaller share of new stock.
Source: room stock = MetroEngines Research, compiled by HotelBank Editorial Team / reviews = HotelBank Editorial Team (47 prefectures; dashed lines show each metric’s median)
Dividing at each median into four segments, 16 prefectures fall into the “most headroom” segment, where the mention rate is at or above the median and the current-standard share is below it: Saga, Gunma, Shimane, Yamanashi, Shizuoka, Mie, Yamagata, Nagano, Akita, Niigata, Fukushima, Hyogo, Nagasaki, Oita, Shiga and Ibaraki. These 16 prefectures have 2,130 properties and 258,663 rooms with 50+ rooms, of which 25,496 rooms (10.2% of rooms with a known opening month) are current-standard stock — below the national 15.8%. Notably, the segment includes many staple destinations for seniors and three-generation trips: Shizuoka with Izu and Atami, Gunma with Kusatsu and Ikaho, Hyogo with Arima and Kinosaki, and Oita with Beppu and Yufuin.
| Segment | Condition | Prefectures | Properties (50+ rooms) | Rooms (same) | Current-standard room share | Accessibility mention rate |
|---|---|---|---|---|---|---|
| ● Most headroom | Mention rate ≥ median × new-stock share < median | 16 | 2,130 | 258,663 | 10.2% | 0.33% |
| ● Demand meets new stock | Mention rate ≥ median × new-stock share ≥ median | 8 | 784 | 96,700 | 17.2% | 0.32% |
| ● Still building up | Mention rate < median × new-stock share < median | 7 | 1,946 | 333,294 | 12.9% | 0.17% |
| ● New stock ahead | Mention rate < median × new-stock share ≥ median | 16 | 3,209 | 526,110 | 20.1% | 0.18% |
Source: room stock = MetroEngines Research, compiled by HotelBank Editorial Team (47 prefectures, N=8,069 properties) / reviews = HotelBank Editorial Team (N=16,680 properties, 6,934,690 reviews, October 2024 – September 2026). Segment boundaries are the medians across the 47 prefectures (current-standard room share 14.4%, mention rate 0.27%)
These segments are not a ranking but a map of where the headroom lies. In “most headroom” prefectures, simply building one or two accessible rooms into existing large ryokan and resort hotels during room renovations would visibly widen the choice for a clientele with strong interest. In the eight “demand meets new stock” prefectures (Yamaguchi, Wakayama, Fukui, Tochigi, Tottori, Kagoshima, Iwate and Gifu), recent openings overlap with high-interest markets, making it easier to promote new properties’ accessible rooms as the region’s overall capacity to welcome these guests. The 16 “new stock ahead” prefectures are mainly urban, where facilities have already begun to build depth, so how accessible rooms are presented along the booking path is likely to be the next step.
| Prefecture | Properties (50+ rooms) | Rooms (same) | Current-standard properties | Rooms (same) | Room share | Share incl. transition band | Est. rooms | Review mention rate | Segment |
|---|---|---|---|---|---|---|---|---|---|
| Kyoto | 309 | 47,873 | 87 | 12,479 | 26.4% | 40.5% | 168 rooms | 0.14% | ● New stock ahead |
| Osaka | 572 | 115,199 | 130 | 27,505 | 24.3% | 36.4% | 334 rooms | 0.13% | ● New stock ahead |
| Saitama | 126 | 16,796 | 19 | 3,616 | 22.4% | 36.2% | 44 rooms | 0.23% | ● New stock ahead |
| Kumamoto | 133 | 17,396 | 23 | 3,777 | 22.1% | 27.8% | 48 rooms | 0.25% | ● New stock ahead |
| Ishikawa | 122 | 17,838 | 24 | 3,728 | 22.1% | 33.2% | 51 rooms | 0.23% | ● New stock ahead |
| Ehime | 102 | 13,206 | 18 | 2,800 | 21.6% | 29.0% | 38 rooms | 0.21% | ● New stock ahead |
| Fukui | 58 | 7,204 | 10 | 1,493 | 21.4% | 23.0% | 19 rooms | 0.36% | ● Demand meets new stock |
| Okinawa | 284 | 45,247 | 60 | 9,553 | 21.3% | 30.2% | 127 rooms | 0.15% | ● New stock ahead |
| Hiroshima | 158 | 24,215 | 27 | 4,853 | 20.7% | 30.1% | 60 rooms | 0.18% | ● New stock ahead |
| Yamaguchi | 95 | 11,875 | 13 | 1,831 | 20.1% | 25.8% | 24 rooms | 0.38% | ● Demand meets new stock |
| Kagawa | 78 | 10,449 | 15 | 2,014 | 19.4% | 23.5% | 25 rooms | 0.26% | ● New stock ahead |
| Gifu | 113 | 13,689 | 20 | 2,528 | 19.2% | 26.3% | 35 rooms | 0.27% | ● Demand meets new stock |
| Nara | 37 | 5,361 | 6 | 991 | 18.7% | 34.0% | 13 rooms | 0.21% | ● New stock ahead |
| Kagoshima | 141 | 17,152 | 20 | 2,743 | 16.9% | 19.9% | 36 rooms | 0.29% | ● Demand meets new stock |
| Okayama | 104 | 14,193 | 15 | 2,347 | 16.8% | 25.2% | 29 rooms | 0.20% | ● New stock ahead |
| Tottori | 52 | 6,627 | 6 | 1,078 | 16.3% | 20.8% | 15 rooms | 0.32% | ● Demand meets new stock |
| Tochigi | 147 | 17,964 | 22 | 2,616 | 16.1% | 21.1% | 35 rooms | 0.35% | ● Demand meets new stock |
| Chiba | 217 | 45,144 | 32 | 7,002 | 16.1% | 23.6% | 85 rooms | 0.23% | ● New stock ahead |
| Toyama | 74 | 10,904 | 11 | 1,705 | 15.7% | 21.4% | 22 rooms | 0.22% | ● New stock ahead |
| Hokkaido | 533 | 84,897 | 79 | 13,001 | 15.7% | 22.2% | 170 rooms | 0.20% | ● New stock ahead |
| Fukuoka | 318 | 52,708 | 49 | 7,688 | 14.9% | 24.5% | 100 rooms | 0.15% | ● New stock ahead |
| Wakayama | 67 | 8,056 | 8 | 1,194 | 14.8% | 16.3% | 15 rooms | 0.38% | ● Demand meets new stock |
| Iwate | 111 | 14,133 | 12 | 1,937 | 14.6% | 16.8% | 26 rooms | 0.28% | ● Demand meets new stock |
| Tokushima | 42 | 4,684 | 5 | 637 | 14.4% | 20.3% | 9 rooms | 0.21% | ● New stock ahead |
| Shimane | 53 | 6,751 | 6 | 952 | 14.4% | 22.3% | 11 rooms | 0.39% | ● Most headroom |
| Kanagawa | 262 | 43,414 | 33 | 6,077 | 14.3% | 28.8% | 76 rooms | 0.26% | ● Still building up |
| Oita | 103 | 13,164 | 12 | 1,825 | 14.2% | 19.2% | 22 rooms | 0.28% | ● Most headroom |
| Tokyo | 952 | 182,012 | 143 | 24,745 | 13.7% | 24.1% | 307 rooms | 0.13% | ● Still building up |
| Akita | 68 | 8,586 | 9 | 1,108 | 13.5% | 13.5% | 16 rooms | 0.32% | ● Most headroom |
| Nagasaki | 128 | 15,893 | 18 | 1,937 | 12.5% | 19.2% | 26 rooms | 0.29% | ● Most headroom |
| Miyagi | 168 | 24,750 | 21 | 3,000 | 12.4% | 16.3% | 40 rooms | 0.24% | ● Still building up |
| Gunma | 129 | 14,844 | 14 | 1,682 | 12.1% | 12.1% | 21 rooms | 0.40% | ● Most headroom |
| Saga | 43 | 5,230 | 7 | 601 | 12.0% | 13.7% | 9 rooms | 0.43% | ● Most headroom |
| Hyogo | 208 | 29,804 | 23 | 3,445 | 11.9% | 19.2% | 43 rooms | 0.30% | ● Most headroom |
| Aichi | 320 | 53,335 | 36 | 6,198 | 11.8% | 19.3% | 81 rooms | 0.16% | ● Still building up |
| Yamanashi | 97 | 10,381 | 9 | 1,081 | 10.8% | 12.5% | 15 rooms | 0.36% | ● Most headroom |
| Niigata | 145 | 20,682 | 8 | 2,153 | 10.8% | 12.5% | 26 rooms | 0.31% | ● Most headroom |
| Miyazaki | 82 | 10,748 | 9 | 1,080 | 10.4% | 13.2% | 16 rooms | 0.26% | ● Still building up |
| Mie | 137 | 16,028 | 12 | 1,585 | 10.2% | 12.6% | 20 rooms | 0.34% | ● Most headroom |
| Ibaraki | 128 | 15,163 | 10 | 1,442 | 9.7% | 18.3% | 19 rooms | 0.27% | ● Most headroom |
| Nagano | 252 | 26,724 | 18 | 2,423 | 9.6% | 14.3% | 30 rooms | 0.33% | ● Most headroom |
| Fukushima | 174 | 20,774 | 14 | 1,800 | 9.2% | 14.0% | 22 rooms | 0.31% | ● Most headroom |
| Aomori | 103 | 12,516 | 7 | 898 | 7.5% | 11.5% | 13 rooms | 0.15% | ● Still building up |
| Shizuoka | 313 | 37,040 | 22 | 2,646 | 7.4% | 12.5% | 34 rooms | 0.35% | ● Most headroom |
| Yamagata | 80 | 8,782 | 7 | 622 | 7.3% | 9.0% | 9 rooms | 0.34% | ● Most headroom |
| Kochi | 59 | 6,519 | 3 | 431 | 6.9% | 9.9% | 6 rooms | 0.24% | ● Still building up |
| Shiga | 72 | 8,817 | 2 | 194 | 2.2% | 9.0% | 3 rooms | 0.28% | ● Most headroom |
Source: room stock = MetroEngines Research, compiled by HotelBank Editorial Team / reviews = HotelBank Editorial Team (shares are of rooms at properties with a known opening month; estimated rooms apply the 1% rule mechanically to current-standard properties. Shimane displays as 14.4%, level with the median prefecture Tokushima, but its unrounded value is below the median, so it is classed as “most headroom”)
Size of universal tourism demand — 31.8 million person-trips and about ¥2.3 trillion from travelers aged 70+
So far we have looked at supply and review interest — but how large is the demand that accessible rooms can capture? According to the Japan Tourism Agency’s Travel and Tourism Consumption Trend Survey (2025 annual, final figures), Japanese residents made 299.97 million domestic overnight person-trips, of which people in their 60s accounted for 38.27 million, people in their 70s for 23.14 million and those aged 80+ for 8.66 million. Together, travelers aged 70 and over made 31.80 million person-trips, 10.6% of the total, and spent about ¥2.3186 trillion on overnight travel (10.7%). Including people in their 60s raises this to 70.08 million person-trips, 23.4% of all overnight travel.
Source: compiled by HotelBank Editorial Team from Japan Tourism Agency, Travel and Tourism Consumption Trend Survey, 2025 annual (final), Tables 9 and 11 (trips per person = total person-trips ÷ population as of January 1, 2025)
The figure to watch is overnight trips per person by age group. Dividing the survey’s person-trips by population gives 2.58 trips a year for people in their 60s against 1.44 for those in their 70s and 0.67 for those aged 80+ — a sharp drop from the 70s on. People cut back on travel for many reasons, including health and household finances, and hotel facilities alone cannot explain it. Even so, there are 16.07 million people in their 70s — more than in their 60s — so an increase of just 0.1 trips per person would add about 1.61 million person-trips, worth about ¥123 billion at the 70s’ average spend per trip (about ¥76,500). More rooms that ease worries about getting around and bathing are one factor that could encourage this group to take “one more trip.”
This demand also does not travel alone. In the same survey, domestic overnight trips with “family or relatives” total 130.20 million person-trips (43.4%) and with a “spouse or partner” 53.65 million (17.9%), together more than 60%. If one member of the party uses a wheelchair or is unsteady on their feet, the accompanying family will choose the same hotel. Because having or not having one accessible room can decide bookings of several rooms, including the regular room next door, universal tourism is a demand segment to be understood by travel party rather than by room.
| Segment | Size | Notes | Source |
|---|---|---|---|
| Population aged 65+ | 36.24 million (29.6% of total population) | Of which 21.68 million aged 75+ (17.7%). Estimate as of September 15, 2026 | Statistics Bureau, MIC |
| Domestic overnight trips, age 70+ | 31.80M person-trips, about ¥2.3186 trillion | 10.6% of domestic overnight person-trips. 2025 | Japan Tourism Agency |
| Domestic overnight trips, age 60s | 38.27M person-trips, about ¥3.0295 trillion | 2.58 trips per person a year; 1.44 for the 70s | Japan Tourism Agency |
| Overnight trips with family/relatives or spouse | 183.84M person-trips | 61.3% of domestic overnight trips. The base for multi-room bookings including companions | Japan Tourism Agency |
| International visitors aged 60+ | About 2.1 million (rough estimate) | 41.14M general visitors × 5.1% age share. 2025 | Japan Tourism Agency, JNTO |
| People with physical disabilities | 4.23 million | 34 per 1,000 population | Cabinet Office |
Source: compiled by HotelBank Editorial Team from Statistics Bureau of Japan, “Japan’s Elderly as Seen Through Statistics” (September 2026); Japan Tourism Agency, Travel and Tourism Consumption Trend Survey, 2025 annual (final); Japan Tourism Agency, International Visitor Survey, 2025 annual report; Cabinet Office, Annual Report on Persons with Disabilities 2025
The same group exists among international visitors. In the Japan Tourism Agency’s International Visitor Survey 2025 annual report, visitors aged 60+ made up 5.1% of international visitors (all purposes, excluding under-15s). Applying that share to the 41.14 million general visitors — the 42.68 million arrivals in 2025 minus cruise passengers — gives roughly 2.1 million. By nationality and region the share is high for Australia (11.5%), Singapore (9.9%) and the UK (9.3%), so older travelers are concentrated in markets with long stays and high lodging spend. The most common companions are again “family or relatives” at 31.4%, making this, like domestic demand, a segment that moves in groups. These are reference values obtained by multiplying a share by visitor numbers, but they give a sense of scale.
Implications for operators and developers — capturing the headroom beyond the legal obligation
To sum up, current-standard stock that may fall within the 1% rule’s reach accounts for 15.8% of rooms, and most of the rest sits in duty-to-make-efforts territory. Meanwhile review interest is concentrated in ryokan and hot-spring prefectures, and on the demand side travelers aged 70 and over alone make 31.8 million overnight trips a year. It is precisely outside the obligation that voluntary action has the most room to work as a differentiator.
For businesses planning new builds or major extensions, it is worth treating the 1% the standard requires as a floor and designing layouts that also make it easy for companions to book an adjacent or connecting room. MLIT’s Design Standards for Buildings That Consider Smooth Movement of Elderly and Disabled Persons set desirable levels not only for wheelchair-accessible rooms but also for doorway widths and bathroom steps in regular rooms, and are worth consulting at the planning stage. Existing properties can start, in step with room renovations or plumbing upgrades, with measures such as removing doorway steps, adding handrails and changing bathroom doors. The Japan Tourism Agency’s FY2026 budget has also expanded support related to universal tourism.
The other issue is how information is presented. Article 14(6) of the Act requires owners of new Specified Buildings for Special Use to make efforts to provide the information elderly and disabled people need to use them smoothly. Even where accessible rooms exist, if booking sites and official websites do not let guests check doorway width, bed height, bathroom type and the route through the building, bookings that include companions are unlikely to follow. Alongside upgrading facilities, showing room photos and specific dimensions is likely to be the shortest route to connecting existing stock with demand. Current-standard stock accumulates every year; whether its growth can be made visible as a region’s capacity to welcome these guests looks set to be the dividing line over the next few years.
Frequently Asked Questions
Q. From how many rooms are accessible guest rooms required at a hotel?
A. When a hotel or ryokan with a total floor area of 2,000 m² or more is newly built, extended, rebuilt or converted, and it has 50 or more guest rooms in total, it must provide wheelchair-accessible rooms equal to at least 1% of total rooms (rounded up). The legal basis is Article 16(1) of the Barrier-Free Act Enforcement Order. No number is set for properties with 49 rooms or fewer.
Q. Since when has the 1% rule applied?
A. Since September 1, 2019. It was introduced by the amendment in Cabinet Order No. 298 of 2018 (promulgated October 19, 2018) and applies to construction started on or after the effective date. April 1, 2021 is the effective date of a separate amendment that added public elementary and junior high schools, not of the guest-room standard.
Q. Do existing hotels and ryokan also have to provide 1% accessible rooms?
A. The rule does not apply retroactively to existing buildings. Construction started before the effective date follows the previous standard. However, Article 14(5) of the Act requires owners to make efforts to take the measures needed to comply with the standard. If a property undertakes an extension, rebuild or change of use above the threshold size, the standard in force at that time applies.
Q. How much stock may fall under the current standard?
A. Of the 8,069 properties with 50+ rooms listed on major booking sites, 1,154 properties and 187,041 rooms opened in or after April 2021 — 15.8% of rooms with a known opening month. This is an estimate based on opening dates and does not confirm individual properties’ compliance.
Q. Why does HotelBank’s earlier figure of 12,890 legally required rooms differ from this article’s estimate of 15,825 rooms?
A. Because the population and timing differ. The earlier analysis counted the 6,967 properties and 976,522 rooms with 50+ rooms among properties confirmed as operating on OTAs with a registered room count as of August 2026. This article counts the 8,069 properties and 1,214,767 rooms with 50+ rooms in five categories whose rates were confirmed on major booking sites in the latest 12 months (October 2025 – September 2026). Both are estimates that apply the 1% rule mechanically to each property and are not counts of wheelchair-accessible rooms that actually exist.
Summary
The Barrier-Free Act’s 1% rule covers construction started on or after September 1, 2019, and does not apply retroactively to existing properties. Among the 8,069 properties with 50+ rooms listed on major booking sites, stock opened in or after April 2021 — the cohort likely to have started construction after the rule took effect — totals 1,154 properties and 187,041 rooms, or 15.8% of rooms. By prefecture the share ranges from 26.4% in Kyoto to 2.2% in Shiga, and in the ryokan and hot-spring prefectures where reviews show the strongest interest in accessibility, new stock is still at the build-up stage. Travelers aged 70 and over make 31.8 million domestic overnight person-trips, and the market is wider still once companions are counted. Accessible rooms and clear information about them are best seen not merely as compliance, but as a growth opportunity to capture a demand segment of real scale.
Related Articles
| Step-Free Stays: 25 Hotels Where Accessibility Shows Up in Reviews |
| Japan’s Pre-1981 Hotel Stock: 236k Rooms, 19.1% — Retrofit or Rebuild |
References and Sources
■ Data sources
Room stock = MetroEngines Research (8,069 properties and 1,214,767 rooms with 50+ rooms in five categories, listed on major booking sites with rates confirmed in the latest 12 months [October 2025 – September 2026] and a known room count; 7,704 properties and 1,181,366 rooms have a known opening month; as of October 2026) / reviews = HotelBank Editorial Team (16,680 properties, 6,934,690 reviews, October 2024 – September 2026) / regulations = e-Gov Laws and Regulations Search and MLIT / demand size = published figures from the Japan Tourism Agency, the Statistics Bureau of Japan and the Cabinet Office.
■ Estimation assumptions
The current-standard period is defined as openings in or after April 2021, allowing about one to two years from groundbreaking to opening after the 1% rule’s effective date (September 1, 2019); Table 3 shows sensitivity to moving the cutoff between September 2019 and January 2022. Estimated rooms are the sum of each property’s total rooms × 1/100, rounded up. The four prefecture segments are split at the medians across the 47 prefectures (current-standard room share 14.4%, review mention rate 0.27%). Trips per person = total person-trips ÷ population as of January 1, 2025; international visitors aged 60+ is a rough estimate of 41.14 million general visitors × 5.1% age share.
■ Limitations
Construction-start timing is estimated from opening months; individual properties’ construction-start dates, the 2,000 m² floor-area requirement and the actual provision of wheelchair-accessible rooms were not checked. Properties not listed on booking sites and those with 49 rooms or fewer are excluded. Because HotelBank’s earlier legally-required-rooms analysis uses a different population and timing, property counts and estimated rooms do not match it. The review mention rate measures how often the topic comes up and does not indicate whether facilities exist or how they are rated. 2026 openings are limited to listings confirmed up to the survey date (early October 2026).