

Japan’s 2026 year-end and New Year holiday runs six consecutive days, from Tuesday, December 29, 2026 to Sunday, January 3, 2027. Only one weekday sits in front of it — Monday, December 28 — so anyone who takes that day off gets a nine-day break starting Saturday, December 26. Bookings typically get going in earnest from late September into October, which means the deadline for pricing and plan design is already here.
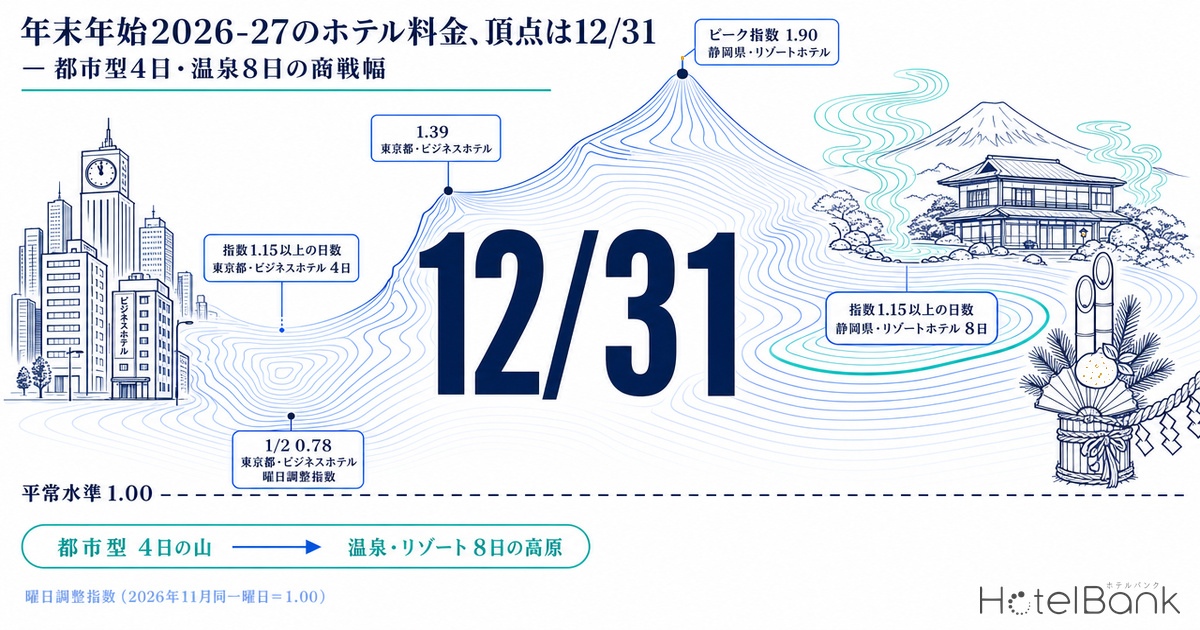
In this article we use MetroEngines Research data to examine room rates for this year-end/New Year period by area and property type across Japan. The short version: the peak rate falls on December 31 for city hotels and for onsen/resort properties alike. What differs is not the height of the peak but the width of the peak. For Tokyo business hotels, the peak lasts four days, December 28–31, and by January 2 rates drop into a trough more than 20% below normal. Shizuoka ryokan and resort hotels, by contrast, hold a plateau at least 15% above normal for eight days, December 27 through January 3, and stay above normal-month levels into mid-January. The period everyone calls the “year-end/New Year selling season” is nearly twice as long for some property types as for others.
Metric Definitions Used in This Article
- ADR (average daily rate): an estimated settled rate (tax-excluded equivalent), calculated by applying a property-type correction factor to the cheapest-plan level each property publishes on OTAs and similar channels (per room, two guests per room, tax included). Checked against property-level results disclosed by listed hotel REITs (91 properties, most recent three months), the median error is about 7%. These are estimates and differ from each property’s actual settled prices and accounting figures. Area-level ADR is the median of the properties covered (the level of a typical property in the area).
- Listed price: the average price of all plans listed on OTAs and similar channels (per room, two guests per room, tax included; covers everything from room-only to meal-inclusive plans). It is a separate metric from estimated settled ADR, and this article uses it only for day-by-day comparisons.
- Day-of-week adjusted index: each year-end/New Year day’s listed price divided by the average listed price for the same weekday over November 9–22, 2026. 1.00 = the normal level for that weekday. The index removes the ordinary Saturday/Sunday weekend effect so that only the holiday premium remains.
- Data source: MetroEngines Research
- — The peak falls on December 31 for city and onsen properties alike. The day-of-week adjusted index (same weekday in November 2026 = 1.00) reaches 1.39 for Tokyo business hotels and 1.90 for Shizuoka resort hotels.
- — The length of the selling season nearly doubles depending on property type. Days more than 15% above normal: four for Tokyo business hotels, eight for Shizuoka ryokan and resort hotels.
- — Monthly ADR hides the peak. With the October–November 2026 average set at 1.00, business hotels come in at x0.96 for December and x0.91 for January — below normal months (prefecture median).
- — Onsen towns don’t all peak on the same day. Atami, Karuizawa and Kusatsu peak on December 31, Hakone and Yugawara on January 1, and Beppu on December 29.
- — Supply barely moves. The 4,124 rooms that opened in December 2025 (a fully observed month) equal just 0.33% of the 1,266,938 rooms confirmed as operating.
Monthly ADR doesn’t show that year-end/New Year is expensive
We start with monthly estimated settled ADR — and immediately hit the first trap. Compare monthly ADR for December 2026 and January 2027 with the average of the most recent normal months, October and November 2026, and both business hotels and city hotels come in below normal months.
Taking the median of multiples calculated by prefecture and property type, business hotels come in at x0.96 for December and x0.91 for January, and city hotels at x0.93 and x0.90. Resort hotels, by contrast, are clearly higher at x1.05 and x1.10, and ryokan at x1.08 and x1.11. Running the same calculation across all 47 prefectures gives January multiples of x0.93 for business hotels and x0.89 for city hotels against x1.05 for resort hotels and x1.12 for ryokan — the same pattern, with city properties below 1.00 and onsen/resort properties above it. For city properties, December and January are not “expensive months” when viewed as monthly averages; if anything, they look like months that have fallen off from the autumn peak season.
Source: MetroEngines Research; compiled by HotelBank Editorial Team
The reason is clear. Year-end/New Year demand lasts effectively six or seven days, from December 28 to January 3. The remaining 24 days of December and the remaining 24 days of January are when business demand in cities is at its weakest. A monthly average dilutes that short, tall peak with long, low troughs. If you set prices by looking only at monthly budgets and reports, the year-end/New Year window is structurally invisible.
Change the baseline and the picture changes too. With the January–November 2026 average set at 1.00, December estimated settled ADR is above the annual average almost everywhere: 1.21x in Beppu, 1.17x in Tochigi and Tokyo, and 1.16x in Hyogo, Hokkaido, Fukuoka and Aichi. Across all 47 prefectures, Okinawa (0.97x) is the only one where December falls below the annual average, and the biggest premiums are in regional prefectures such as Kagoshima (1.31x) and Fukushima and Tokushima (1.30x each). In other words, city properties only looked “below normal” because the baseline was the autumn peak of October and November. Given the seasonal pattern in which Tokyo’s listed prices hit their annual high in November, the conclusion flips depending on which baseline you choose.
December and January rates in major areas — the premium over the annual average
Here are the levels by area. The table below shows estimated settled ADR for prefectures and major onsen towns, along with the multiple of the January–November 2026 average. For reference, it also shows the listed price for the same month (all-plan average, tax included). The gap between estimated settled ADR and listed price comes from unsold high-priced plans staying on the listings and from the share of meal-inclusive plans.
| Area | Dec est. settled ADR | Jan est. settled ADR | Dec / annual avg | Jan / annual avg | Dec listed price | N (Dec) |
|---|---|---|---|---|---|---|
| Hakone | ¥29,400 | ¥29,300 | 1.10 | 1.10 | ¥65,900 | 162 |
| Atami | ¥26,500 | ¥26,800 | 1.12 | 1.13 | ¥61,900 | 97 |
| Yufu | ¥26,800 | ¥26,600 | 1.15 | 1.14 | ¥53,900 | 130 |
| Karuizawa | ¥24,100 | ¥24,200 | 0.99 | 1.00 | ¥62,000 | 48 |
| Yugawara | ¥22,700 | ¥21,300 | 1.14 | 1.07 | ¥49,400 | 50 |
| Kusatsu | ¥19,700 | ¥20,300 | 1.14 | 1.18 | ¥47,600 | 62 |
| Beppu | ¥18,800 | ¥18,800 | 1.21 | 1.21 | ¥39,700 | 115 |
| Tokyo | ¥17,500 | ¥13,800 | 1.17 | 0.92 | ¥31,200 | 1,034 |
| Kyoto | ¥17,300 | ¥13,700 | 1.04 | 0.82 | ¥39,100 | 540 |
| Oita | ¥16,900 | ¥17,200 | 1.14 | 1.16 | ¥40,400 | 410 |
| Hyogo | ¥15,700 | ¥16,100 | 1.16 | 1.19 | ¥45,200 | 475 |
| Shizuoka | ¥15,300 | ¥15,200 | 1.14 | 1.13 | ¥37,800 | 756 |
| Nagano | ¥14,300 | ¥14,500 | 1.15 | 1.17 | ¥32,500 | 646 |
| Hokkaido | ¥12,500 | ¥13,100 | 1.16 | 1.21 | ¥29,800 | 795 |
| Okinawa | ¥11,900 | ¥11,600 | 0.97 | 0.94 | ¥28,400 | 497 |
| Osaka | ¥10,800 | ¥10,300 | 1.12 | 1.07 | ¥18,600 | 618 |
N is the number of properties used to calculate estimated settled ADR. The annual average is the simple average of estimated settled ADR for January–November 2026. Source: MetroEngines Research; compiled by HotelBank Editorial Team
January comes in below the annual average in Tokyo and Kyoto (0.92x and 0.82x), while in Hokkaido January is even higher than December (1.21x). Six days of year-end/New Year demand can’t explain that gap. In Hokkaido’s case, all of January falls within the ski-season peak. In fact, the daily index discussed below shows Hokkaido more than 15% above normal on 16 of the 26 days from mid-December to mid-January — not a year-end/New Year peak but a plateau spanning the whole winter season.
Ski resorts such as Hakuba and Kutchan carry premiums of a completely different order: Kutchan’s estimated settled ADR for January reaches ¥58,200 (3.7x normal months). However, only 21 and 16 properties respectively feed the estimated settled ADR in these areas, and because only properties open in winter remain, the sample itself changes with the season. We treat them as reference figures rather than as points of comparison for rate levels.
Day by day, the peak starts on December 28 and tops out on December 31
Now to the core of the analysis: using daily data to pull out the peak that monthly averages hide. Lining up daily year-end/New Year prices as they are mixes in the ordinary weekend effect, so we compared a day-of-week adjusted index — each day’s listed price divided by the average for the same weekday over November 9–22, 2026. 1.00 corresponds to the normal level for that weekday.
N = 856+ Tokyo business hotels, 102+ Tokyo city hotels, 205+ Shizuoka ryokan, 102+ Shizuoka resort hotels (each day). Source: MetroEngines Research; compiled by HotelBank Editorial Team
All four series share two movements. The first is the step up from December 27 to December 28. Tokyo business hotels go from 1.04 to 1.24 and Shizuoka resort hotels from 1.21 to 1.47 — in every series this single day brings the biggest jump. December 28 is officially a weekday, but it is the first day off for people taking the nine-day break, and the market prices it as the start of the year-end/New Year block.
The second is that December 31 is the peak for every property type: 1.39 for Tokyo business hotels, 1.18 for Tokyo city hotels, 1.71 for Shizuoka ryokan and 1.90 for Shizuoka resort hotels. You sometimes hear that city rates soften at year-end and peak in early January, but at least on current listed prices, New Year’s Eve is the most expensive day in cities and onsen towns alike.
The width of the selling season nearly doubles by property type — 4 days for city properties, 8 for onsen
Because the peaks line up, the difference shows in the foothills. Count the days from December 26 onward on which the day-of-week adjusted index is 1.15 or higher — that is, at least 15% above normal — and the length of each property type’s selling season comes straight out.
| Series | Peak day | Peak index | Jan 2 | Jan 3 | Jan 4–12 avg | Days with index ≥1.15 |
|---|---|---|---|---|---|---|
| Shizuoka – Resort hotels | 12/31 | 1.90 | 1.36 | 1.26 | 1.05 | 8 days |
| Shizuoka – Ryokan | 12/31 | 1.71 | 1.33 | 1.22 | 1.10 | 8 days |
| Shizuoka – Business hotels | 12/31 | 1.39 | 0.90 | 0.92 | 0.93 | 5 days |
| Tokyo – Business hotels | 12/31 | 1.39 | 0.78 | 0.76 | 0.78 | 4 days |
| Tokyo – City hotels | 12/31 | 1.18 | 0.92 | 0.82 | 0.81 | 1 day |
The index is the ratio to the average listed price for the same weekday over November 9–22, 2026 (= 1.00). Day counts are out of the 26 days from December 18 to January 12. Source: MetroEngines Research; compiled by HotelBank Editorial Team
Tokyo business hotels drop 44% in just two days, from 1.39 on December 31 to 0.78 on January 2 — and they don’t recover. The January 4–12 average is 0.78, and rates stay at the lowest level of the whole observation period (December 18 to January 12). The year-end/New Year window is effectively four days long, with troughs on either side. A short window also means how those four days are designed goes a long way toward determining how December and January finish.
Shizuoka ryokan and resort hotels, by contrast, stay at 1.15 or above for eight straight days. They hold 1.33–1.36 on January 2 and 1.22–1.26 on January 3, and their average from January 4 onward is still 1.05–1.10, above normal months. Business hotels in the same prefecture end after five days and fall to 0.93 in January, so this reads as a difference of property type, not of area. Property types where the stay itself — overnight with dinner and breakfast — is the purpose of the trip treat the second half of the holiday differently from property types where guests stay as a side effect of some other purpose.
This structure is also consistent with differences in the demand mix: the share of foreign guests differs sharply by facility type, at 12.9% for ryokan versus 47.2% for city hotels. Year-end/New Year is a period led by domestic demand — trips home and family travel — and the better a property type can capture that demand, the wider its peak.
Onsen towns don’t peak on the same day either — Hakone on New Year’s Day, Atami on New Year’s Eve
Nor can onsen towns be lumped together as “peaking at the end of December.” Lining up daily indices for six major onsen towns shows the peak date varying by area.
N = 195+ properties in Hakone, 143+ in Atami, 169+ in Beppu, 92+ in Karuizawa, 68+ in Kusatsu, 44+ in Yugawara (each day). Source: MetroEngines Research; compiled by HotelBank Editorial Team
| Onsen town | Peak day | Peak index | 12/28 | 12/31 | 1/1 | 1/3 |
|---|---|---|---|---|---|---|
| Atami | 12/31 | 1.89 | 1.51 | 1.89 | 1.71 | 1.08 |
| Karuizawa | 12/31 | 1.82 | 1.38 | 1.82 | 1.54 | 0.99 |
| Kusatsu | 12/31 | 1.60 | 1.47 | 1.60 | 1.55 | 1.14 |
| Yugawara | 1/1 | 1.47 | 1.34 | 1.35 | 1.47 | 1.00 |
| Hakone | 1/1 | 1.37 | 1.30 | 1.31 | 1.37 | 1.05 |
| Beppu | 12/29 | 1.29 | 1.29 | 1.22 | 1.15 | 0.89 |
Source: MetroEngines Research; compiled by HotelBank Editorial Team
Atami, Karuizawa and Kusatsu peak on December 31, with large premiums of 1.60–1.89. By contrast, Hakone, Kanagawa’s flagship onsen town, and neighboring Yugawara peak a day later, on January 1, with relatively moderate premiums of 1.37–1.47. Hakone holds a plateau of 1.22–1.37 from December 28 to January 2, with no concentration of demand on any single day. It sits within about two hours of the Tokyo metropolitan area, and the data suggest it tends to be chosen as “one night somewhere during the holiday” rather than as the place to ring in the New Year.
Beppu peaks even earlier, at 1.29 on December 29, and is back down to 0.89 by January 3. Onsen towns in Kyushu show a smaller and shorter year-end/New Year premium than those in the Kanto and Chubu regions. Just as Kusatsu forms a high price tier within Gunma, demand concentrates differently even among places that all count as “onsen towns.”
The practical implication is clear. In plateau-type areas such as Hakone and Yugawara, designing December 28 through January 2 as a single rate band is unlikely to leave much on the table. But in areas where demand concentrates on one day, such as Atami and Karuizawa, pricing December 31 and January 3 the same leaves revenue opportunities in both directions: the upside on New Year’s Eve isn’t fully captured, and inventory is more likely to go unsold on the 3rd.
Year-over-year comparison — Hokkaido and Aichi up more than 20%, Kansai roughly flat
Judging the level requires a comparison with last year. We set estimated settled ADR for December 2026 and January 2027 against the final figures for the same months a year earlier (December 2025 and January 2026). Note that the bases differ: last year’s side is final results, while this year’s side is estimated from listings at the time of the survey. This year’s figures will move as new plans are added and prices are adjusted.
Year over year. Last year is on a final basis; this year is estimated from listings as of September 2026. Source: MetroEngines Research; compiled by HotelBank Editorial Team
Of the 12 prefectures in the chart, Hokkaido is highest at +32.8% for December and +26.9% for January. Aichi also shows strong growth at +27.1% for December and +27.6% for January, but much of that comes from a low base the previous year (¥9,100 in December 2025); in absolute terms, its December 2026 level of ¥11,500 is the second lowest of the 12 prefectures in the chart after Osaka (¥10,800). Widening the view to all 47 prefectures, regional prefectures whose previous-December level was low, around ¥7,000, line up with growth of around +40%, such as Tokushima (+43.4% for December) and Toyama (+43.2%). Large growth rates need to be read together with how low the previous year’s level was. Tokyo is up a steady +10.5% for December and +4.2% for January, and Fukuoka +11.4% and +8.0%.
Meanwhile, Osaka (−2.8% for December), Kyoto (−3.3%), Oita (−2.2%) and Shizuoka (−1.6%) are slightly below last year for December. In January, however, all of them are back above last year or roughly flat. The December decline in the two Kansai prefectures could reflect either current listings not yet having built up to last year’s level or last December’s level itself having been high. It is worth watching how things move from October onward, when listings fill out.
Supply — the rooms available for the peak are already set
With a demand peak this short, how much room does the supply side have to move? We check the data on new openings.
Source: MetroEngines Research & Consulting (based on confirmed OTA listings)
There is an important caveat in reading this chart. The bars from September 2026 onward are suddenly low not because supply is falling. OTA listings for new properties start appearing a few months before opening, and many properties are listed only after they open, so the latest and upcoming months are structurally undercounted. In 2025, which is fully observed, there were 114 openings in November and 168 in December, with monthly counts ranging from 100 to 250 throughout the year. The figures of 11 for November 2026 and 16 for December 2026 are what has been observed so far and will rise as more listings appear.
With that in mind, looking at the depth of supply in rooms gives a different picture. Of the 168 properties that opened in December 2025 (a fully observed month), 71 were vacation rentals with 95 rooms, 25 were business hotels with 2,275 rooms, 15 were resort hotels with 949 rooms, 15 were hostels with 221 rooms, and 13 were guesthouses with 197 rooms — 4,124 rooms in total. Vacation rentals make up over 40% of openings by count but only about 2% of rooms.
| Opening month | Properties | Rooms | Per property | Observation status |
|---|---|---|---|---|
| Dec 2025 | 168 | 4,124 rooms | 24.5 rooms | Fully observed |
| Aug 2026 | 133 | 3,486 rooms | 26.2 rooms | Largely observed |
| Sep 2026 | 43 | 2,805 rooms | 65.2 rooms | Partially observed |
| Oct 2026 | 25 | 1,418 rooms | 56.7 rooms | Partially observed |
| Nov 2026 | 11 | 666 rooms | 60.5 rooms | Partially observed |
| Dec 2026 | 16 | 1,550 rooms | 96.9 rooms | Partially observed |
Source: MetroEngines Research & Consulting (based on confirmed OTA listings)
Some perspective helps. Of the properties MetroEngines Research tracks, 27,162 properties with 1,266,938 rooms are confirmed as operating on OTAs. The 4,124 rooms that opened in December 2025 (fully observed) equal 0.33% of that room stock. Even if November and December 2026 openings eventually build up to last year’s level, the nationwide room stock will change by less than 1% ahead of the six-day year-end/New Year period.
Looking further ahead at the pipeline, accommodation facilities (50 rooms or more) being planned or built according to the Ministry of Land, Infrastructure, Transport and Tourism’s Building Construction Statistics number 18 projects with 3,815 rooms for 2027 and 8 projects with 1,428 rooms for 2028. These are based on building confirmation applications, however, and the counts are expected to rise as more applications are filed, so they should be read as the lower bound of the currently confirmed pipeline.
In short, room stock is effectively fixed for the year-end/New Year demand period. What can move is price, plan mix and inventory allocation.
Three points to check in September and October
Let’s turn the data into pricing practice. None of these points is about rejecting your current design; they are checks for drawing additional revenue out of a short window.
First, how many days do you define as year-end/New Year? The official holiday runs six days, December 29 to January 3, but prices start rising on December 28. For Tokyo business hotels, the index jumps 20 points in one day, from 1.04 on December 27 to 1.24 on the 28th. Leaving December 28 at the regular rate means missing the first night of the nine-day-break crowd. Conversely, at resorts and ryokan the index is still 1.22–1.36 on January 2 and 3, so a design that drops back to regular rates early leaves upside on the table.
Second, do you step your prices between the peak and the tail? In Atami, the index is 1.89 on December 31 but 1.08 on January 3 — a 1.75x spread within the same holiday period. In Hakone, it is 1.30 on December 28 and 1.37 on January 1, with little variation across the period. Setting a single rate for the whole period in a concentrated area like the former means losing revenue at both ends: not capturing everything on the peak day, and being too expensive and left unsold on the later days. It is worth checking which type your own property’s daily curve is closer to.
Third, how will you fill the trough after January 4? Tokyo business hotels average an index of 0.78 for January 4–12, the lowest level of the observation period. Hokkaido, meanwhile, holds 1.20 over the same period, and Shizuoka ryokan stay at 1.10. For city business and city hotels, early-to-mid January is a period that dilutes the revenue earned in the four year-end/New Year days. Whether you have separate measures aimed at that trough — multi-night discounts, long-stay plans, or corporate offers built around the post-New Year lull — will change how January finishes.
Right before year-end/New Year there are also separate demand peaks: Christmas (December 24–27) and the bonenkai (year-end party) season. Designing the year-end/New Year block together with the daily Christmas curve — when Tokyo rates run about 29.5% above a normal Friday — and with the room to create high-rate days on December weekdays makes the overall structure of December easier to see.
⚠ Note on ADR for future dates: The estimated settled ADR for December 2026 and January 2027 and the daily listed prices in this article are all estimates based on selling prices published on OTAs and similar channels as of September 2026, and they will change as check-in dates approach. With new plans being added and prices adjusted, current levels will not necessarily be realized as they stand. January 2027 is five months after the survey date, so later months are not covered in this article. The shape of the daily index may also change from October onward, when listings fill out.
Summary
The 2026–27 year-end/New Year holiday runs six consecutive days, December 29 to January 3, or nine days for anyone who takes December 28 off. In monthly estimated settled ADR, city property types come in below the most recent normal months for both December and January, and year-end/New Year demand is buried in the monthly average. But pull the days out individually and remove the day-of-week effect, and a clear structure emerges: prices rise on December 28 and peak on December 31 for every property type.
The difference lies not in the peak but in the tail. Tokyo business hotels have only four days more than 15% above normal, fall to 0.78 by January 2 and stay there into mid-January. By the same measure, Shizuoka ryokan and resort hotels stay elevated for eight days and remain above normal months after January 4. Onsen towns split into types as well: Atami, Karuizawa and Kusatsu concentrate sharply on December 31; Hakone and Yugawara form a gentler plateau peaking on January 1; and Beppu is an early type that peaks on December 29.
On the supply side, the 4,124 rooms that opened in December 2025 (fully observed) are only 0.33% of the nationwide stock of 1,266,938 rooms. The stock barely moves ahead of the demand period. How you fit price and plan mix to a peak that is short and varies in width by property type — that is what the September-to-October design largely decides for the year-end/New Year season.
Related Articles
References and Sources
■ Data sources
Monthly estimated settled ADR and listed prices are from MetroEngines Research’s monthly aggregates by prefecture and municipality (January 2025 to January 2027). The daily day-of-week adjusted index uses the company’s daily aggregates of listed prices (two guests per room, per room, tax included). Periods covered: November 9–22, 2026 and December 18, 2026 to January 12, 2027. New openings are aggregated by opening month based on confirmed OTA listings; planned facilities are accommodation facilities with 50 or more rooms based on the Ministry of Land, Infrastructure, Transport and Tourism’s Building Construction Statistics.
■ Calculation assumptions
The multiple of the annual average was calculated by dividing estimated settled ADR for December 2026 and January 2027 by the simple average of monthly values for January–November 2026. Property-type multiples were calculated by dividing December and January estimated settled ADR by the October–November 2026 average for each prefecture and property type, then taking the median across prefectures. The day-of-week adjusted index is each day’s listed price divided by the average for the same weekday over November 9–22, 2026. Year-over-year comparisons are against final figures for the same months a year earlier (December 2025 and January 2026). Amounts are rounded to the nearest ¥100.
■ Limitations and caveats
Values from December 2026 onward are estimates based on listings as of September 2026 and will change before check-in. The prior-year months are final figures, so the basis differs from this year’s side. The daily index is based on listed prices, not settled prices themselves. Ski resorts such as Hakuba and Kutchan have few properties in the calculation, and the mix of operating properties changes in winter, so they are shown as reference values. New-opening counts for the latest months are understated because of the lead time before listing. The count of properties confirmed as operating (27,162) is the number of properties whose operation could be confirmed on OTAs and does not match the number of properties licensed by the authorities.
■ Market data
- MetroEngines Research — estimated settled ADR (by prefecture and municipality, September 2025 to January 2027), daily aggregates of listed prices (November 9–22, 2026 and December 18, 2026 to January 12, 2027), ADR by property type
- MetroEngines Research & Consulting (based on confirmed OTA listings) — monthly counts of new openings and rooms; 27,162 properties and 1,266,938 rooms confirmed as operating
■ Government statistics and public data
- Ministry of Land, Infrastructure, Transport and Tourism, Building Construction Statistics (建築物動態統計調査) — accommodation facilities being planned or built (pipeline for 2027 onward)
- Act on Holidays of Administrative Organs (year-end/New Year holidays: December 29 to January 3)
■ Reference articles
- Cabinet Office: About National Holidays (国民の祝日について)
- Up to nine consecutive days off at year-end/New Year: Japan’s 2026 national holidays (ReseMom, September 9, 2025)
- Travel trend outlook for 2026 (January–December) (JTB, January 8, 2026)
- Visitor arrivals to Japan (April 2026 estimates) | JNTO (Japan National Tourism Organization)