

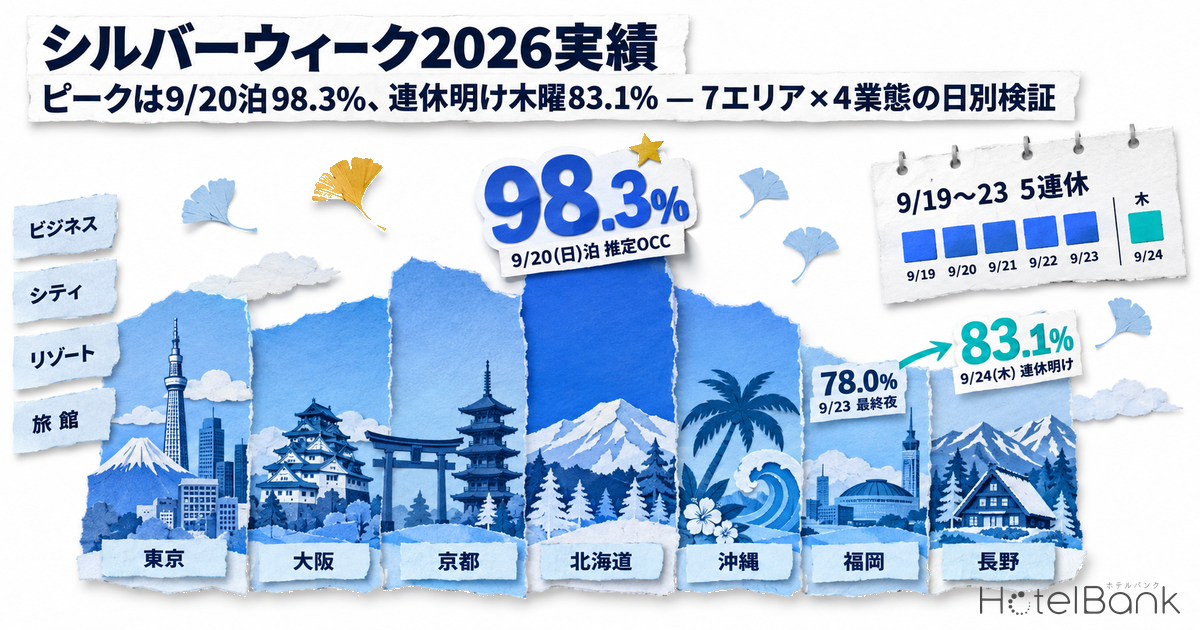
Silver Week 2026 (September 19–23) was Japan’s first five-day autumn holiday in 11 years. Looking back at its hotel inventory with final figures taken after the holiday ended, across seven areas combined — Tokyo, Osaka, Kyoto, Hokkaido, Okinawa, Fukuoka and Nagano — the peak was the night of Sunday, September 20, 2026, at an estimated OCC of 98.3%; the final night, September 23, came in at 78.0%, and Thursday, September 24, the first night after the holiday, at 83.1%. This article uses day-by-day actuals for 7 areas × 4 property types (business, city, resort and ryokan) to classify the shape of the peak, and examines how far the weekdays right after the holiday recovered.
Metric Definitions Used in This Article
| OCC (occupancy rate) | The share of an area’s total rooms that are sold (an estimate based on inventory sold through OTAs). Written as “estimated OCC” in the text. Because it is an estimate based on how OTA-listed inventory sells through, it differs from a property’s actual occupancy rate. Unless otherwise noted, the value as of the day before arrival (LT1) is treated as the “actual”. |
| Population covered | Only properties that list at least 30% of their total rooms on OTAs and similar channels. Across the 7 areas and all property types: 4,916–5,054 properties / approx. 344,000–348,000 rooms (based on listings on major booking sites; varies by stay date). |
| LT (lead time) | Days until the stay date. LT1 = the day before the stay. This article uses observations from LT45 to LT1 only. |
| Listed price | Rate per room for two guests sharing one room (tax included), averaged across all plans. It is the price of inventory on sale at that time, not a settled price. |
| ADR (average daily rate) | An estimated settled rate (tax-excluded equivalent), calculated by applying segment-specific adjustment factors to the lowest-plan level each property publishes on OTAs (two guests per room, per-room rate, tax included). Checked against property-level actuals disclosed by listed hotel REITs (91 properties, latest 3 months), the median error is about 7%. It is an estimate and differs from each property’s actual settled prices and accounting figures. Area-level ADR is the median of the properties covered (the level of a typical property in the area). |
| Data source | MetroEngines Research (as of October 5, 2026) |
- — In all 7 areas the peak was the night of Sunday, September 20 — a “mid-holiday peak”. As of the day before arrival, Osaka had just 30 of 60,377 rooms left and Kyoto 22 of 33,315.
- — Only Tokyo had the first night, September 19, in the lead 30 days out; the middle night overtook it by the day before arrival. In the other 6 areas the third night (September 21) was higher than the first, a “back-leaning” pattern.
- — The trough was not the post-holiday weekday but the final night, September 23 (78.0%). The next night, Thursday, September 24, beat the final night in all 7 areas, recovering to 83.1%.
- — The post-holiday Thursday came in 6.6–8.3 points below the Thursday of the week before the holiday in Tokyo, Osaka and Fukuoka, but Friday beat the prior week in all 7 areas.
- — For the final night and the post-holiday Thursday, just over 10% of inventory moves in the final 14 days. At the next long holiday, these two weeks are the window to go after.
Silver Week 2026 Actuals — All 7 Areas Peaked on the Night of September 20
First, the day-by-day actuals for all property types. The table below lists estimated OCC as of the day before arrival, by area, for the nine nights from the Thursday before the holiday (September 17) to the Friday after it (September 25). Bold marks the highest night within the five-day holiday (stays of September 19–23).
| Area | Properties | 9/17 (Thu) | 9/18 (Fri) | 9/19 (Sat) | 9/20 (Sun) | 9/21 (Mon, hol.) | 9/22 (Tue, hol.) | 9/23 (Wed, hol.) | 9/24 (Thu) | 9/25 (Fri) |
|---|---|---|---|---|---|---|---|---|---|---|
| Tokyo | 865–882 | 90.3% | 87.1% | 96.2% | 97.6% | 94.5% | 92.5% | 80.6% | 83.4% | 88.1% |
| Osaka | 436–450 | 83.0% | 77.0% | 94.2% | 100.0% | 98.4% | 87.6% | 67.9% | 74.7% | 80.7% |
| Kyoto | 779–790 | 84.5% | 83.7% | 95.3% | 99.9% | 99.7% | 92.1% | 79.8% | 87.5% | 89.3% |
| Hokkaido | 793–821 | 90.5% | 84.3% | 94.9% | 97.9% | 97.3% | 92.1% | 80.2% | 86.6% | 87.1% |
| Okinawa | 911–945 | 85.0% | 85.2% | 92.1% | 95.2% | 93.1% | 88.9% | 83.4% | 85.5% | 89.0% |
| Fukuoka | 424–442 | 87.2% | 81.8% | 94.1% | 99.9% | 98.7% | 89.3% | 73.4% | 80.6% | 85.9% |
| Nagano | 708–727 | 87.8% | 84.2% | 98.0% | 99.5% | 99.5% | 96.2% | 82.6% | 89.1% | 88.9% |
| 7-area total | 4,916–5,054 | 87.5% | 83.7% | 95.0% | 98.3% | 96.6% | 91.1% | 78.0% | 83.1% | 86.7% |
Source: Compiled by the HotelBank Editorial Team from MetroEngines Research (properties listing at least 30% of total rooms on OTAs and similar channels, as of the day before arrival; the 7-area total is weighted by room count)
Estimated OCC for the 7 areas combined rose toward the middle of the holiday — 95.0% on the first night (September 19), 98.3% on the second (September 20) and 96.6% on the third (September 21) — then fell in the second half, to 91.1% on the fourth night (September 22) and 78.0% on the final night (September 23). In other words, the second night of the holiday being the summit was common to every area. As of the day before arrival for the night of September 20, only 5,711 of 343,817 rooms remained across the 7 areas.
By area, how tightly the peak night closed varied. For the night of September 20, Osaka had 30 of 60,377 rooms left, Kyoto 22 of 33,315 and Fukuoka 44 of 29,404 — listed inventory was all but sold out. Tokyo, by contrast, reached 97.6% and Okinawa 95.2%, arriving at the stay date with a few percent of inventory still unsold even on the peak night. Note, however, that this metric counts unlisted rooms as sold, so it runs higher than the actual occupancy rate.
Source: Compiled by the HotelBank Editorial Team from MetroEngines Research (7 areas, all property types; estimated OCC as of the day before arrival)
First-Night Peak or Mid-Holiday Peak? — Tokyo Alone Flipped From a First-Night Lead
Next, we identify where in the five days each area’s peak fell. As of the day before arrival, the highest night was September 20 everywhere (Nagano tied with September 21), and no area had a “first-night peak” pattern. Comparing the first night with the third, however, Tokyo splits from the other 6 areas.
| Area | Highest night at 30 days out | Highest night as of day before arrival | First night − third night | Final night − peak night | Pattern |
|---|---|---|---|---|---|
| Tokyo | 9/19 (77.3%) | 9/20 (97.6%) | +1.7pt | -17.0pt | Mid-holiday peak, front-leaning |
| Osaka | 9/20 (73.4%) | 9/20 (100.0%) | -4.2pt | -32.1pt | Mid-holiday peak, back-leaning |
| Kyoto | 9/20 (83.3%) | 9/20 (99.9%) | -4.4pt | -20.1pt | Mid-holiday peak, back-leaning |
| Hokkaido | 9/20 (92.3%) | 9/20 (97.9%) | -2.4pt | -17.7pt | Mid-holiday peak, back-leaning |
| Okinawa | 9/20 (82.4%) | 9/20 (95.2%) | -1.0pt | -11.8pt | Mid-holiday peak, back-leaning |
| Fukuoka | 9/20 (74.9%) | 9/20 (99.9%) | -4.6pt | -26.5pt | Mid-holiday peak, back-leaning |
| Nagano | 9/20 (95.2%) | 9/20 & 9/21 (99.5%) | -1.5pt | -16.9pt | Mid-holiday peak, back-leaning |
Source: Compiled by the HotelBank Editorial Team from MetroEngines Research (all property types, estimated OCC. “First night − third night” is the difference between the nights of September 19 and September 21; “Final night − peak night” is the difference between the night of September 23 and the highest night)
At 30 days out, Tokyo’s first night (September 19) stood at 77.3%, ahead of September 20 at 76.2%. Over the following 30 days the middle night overtook it, and by the day before arrival the order had flipped to September 20 at 97.6% and September 19 at 96.2%. Filling from the first night and having the middle night catch up reads as typical of a big city where Saturday-night demand is already deep. In Osaka, Kyoto and Fukuoka, by contrast, the third night was 4.2–4.6 points higher than the first, suggesting strong movement of travelers who traveled early in the holiday and stayed in the cities mid-holiday.
The drop on the final night also differed. Measured from the peak night, Osaka fell −32.1 points and Fukuoka −26.5 points, while Okinawa had the smallest drop at −11.8 points. Resort destinations with longer stays saw a gentler end to the holiday, while weekend-type cities saw a bigger gap down to the final night.
Curves by Property Type — Ryokan Filled Four Nights; Business Hotels Had Room Left on the Final Night
From here we look at how the shape differs by property type. Across the 7 areas combined, ryokan ended four of the five holiday nights at 96% or higher: 97.6% on September 19, 99.6% on the 20th, 99.1% on the 21st and 96.3% on the 22nd. Resort hotels also held in the 93% range through the night of September 22. Business and city hotels, on the other hand, were in the 90–91% range on September 22 and at 76.5% and 78.5% on the final night, leaving inventory over the last two nights.
Source: Compiled by the HotelBank Editorial Team from MetroEngines Research (7 areas combined, by property type; estimated OCC as of the day before arrival. For the night of September 20 the cohort was 1,664 business / 199 city / 378 resort / 679 ryokan properties)
When rooms filled also differed by type. For the night of September 20, ryokan were at 87.0% 45 days out and reached 98.8% by 14 days out, leaving almost no inventory to move in the final two weeks. Business hotels built up about 30 points, from 68.7% at 45 days out to 98.6% the day before arrival — the same “nearly full” outcome reached by a different path. On the final night, September 23, ryokan also gained 11.8 points in the last 7 days, from 71.1% to 82.9%. For ryokan, the final night was one where bookings bunched up in the last week.
Day-by-day actuals by area × property type are shown in the table below. Bold marks each row’s highest night within the five-day holiday. In most cells the highest night was September 20, but Nagano’s business hotels (99.8%) and resort hotels (99.3%) peaked on September 21, and Tokyo’s city hotels had the first night in the lead at 14 days out (September 19 at 92.7% vs. September 20 at 90.3%).
| Area | Type | Properties (9/20 stay) | 9/17 (Thu) | 9/18 (Fri) | 9/19 (Sat) | 9/20 (Sun) | 9/21 (Mon, hol.) | 9/22 (Tue, hol.) | 9/23 (Wed, hol.) | 9/24 (Thu) | 9/25 (Fri) |
|---|---|---|---|---|---|---|---|---|---|---|---|
| Tokyo | Business | 553 | 90.6 | 86.7 | 96.5 | 98.0 | 94.5 | 92.9 | 81.0 | 83.5 | 87.9 |
| Tokyo | City | 53 | 91.9 | 89.3 | 95.9 | 96.5 | 95.5 | 93.0 | 80.4 | 84.5 | 90.6 |
| Tokyo | Resort | 13 | 81.6 | 86.4 | 93.2 | 98.4 | 94.3 | 91.2 | 80.4 | 83.2 | 86.1 |
| Tokyo | Ryokan | 28 | 89.0 | 92.1 | 98.6 | 97.7 | 96.0 | 96.9 | 90.3 | 86.5 | 92.6 |
| Osaka | Business | 293 | 83.4 | 75.7 | 93.9 | 100.0 | 98.3 | 86.9 | 66.2 | 73.8 | 79.9 |
| Osaka | City | 35 | 81.4 | 83.8 | 94.4 | 100.0 | 98.8 | 91.8 | 74.6 | 78.3 | 85.4 |
| Osaka | Ryokan | 22 | 80.9 | 77.2 | 99.1 | 100.0 | 96.8 | 90.1 | 78.7 | 79.2 | 83.4 |
| Kyoto | Business | 197 | 87.2 | 86.3 | 95.5 | 100.0 | 99.9 | 92.3 | 79.2 | 89.2 | 90.2 |
| Kyoto | City | 36 | 84.4 | 83.6 | 94.3 | 99.8 | 99.8 | 93.9 | 81.6 | 85.8 | 90.7 |
| Kyoto | Ryokan | 119 | 81.6 | 80.4 | 96.0 | 100.0 | 99.8 | 92.9 | 85.0 | 89.7 | 88.8 |
| Hokkaido | Business | 227 | 96.5 | 87.2 | 95.2 | 97.8 | 97.2 | 92.3 | 79.6 | 89.8 | 89.2 |
| Hokkaido | City | 37 | 91.5 | 81.0 | 91.4 | 96.9 | 96.3 | 86.7 | 77.9 | 83.9 | 87.4 |
| Hokkaido | Resort | 92 | 78.9 | 79.7 | 94.6 | 98.1 | 97.8 | 92.8 | 81.8 | 80.9 | 82.9 |
| Hokkaido | Ryokan | 174 | 84.7 | 84.3 | 98.4 | 99.6 | 99.1 | 97.2 | 83.3 | 87.4 | 86.7 |
| Okinawa | Business | 136 | 87.5 | 86.5 | 91.9 | 94.5 | 92.0 | 85.8 | 77.9 | 83.8 | 87.7 |
| Okinawa | Resort | 197 | 84.3 | 85.2 | 92.7 | 96.5 | 95.8 | 92.5 | 88.2 | 87.9 | 90.9 |
| Fukuoka | Business | 176 | 89.3 | 83.0 | 94.1 | 99.9 | 98.7 | 88.5 | 74.6 | 82.4 | 87.4 |
| Fukuoka | City | 23 | 87.1 | 84.7 | 93.1 | 99.8 | 99.1 | 91.2 | 76.1 | 82.0 | 85.6 |
| Fukuoka | Resort | 14 | 79.5 | 68.0 | 94.7 | 99.4 | 99.1 | 99.2 | 59.0 | 69.0 | 75.7 |
| Fukuoka | Ryokan | 56 | 72.8 | 71.2 | 93.2 | 99.6 | 98.9 | 94.9 | 65.8 | 65.9 | 70.2 |
| Nagano | Business | 82 | 93.1 | 87.2 | 99.1 | 99.7 | 99.8 | 95.7 | 79.3 | 91.6 | 92.9 |
| Nagano | City | 15 | 94.5 | 83.9 | 99.7 | 100.0 | 99.9 | 96.4 | 78.7 | 92.2 | 94.9 |
| Nagano | Resort | 62 | 86.2 | 86.2 | 96.1 | 98.7 | 99.3 | 97.8 | 86.9 | 88.9 | 88.7 |
| Nagano | Ryokan | 280 | 83.5 | 80.3 | 97.8 | 99.7 | 99.4 | 97.0 | 84.0 | 86.6 | 84.8 |
| 7-area total | Business | 1,664 | 89.2 | 83.9 | 95.3 | 98.6 | 96.6 | 90.7 | 76.5 | 82.8 | 86.6 |
| 7-area total | City | 199 | 88.8 | 85.5 | 94.4 | 98.0 | 97.2 | 91.6 | 78.5 | 83.4 | 88.7 |
| 7-area total | Resort | 378 | 82.8 | 83.3 | 93.8 | 97.4 | 96.9 | 93.4 | 85.2 | 85.4 | 87.7 |
| 7-area total | Ryokan | 679 | 83.3 | 81.7 | 97.6 | 99.6 | 99.1 | 96.3 | 82.9 | 86.0 | 85.5 |
Source: Compiled by the HotelBank Editorial Team from MetroEngines Research (properties listing at least 30% of total rooms on OTAs and similar channels; estimated OCC as of the day before arrival, %. Area × type combinations with fewer than 10 properties are not shown; rows with fewer than 20 properties are for reference only)
Daily Listed Prices — The Final Night Was 40–60% of the Peak Night; Only Okinawa Held 80%
On the price side, we lined up by day the listed prices of inventory on sale 14 days before the stay date. We use 14 days out because even the peak night still had some inventory left then, which keeps the prices representative. Nights with very little inventory left, and property types with few properties, are shown as “—”.
| Area | Type | 9/17 (Thu) | 9/18 (Fri) | 9/19 (Sat) | 9/20 (Sun) | 9/21 (Mon, hol.) | 9/22 (Tue, hol.) | 9/23 (Wed, hol.) | 9/24 (Thu) | 9/25 (Fri) |
|---|---|---|---|---|---|---|---|---|---|---|
| Tokyo | All types | ¥23,600 | ¥25,400 | ¥47,500 | ¥45,000 | ¥34,400 | ¥27,800 | ¥20,000 | ¥21,100 | ¥25,200 |
| Tokyo | Business | ¥19,400 | ¥20,100 | ¥39,600 | ¥37,200 | ¥27,200 | ¥22,000 | ¥14,800 | ¥16,600 | ¥20,000 |
| Tokyo | City | ¥37,600 | ¥40,100 | ¥63,600 | ¥62,100 | ¥50,600 | ¥40,000 | ¥32,000 | ¥33,600 | ¥39,500 |
| Tokyo | Ryokan | ¥25,300 | ¥27,100 | ¥55,700 | ¥80,400 | ¥65,800 | ¥38,600 | ¥24,500 | ¥23,100 | ¥28,900 |
| Osaka | All types | ¥14,100 | ¥15,100 | ¥30,700 | ¥32,700 | ¥23,600 | ¥18,800 | ¥13,600 | ¥14,100 | ¥16,400 |
| Osaka | Business | ¥10,600 | ¥11,100 | ¥24,400 | ¥26,100 | ¥19,100 | ¥14,700 | ¥9,900 | ¥10,300 | ¥12,000 |
| Osaka | City | ¥18,300 | ¥19,000 | ¥38,500 | ¥47,500 | ¥33,300 | ¥24,000 | ¥17,800 | ¥18,800 | ¥21,700 |
| Osaka | Ryokan | ¥27,800 | ¥27,000 | ¥64,900 | ¥32,200 | ¥21,900 | ¥31,400 | ¥18,700 | ¥25,800 | ¥27,800 |
| Kyoto | All types | ¥25,900 | ¥28,100 | ¥49,300 | ¥63,500 | ¥51,000 | ¥36,200 | ¥28,800 | ¥29,000 | ¥31,400 |
| Kyoto | Business | ¥14,600 | ¥16,800 | ¥34,800 | ¥45,800 | ¥37,100 | ¥22,800 | ¥15,900 | ¥17,700 | ¥20,500 |
| Kyoto | City | ¥22,600 | ¥23,900 | ¥52,100 | — | ¥67,300 | ¥37,500 | ¥23,900 | ¥29,300 | ¥32,500 |
| Kyoto | Ryokan | ¥36,800 | ¥37,300 | ¥62,400 | ¥73,100 | ¥60,900 | ¥50,800 | ¥36,800 | ¥37,500 | ¥38,000 |
| Hokkaido | All types | ¥27,500 | ¥26,700 | ¥42,600 | ¥48,100 | ¥39,200 | ¥30,100 | ¥24,400 | ¥24,200 | ¥25,400 |
| Hokkaido | Business | ¥21,300 | ¥17,700 | ¥30,400 | ¥32,300 | ¥26,100 | ¥17,700 | ¥12,600 | ¥14,600 | ¥17,000 |
| Hokkaido | City | ¥26,100 | ¥22,500 | ¥38,200 | ¥47,100 | ¥35,700 | ¥26,200 | ¥17,900 | ¥19,400 | ¥23,000 |
| Hokkaido | Resort | ¥35,300 | ¥36,400 | ¥58,100 | ¥83,600 | ¥62,400 | ¥46,300 | ¥36,500 | ¥33,700 | ¥35,000 |
| Hokkaido | Ryokan | ¥30,800 | ¥31,800 | ¥55,400 | — | — | ¥38,700 | ¥28,400 | ¥29,700 | ¥29,000 |
| Okinawa | All types | ¥26,600 | ¥29,700 | ¥38,200 | ¥37,200 | ¥36,800 | ¥32,000 | ¥29,600 | ¥28,200 | ¥30,600 |
| Okinawa | Business | ¥12,200 | ¥14,200 | ¥17,900 | ¥17,800 | ¥16,700 | ¥14,500 | ¥12,200 | ¥11,900 | ¥14,700 |
| Okinawa | Resort | ¥37,200 | ¥40,600 | ¥59,600 | ¥67,000 | ¥66,400 | ¥50,500 | ¥43,400 | ¥43,300 | ¥47,700 |
| Fukuoka | All types | ¥18,800 | ¥21,800 | ¥39,100 | ¥42,300 | ¥32,500 | ¥26,600 | ¥17,700 | ¥18,100 | ¥23,600 |
| Fukuoka | Business | ¥14,400 | ¥15,700 | ¥29,900 | ¥32,000 | ¥24,600 | ¥19,100 | ¥11,700 | ¥13,300 | ¥16,700 |
| Fukuoka | City | ¥24,500 | ¥30,800 | ¥53,500 | ¥70,900 | ¥56,600 | ¥35,000 | ¥22,600 | ¥25,300 | ¥31,800 |
| Fukuoka | Ryokan | ¥26,400 | ¥27,900 | ¥43,800 | ¥43,400 | ¥36,900 | ¥37,400 | ¥28,900 | ¥24,800 | ¥29,800 |
| Nagano | All types | ¥26,700 | ¥28,700 | ¥44,000 | — | — | ¥35,200 | ¥28,600 | ¥28,500 | ¥29,900 |
| Nagano | Business | ¥14,400 | ¥15,500 | — | — | — | ¥20,200 | ¥13,300 | ¥15,100 | ¥17,600 |
| Nagano | Resort | ¥40,900 | ¥45,600 | ¥75,800 | — | — | ¥63,100 | ¥47,000 | ¥44,900 | ¥44,600 |
| Nagano | Ryokan | ¥27,700 | ¥30,200 | ¥43,600 | — | ¥35,200 | ¥36,800 | ¥31,000 | ¥29,300 | ¥30,800 |
Source: Compiled by the HotelBank Editorial Team from MetroEngines Research (listed prices of inventory on sale 14 days before the stay date; per room for two guests sharing, tax included, average across all plans, rounded to the nearest ¥100)
Across all property types, Tokyo went from about ¥45,000 on the night of September 20 to about ¥20,000 on the final night (September 23), and Osaka from about ¥32,700 to about ¥13,600 — the final night priced at just over 40% of the peak night. Kyoto (about ¥63,500 to about ¥28,800) and Fukuoka (about ¥42,300 to about ¥17,700) fall within the same ratio. Okinawa, by contrast, went from about ¥37,200 to about ¥29,600, holding close to 80%; as with occupancy, its price swing was small.
What about the post-holiday night of September 24? Tokyo, at about ¥21,100, was roughly 10% below the Thursday of the week before the holiday (about ¥23,600); Osaka, at about ¥14,100, was level with the prior week; and Kyoto, at about ¥29,000, was above the prior week’s roughly ¥25,900. In other words, post-holiday listed prices returned to roughly the same band as the pre-holiday weekdays, suggesting that the gap in occupancy was driven more by how quickly demand returned than by price level.
After the Holiday, September 24–25 — Thursday Down Week-on-Week in Cities, Friday Up in Every Area
Now to the core of this article: the weekdays right after the holiday. The first point to note is that the trough fell on the final night, not after the holiday. Estimated OCC for the night of Thursday, September 24, beat September 23 in all 7 areas, by +7.7 points in Kyoto, +7.2 in Fukuoka, +6.8 in Osaka, +6.5 in Nagano, +6.4 in Hokkaido, +2.8 in Tokyo and +2.1 in Okinawa.
Compared with the same weekdays in the week before the holiday, however, the verdict on the recovery is mixed. The chart below shows the post-holiday Thursday and Friday against the Thursday and Friday of the week before the holiday (stays of September 17 and 18).
Source: Compiled by the HotelBank Editorial Team from MetroEngines Research (all property types; difference in estimated OCC as of the day before arrival. Thursday = night of September 24 − night of September 17; Friday = night of September 25 − night of September 18)
On Thursday, areas where business demand weighs heavily fell short of the prior week: Osaka −8.3 points, Tokyo −6.9, Fukuoka −6.6 and Hokkaido −3.9. Kyoto (+3.0 points), Nagano (+1.3) and Okinawa (+0.5) matched or beat the prior week. By Friday, though, all 7 areas were 1.0–5.6 points above the prior week. It appears that business travel and work did not fully resume by Thursday after the holiday, catching up from Friday into the weekend. Note that week-on-week comparisons also contain one-off event effects, so they are best read as a trend.
By property type, resort hotels had the smallest swing. Across the 7 areas combined they held nearly flat: 85.2% on the final night, 85.4% on Thursday and 87.7% on Friday. Business hotels recovered step by step, from 76.5% on the final night to 82.8% on Thursday and 86.6% on Friday, and city hotels climbed the same staircase at 78.5%, 83.4% and 88.7%. Ryokan came in at 86.0% on Thursday and 85.5% on Friday, the two weekday nights at almost the same height.
The “Final Two Weeks” on the Booking Curve — Where the Final Night and the Post-Holiday Nights Move
So when did inventory for the final night and the post-holiday nights move? We overlaid four booking curves for the 7 areas and all property types combined: the peak night, the final night, the post-holiday Thursday and the Thursday of the week before the holiday.
Source: Compiled by MetroEngines Inc. and the HotelBank Editorial Team (7 areas, all property types combined; estimated OCC from LT45 to LT1. Cohort of 4,926–5,051 properties / approx. 344,000–348,000 rooms, based on listings on major booking sites)
The peak night of September 20 had reached 73.1% at 45 days out and 91.4% at 14 days out, adding 6.9 points in the final 14 days. The final night of September 23, by contrast, was at 54.7% at 45 days out, 66.3% at 14 days out and 78.0% the day before arrival, moving 11.7 points in the final 14 days. The post-holiday night of September 24 was even later, going from 70.1% at 14 days out to 83.1% the day before arrival, a gain of 13.0 points. The earlier a night closes, the less room is left at the end; the later a night moves, the more weight the last two weeks carry.
Comparing with the Thursday of the week before the holiday also shows where the gap opened. At 45 days out, the nights of September 17 and September 24 were almost level at 56.6% and 56.2%. By 14 days out, however, they stood at 72.2% and 70.1%, and by the day before arrival at 87.5% and 83.1%, so most of the gap opened in the final two weeks. By property type, the gain in the final 14 days for the night of September 24 was +14.5 points for business hotels, +11.9 points for ryokan, +7.8 points for resort hotels and +6.9 points for city hotels. The same pattern — the last two nights of a holiday moving in the final two weeks — was also seen in Miyagi’s five-day September holiday when comparing its city and business hotels.
Estimated Settled ADR for September — Six Areas Up Year on Year
The prices so far are listed prices, so we also check September’s estimated settled ADR as a measure closer to settled rates. It is a monthly figure, not one isolated to the five holiday days, but it lets us compare the rate level for September as a whole, including the five-day holiday, with the same month a year earlier.
| Area | Type | Sep 2026 est. settled ADR | Sep 2025 | YoY | N (Sep 2026) |
|---|---|---|---|---|---|
| Tokyo | All types | ¥13,700 | ¥13,400 | +1.9% | 1,139 |
| Tokyo | Business | ¥13,400 | ¥13,100 | +2.2% | 914 |
| Tokyo | City | ¥24,600 | ¥27,500 | -10.3% | 110 |
| Tokyo | Ryokan | ¥11,300 | ¥10,300 | +9.3% | 55 |
| Osaka | All types | ¥9,300 | ¥13,800 | -32.4% | 655 |
| Osaka | Business | ¥8,900 | ¥13,400 | -34.0% | 504 |
| Osaka | City | ¥13,100 | ¥16,700 | -21.8% | 97 |
| Osaka | Ryokan | ¥11,200 | ¥11,400 | -1.5% | 36 |
| Kyoto | All types | ¥14,200 | ¥14,000 | +1.1% | 604 |
| Kyoto | Business | ¥11,700 | ¥12,000 | -2.4% | 327 |
| Kyoto | City | ¥20,200 | ¥23,600 | -14.6% | 61 |
| Kyoto | Ryokan | ¥19,700 | ¥18,600 | +6.1% | 197 |
| Hokkaido | All types | ¥11,500 | ¥11,000 | +4.5% | 960 |
| Hokkaido | Business | ¥10,800 | ¥10,000 | +8.9% | 437 |
| Hokkaido | City | ¥16,500 | ¥16,500 | +0.1% | 75 |
| Hokkaido | Resort | ¥16,200 | ¥16,100 | +0.8% | 147 |
| Hokkaido | Ryokan | ¥9,800 | ¥9,800 | -0.2% | 294 |
| Okinawa | All types | ¥12,000 | ¥10,900 | +10.0% | 515 |
| Okinawa | Business | ¥8,800 | ¥8,100 | +9.4% | 197 |
| Okinawa | Resort | ¥16,800 | ¥15,700 | +7.3% | 282 |
| Fukuoka | All types | ¥11,600 | ¥10,600 | +9.8% | 477 |
| Fukuoka | Business | ¥11,000 | ¥10,000 | +9.9% | 342 |
| Fukuoka | City | ¥18,500 | ¥15,200 | +21.9% | 43 |
| Fukuoka | Ryokan | ¥12,300 | ¥12,900 | -4.9% | 72 |
| Nagano | All types | ¥11,800 | ¥11,400 | +3.7% | 818 |
| Nagano | Business | ¥8,600 | ¥7,700 | +11.6% | 168 |
| Nagano | Resort | ¥16,800 | ¥15,400 | +8.8% | 123 |
| Nagano | Ryokan | ¥13,000 | ¥12,400 | +4.7% | 510 |
Source: Compiled by the HotelBank Editorial Team from MetroEngines Research (estimated settled ADR, tax-excluded equivalent, median of the properties covered, rounded to the nearest ¥100. YoY is calculated from unrounded values. Property types with N below 30 are not shown)
Across all property types, Okinawa was at about ¥12,000 (+10.0% YoY), Fukuoka about ¥11,600 (+9.8%), Hokkaido about ¥11,500 (+4.5%), Nagano about ¥11,800 (+3.7%), Tokyo about ¥13,700 (+1.9%) and Kyoto about ¥14,200 (+1.1%). Osaka was at about ¥9,300, −32.4%, but this includes a rebound from the prior September, when Expo 2025 Osaka, Kansai (April 13–October 13, 2025) was running and rates were elevated. Note also that September 2025 did not have a five-day holiday, so the YoY figures also reflect the difference in how the public holidays fell.
A word on the gap between listed prices and estimated settled ADR. For example, Tokyo’s listed price for the night of September 20 was about ¥45,000 at 14 days out, but that is an average across all plans (tax included) of the inventory still left, and is defined differently from Tokyo’s estimated settled ADR for September as a whole, about ¥13,700 (tax-excluded equivalent, median). The two should not be set side by side and compared; use listed prices to read “day-to-day strength” and estimated settled ADR to read “the month’s rate level”.
How to Sell the Nights After a Long Holiday — Three Takeaways for the Next One
To sum up, this five-day holiday followed a pattern of “concentration on the middle nights, spare capacity on the final night, and a weekday recovery that came on Friday rather than Thursday”. As of the day before arrival, rooms remaining across the 7 areas totaled 76,385 for the final night (September 23), 58,714 for September 24 and 46,281 for September 25. Of the final night’s total, 51,753 rooms were business-hotel inventory. These figures also show the size of the opportunity to go after at the next long holiday.
| Window | Measured this time | Proposal for the next holiday |
|---|---|---|
| Final night | From 66.3% at 14 days out to 78.0% the day before arrival. Ryokan gained +11.8 points in the last 7 days | Combine stay extensions from the middle nights with late checkout the next morning, and concentrate promotion in the final two weeks |
| Post-holiday Thursday | 6.6–8.3 points below the Thursday of the week before the holiday in Tokyo, Osaka and Fukuoka. Business hotels gained +14.5 points in the final 14 days | Rather than just waiting for business travel to return, multi-night stays starting Thursday, aimed at travelers who shift their time off after the holiday, can be effective |
| Post-holiday Friday | 1.0–5.6 points above the Friday of the week before the holiday in all 7 areas | Treat it as a night when demand returns: don’t cut rates early, and consider a design that holds rate across a Thursday–Friday two-night package |
Source: Compiled by MetroEngines Inc. and the HotelBank Editorial Team
First, the final night is decided in the last two weeks. The peak night was already above 90% at 14 days out, but the final night still moved just over 10% from there. Properties that sell out the middle nights early have the most room to offer the same guests “one more night”. Perks targeting the latter nights of a multi-night stay, or a later checkout that takes advantage of the next day being a weekday, are a good fit for this window.
Second, the post-holiday Thursday is a night with plenty of upside for urban business hotels. At 45 days out it was at the same level as the Thursday of the week before the holiday; the gap opened only in the final two weeks. Put the other way, how those two weeks are handled holds the potential to get close to the prior week’s level. Travelers who avoid the crowds by taking time off after the holiday certainly exist, so plans starting on Thursday should be visible from two weeks before the holiday.
Third, Friday stays strong even after a holiday. In all 7 areas it beat the prior week’s Friday, with weekend-bound demand returning cleanly. Rather than moving Friday prices along with Thursday’s to prop up Thursday occupancy, it is more effective to treat Thursday and Friday separately and lift Thursday with a two-night offer. For property types that held in the 85% range even after the holiday, such as resort hotels, weekday multi-night demand already appears to be providing support.
Summary
Looking back at Silver Week 2026 with final figures, the night of September 20 was the peak in all 7 areas, and no area peaked on the first night. Only Tokyo had the first night in the lead at 30 days out, and even there the middle night had overtaken it by the day before arrival. By property type, ryokan and resort hotels stayed high through the fourth night, while business and city hotels left capacity over the last two nights.
Right after the holiday, the trough was the final night, and the following Thursday recovered in every area. In the cities, however, Thursday fell short of the week before the holiday and only Friday exceeded the prior week — a two-step recovery. Both the final night and the post-holiday Thursday are nights where just over 10% of inventory moves in the final 14 days, so using those two weeks deliberately at the next long holiday should translate into revenue opportunity. The “mid-holiday concentration” already visible before the holiday in inventory sell-through across 14 prefectures and property types was borne out by the final figures, and the “upside on the post-holiday Thursday” has now been added as a measured finding.
FAQ
Q. Which night of Silver Week 2026 were hotels fullest?
A. The night of Sunday, September 20. Across the 7 areas of Tokyo, Osaka, Kyoto, Hokkaido, Okinawa, Fukuoka and Nagano combined, estimated OCC as of the day before arrival was 98.3%. It was the highest night in all 7 areas, with Nagano tied with the night of September 21.
Q. Were the weekdays after the holiday quiet?
A. The most inventory was left not after the holiday but on the final night, September 23 (78.0%). The following night, Thursday, September 24, recovered to 83.1%, and Friday, September 25, to 86.7%. Thursday was below the week before the holiday in Tokyo, Osaka and Fukuoka, while Friday was above the week before the holiday in every area.
Q. When is the next five-day Silver Week?
A. It depends on how Respect for the Aged Day and the Autumnal Equinox Day fall. If the provisions of the Public Holidays Act apply as written, the next five-day September holiday is expected in 2032 (September 18–22). The date of the Autumnal Equinox Day is fixed when it is published in the official gazette in February of the preceding year.
Related Articles
| Hokkaido Silver Week: Sep 20 Peaks, Ryokan 96.4%, Only Business Dips (published August 20, 2026) |
| Osaka Sep 2026 Holiday: Demand Peaks First 2 Nights, Sep 23 at 58.0% (published August 18, 2026) |
References and Sources
■ Data source
We aggregated data in which MetroEngines Research observed listed inventory and listed prices on major booking sites daily. Coverage is the 7 areas of Tokyo, Osaka, Kyoto, Hokkaido, Okinawa, Fukuoka and Nagano: 4,916–5,054 properties / approx. 344,000–348,000 rooms that list at least 30% of their total rooms on OTAs and similar channels (varies by stay date). Stay dates are September 17–25, 2026; the observation window runs from 45 days before the stay date to the day before; data as of October 5, 2026.
■ Calculation assumptions
Estimated OCC treats the value as of the day before arrival as the actual; the 7-area totals and property-type totals are weighted by room count. Listed prices are the average across all plans of inventory on sale 14 days before the stay date, for two guests sharing a room, tax included (rounded to the nearest ¥100). Estimated settled ADR is a monthly, tax-excluded-equivalent median of the properties covered, and YoY is calculated from unrounded values. Area × type combinations with fewer than 10 properties are not shown, and those with fewer than 20 are for reference only.
■ Limitations and caveats
Estimated OCC is an estimate based on how OTA-sold inventory sells through; because it counts unlisted rooms as sold, it runs higher than a property’s actual occupancy rate. Listed prices are the prices of inventory on sale at that time, not settled prices. Estimated settled ADR is a monthly figure for September as a whole, not one isolated to the five holiday days. Comparisons with the week before the holiday contain one-off event effects, and YoY comparisons contain differences in how the holidays fell as well as the rebound from Expo 2025 Osaka, Kansai.
■ References
| MetroEngines Research — daily estimated OCC, booking curves and listed prices for 7 areas (4,916–5,054 properties listing at least 30% of total rooms on OTAs and similar channels); estimated settled ADR for September 2026 and September 2025 |
| Cabinet Office, “About National Holidays” (in Japanese) |
| Japan Tourism Agency, “Overnight Travel Statistics Survey” (in Japanese) |
| Japan Association for the 2025 World Exposition (Expo 2025 Osaka, Kansai; April 13–October 13, 2025) |
| “Stations crowded on the last day of the five-day holiday as travelers enjoy Silver Week” (Kumamoto Nichinichi Shimbun, September 23, 2026; in Japanese) |