

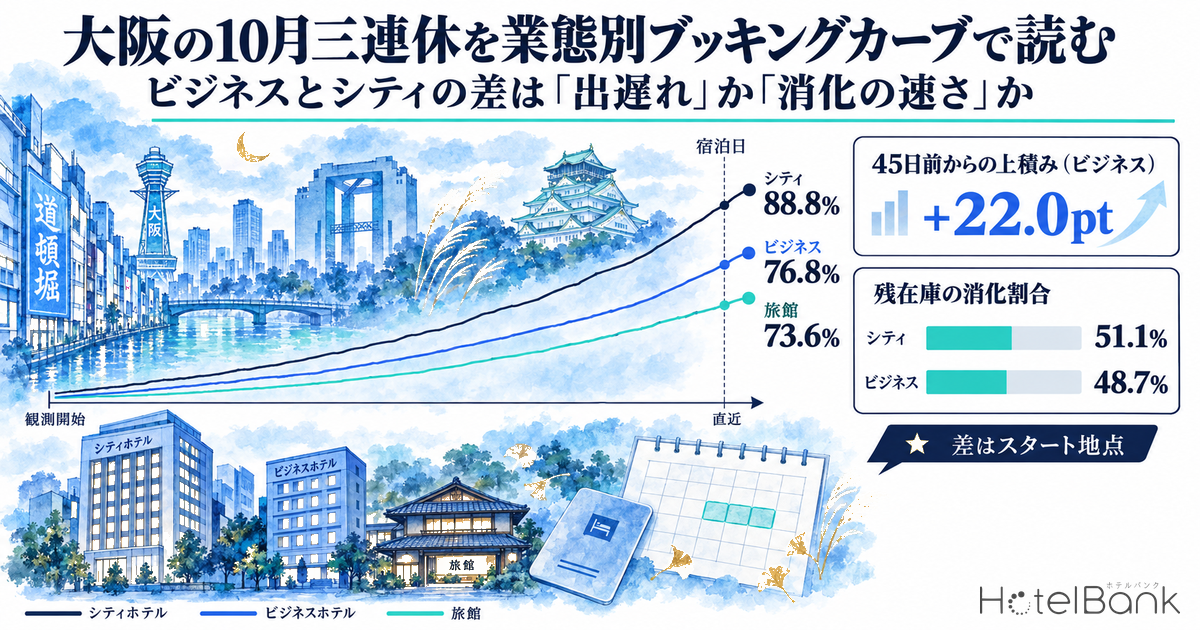
We compared the estimated OCC (based on OTA-listed inventory) by hotel category for Osaka Prefecture’s October three-day weekend (Saturday, October 10 to Monday, October 12, Sports Day), from 45 days before each stay date up to the latest observation (September 24). For the first night, Saturday October 10, city hotels stood at 88.8% (N=38 properties, 8,161 rooms), business hotels at 76.8% (N=297 properties, 48,884 rooms) and ryokan at 73.6% (N=23 properties, 655 rooms). Business hotels posted the largest gain since T-45 at +22.0pt, versus only +11.7pt for city hotels. Even so, the gap to city hotels narrowed only from 22.3pt at T-45 to 12.0pt now. Measured by the share of remaining inventory that has since sold, city hotels (51.1%) and business hotels (48.7%) are nearly level. Most of the gap between categories is explained not by sell-through speed but by “where each category stood at T-45.” Meanwhile, business hotels reach only 57.9% for the final night, Monday October 12 (holiday), the slowest build of the three nights.
Scope: Osaka Prefecture city hotels N=38 properties (8,161 rooms), business hotels N=297 properties (48,884 rooms) and ryokan N=23 properties (655 rooms) (fixed booking-curve cohorts). The price metric in this article is the estimated settled ADR (the settled price level estimated from OTA and other sales data, tax-exclusive equivalent); occupancy is an estimate based on OTA-listed inventory. Both are defined at the end of the article. Data as of: September 25, 2026.
• OCC (occupancy) = rooms sold as a share of total rooms in the area (an estimate based on OTA sales inventory). This article uses a fixed cohort of properties that list at least 30% of their total rooms on OTAs and similar channels.
• ADR (average daily rate) = the settled price level estimated from OTA and other sales data (estimated settled ADR, tax-exclusive equivalent). It is an estimate and differs from each property’s actual settled prices and accounting figures.
• See “About the Data” at the end of the article for full definitions. Source: MetroEngines Research
- — Estimated OCC for the night of Sat 10/10 (observed September 24, 2026, T-16): city 88.8%, business 76.8%, ryokan 73.6%. Business hotels posted the largest gain since T-45 at +22.0pt.
- — Share of T-45 remaining inventory since sold: city 51.1%, business 48.7% — nearly even. Most of the category gap is explained by where each started at T-45.
- — On the final night, Mon 10/12 (holiday), business hotels stand at 57.9% with a sell-through share of just 23.2%, less than half that of the first night. Price and manage inventory for the three nights as separate dates.
- — Compared with a regular Saturday, 10/3, at the same T-16, the long-weekend premium is business +7.7pt, ryokan +7.8pt, city +2.9pt. At T-23, the following Saturday 10/17 was ahead of 10/10 — regular October Saturdays are strong too.
- — On two September Saturdays, more than half of business hotels’ gain over the final 14 days (+13.1 to +20.3pt) came in the last 7 days. For Saturday nights, keep inventory and rate headroom for the final week.
Three Nights × Three Categories at Fixed Checkpoints (T-45, T-30, Latest)
First, we line up the estimated OCC (based on OTA-listed inventory) for the three nights of the long weekend at three checkpoints: T-45, T-30 and the latest observation. The scope is a fixed cohort of properties listing at least 30% of their total rooms on OTAs and similar channels, tracking the same set of properties for each stay date. All latest values are from the September 24 observation, so the days remaining to the stay date differ by one day each: 16 days for 10/10, 17 for 10/11 and 18 for 10/12.
| Category (fixed cohort) | Stay date | T-45 | T-30 | Latest (observed 9/24) | Gain, T-45 → latest | Sell-through of remaining inventory | Sold-out property rate (latest, est.) |
|---|---|---|---|---|---|---|---|
| City (N=38, 8,161 rooms) | 10/10 (Sat) | 77.1% | 84.9% | 88.8% (T-16) | +11.7pt | 51.1% | 13.2% |
| 10/11 (Sun) | 72.6% | 78.4% | 82.2% (T-17) | +9.6pt | 35.0% | 5.3% | |
| 10/12 (Mon, holiday) | 66.6% | 72.6% | 75.1% (T-18) | +8.5pt | 25.4% | 0.0% | |
| Business (N=297, 48,884 rooms) | 10/10 (Sat) | 54.8% | 65.5% | 76.8% (T-16) | +22.0pt | 48.7% | 29.3% |
| 10/11 (Sun) | 51.0% | 59.3% | 68.5% (T-17) | +17.5pt | 35.7% | 6.4% | |
| Business (N=298, 48,919 rooms) | 10/12 (Mon, holiday) | 45.2% | 51.2% | 57.9% (T-18) | +12.7pt | 23.2% | 1.3% |
| Ryokan (N=23, 655 rooms) | 10/10 (Sat) | 57.3% | 65.3% | 73.6% (T-16) | +16.3pt | 38.2% | 34.8% |
| 10/11 (Sun) | 54.5% | 60.6% | 67.2% (T-17) | +12.7pt | 27.9% | 17.4% | |
| 10/12 (Mon, holiday) | 52.1% | 60.6% | 67.8% (T-18) | +15.7pt | 32.8% | 8.7% |
Source: Compiled by the HotelBank Editorial Team from MetroEngines Research data
City and business hotels both follow a “descending” pattern: highest on the first night, 10/10 (Sat), and lowest on the final night, 10/12 (Mon, holiday). The spread is especially wide for business hotels — 76.8% on 10/10 versus 57.9% on 10/12, an 18.9pt gap between the first and last nights. For city hotels it was 13.7pt (88.8% → 75.1%). Ryokan peak on 10/10 at 73.6%, but 10/11 (67.2%) and 10/12 (67.8%) are roughly level, and the final night’s gain of +15.7pt actually exceeded the middle night’s (+12.7pt). Ryokan are the only category where final-night weakness does not stand out.
The sold-out property rate (the estimated share of properties with no listed inventory visible on OTAs and similar channels) also differs. For 10/10, business hotels are at 29.3% — roughly 3 in 10 properties show no listed inventory. City hotels are at 13.2% and ryokan at 34.8% (a share of 23 properties). By contrast, on 10/12 the rate is only 1.3% for business hotels and 0.0% for city hotels; sold-out properties are almost nonexistent. Estimated OCC and the sold-out property rate capture different things: occupancy shows how much of the market’s inventory has been absorbed, while the sold-out rate shows how many individual properties have closed out entirely.
The next chart plots the booking curves of the three categories for the first night, 10/10 (Sat), from T-45 to the latest observation (T-16).
Source: Compiled by the HotelBank Editorial Team from MetroEngines Research data
City hotels started high at 77.1% at T-45, and their growth slowed after passing 84.9% around T-30. Business hotels started from 54.8% and built at an almost steady pace: +10.7pt from T-45 to T-30 and +11.3pt from T-30 to the latest observation. Ryokan fluctuate because the cohort is small (23 properties, 655 rooms), but their overall gain falls between city and business hotels.
Is the Category Gap a “Head Start” or a Difference in Sell-Through Speed?
The estimated OCC gap between city and business hotels for 10/10 narrowed by 10.3pt, from 22.3pt at T-45 to 12.0pt now. Looking only at the point gap, one might conclude that “business hotels are selling faster.” However, business hotels still had 45.2% of their inventory unsold at T-45, versus only 22.9% for city hotels. A category with more remaining inventory naturally finds it easier to add points, so a narrowing point gap cannot be read directly as “faster sell-through.”
So we compare the share of the inventory remaining at T-45 that had sold by the latest observation (sell-through of remaining inventory = gain ÷ inventory remaining at T-45). For 10/10, city hotels are at 51.1% and business hotels at 48.7% — a difference of just 2.4pt. In other words, the category gap on 10/10 is almost entirely the difference in where each stood at T-45; from there, sell-through speed is roughly even between the two. The same holds for 10/11 (city 35.0%, business 35.7%) and 10/12 (city 25.4%, business 23.2%): on each date, the sell-through share barely differs between city and business hotels.
What matters more than the category is the stay date. Business hotels’ sell-through of remaining inventory is 48.7% for 10/10 but only 23.2% for 10/12 — less than half. The final night’s weakness comes from both a lower starting point (45.2% at T-45) and slower sell-through.
Let us also check the size of the long-weekend effect. The table below compares 10/10 with the previous regular Saturday, 10/3, at the same T-16, and with the following Saturday, 10/17, at T-23.
| Category | 10/10 (Sat) at T-16 | 10/3 (Sat) at T-16 | Long-weekend premium (first night) | 10/10 (Sat) at T-23 | 10/17 (Sat) at T-23 |
|---|---|---|---|---|---|
| City (N=38) | 88.8% | 85.9% | +2.9pt | 88.1% | 90.8% |
| Business (N=297) | 76.8% | 69.1% | +7.7pt | 71.9% | 74.2% |
| Ryokan (N=23) | 73.6% | 65.8% | +7.8pt | 67.0% | 67.6% |
Source: Compiled by the HotelBank Editorial Team from MetroEngines Research data
At T-16, the first night of the long weekend (10/10) is +7.7pt ahead of the regular Saturday 10/3 for business hotels and +7.8pt for ryokan, but only +2.9pt for city hotels. City hotels, already at a high level on regular Saturdays, see little extra lift from the long weekend. Business hotels and ryokan, by contrast, appear structurally better positioned to benefit from it.
Meanwhile, at T-23 the following Saturday, 10/17, was ahead of 10/10: 90.8% vs. 88.1% for city hotels and 74.2% vs. 71.9% for business hotels. October in Osaka is not a month in which only the long weekend stands out — regular Saturdays are as strong as, or stronger than, the first night of the long weekend. Designing prices and inventory with only the long weekend in mind risks overlooking opportunities on other Saturdays.
Laying out the three nights by category gives the following picture.
Source: Compiled by the HotelBank Editorial Team from MetroEngines Research data
Business Hotels in the Final Two Weeks — How to Handle Remaining Inventory
At T-16, business hotels still have 23.2% of the cohort’s rooms (11,331 rooms) on sale on OTAs and similar channels for 10/10 (Sat). For 10/12 (Mon, holiday), 42.1% (20,618 rooms) remain. How this inventory is handled over the final two weeks will determine where the long weekend lands.
As a reference, we examined business and city hotel curves for two September Saturdays whose observations are complete through the day before arrival: the regular Saturday 9/12 and 9/19, the first day of Silver Week. The cohorts differ partly from October (business N=296 and 294 properties, city N=35 properties), so read them not for their levels but as a template for “how much builds in the final stretch.” The day-by-day demand distribution across September’s five-day holiday itself is analyzed in detail in Osaka Sep 2026 Holiday: Demand Peaks First 2 Nights, Sep 23 at 58.0%.
| Stay date / category | T-16 | T-14 | T-7 | T-1 | T-14 → T-1 | T-7 → T-1 |
|---|---|---|---|---|---|---|
| 9/12 (Sat) Business (N=296, 48,736 rooms) | 63.3% | 64.8% | 70.8% | 85.1% | +20.3pt | +14.3pt |
| 9/19 (Sat, first day of Silver Week) Business (N=294, 48,505 rooms) | 79.8% | 80.8% | 85.6% | 93.9% | +13.1pt | +8.3pt |
| 9/12 (Sat) City (N=35, 8,016 rooms) | 73.1% | 74.4% | 78.9% | 86.8% | +12.4pt | +7.9pt |
| 9/19 (Sat, first day of Silver Week) City (N=35, 8,016 rooms) | 87.0% | 87.2% | 89.1% | 94.4% | +7.2pt | +5.3pt |
Source: Compiled by the HotelBank Editorial Team from MetroEngines Research data
For business hotels, the gain from T-14 to T-1 was +20.3pt on 9/12 and +13.1pt on 9/19. The last 7 days alone accounted for +14.3pt and +8.3pt respectively. More than half of the final two weeks’ gain came in the last week, with especially large jumps between T-2 and T-1 (9/12: 80.0% at T-2 → 85.1% at T-1). City hotels’ gains were smaller than business hotels’, at +12.4pt and +7.2pt.
Source: Compiled by the HotelBank Editorial Team from MetroEngines Research data
This chart overlays the business hotel curves for the two September Saturdays and for 10/10. At T-16, 10/10 stands at 76.8%, 13.5pt above 9/12 at the same lead time (63.3%) and close to Silver Week’s first day, 9/19 (79.8%). Whether September’s pattern will repeat depends on sales from here, but at least the shape — “a sizeable block of demand arrives in the final week” — was common to both Saturdays. Rather than discounting early to clear the final two weeks’ inventory, keeping inventory and rate headroom to sell in the final week is the approach that fits this shape.
The night of 10/12 (Mon, holiday), on the other hand, behaves differently. The next day is a regular Tuesday, so demand mixes guests extending the long weekend with guests staying over ahead of work the next day. Business hotels’ sell-through of remaining inventory is low at 23.2%, and holding inventory until the very end, as on a Saturday, can easily lead to missed revenue. Setups that encourage multi-night stays from the first night, and conditions that capture single-night demand, should be put in place early.
Supplementary Metric: Monthly Estimated Settled ADR
On the price side, we refer only to monthly levels of estimated settled ADR (tax-exclusive equivalent) as a supplementary metric (daily prices are not covered). Year-over-year changes are calculated only between finalized months.
| Category | Oct 2025 (final) | Aug 2025 (final) | Aug 2026 (final) | August YoY (final vs. final) | Oct 2026 (estimate based on current sales) |
|---|---|---|---|---|---|
| City hotels | ¥16,085 (N=91) | ¥17,291 (N=91) | ¥13,078 (N=97) | −24.4% | ¥15,055 (N=97) |
| Business hotels | ¥13,113 (N=497) | ¥13,211 (N=499) | ¥8,772 (N=503) | −33.6% | ¥10,698 (N=495) |
| Ryokan | ¥11,065 (N=40) | ¥12,799 (N=39) | ¥11,326 (N=36) | −11.5% | ¥14,918 (N=37) |
Source: Compiled by the HotelBank Editorial Team from MetroEngines Research data
Estimated settled ADR for October 2026, based on current sales, is around ¥15,100 for city hotels (N=97), ¥10,700 for business hotels (N=495) and ¥14,900 for ryokan (N=37). Because October 2026 values may still change with further sales, a direct comparison with the finalized October 2025 figures (city ¥16,100, business ¥13,100) must wait until the month closes. Between finalized months, the latest, August 2026, was down year over year by 24.4% for city hotels, 33.6% for business hotels and 11.5% for ryokan. Note that 2025, the comparison year, overlapped with the Expo 2025 Osaka, Kansai period (April 13 – October 13, 2025), so year-over-year figures are measured against the elevated Expo-period levels (for how to handle YoY in the year after the Expo, see Osaka Settled ADR June 2026: City -26.3%, Business -32.8% Post-Expo). Also note that the number of properties (N) for estimated settled ADR is drawn from a different population than the fixed booking-curve cohorts.
For Revenue Managers of Business and City Hotels in Osaka — Implications and Action Plan
1. The category gap is set by the “starting point.” The gap between city and business hotels for 10/10 narrowed from 22.3pt at T-45 to 12.0pt, yet their sell-through of remaining inventory was nearly identical at 51.1% vs. 48.7%. When judging whether your property is behind, look not only at the point gap to the market but also at “what share of the inventory remaining at T-45 has sold.” If the point gap is large but sell-through is in line with the market, the issue lies not in last-minute selling but in the groundwork laid up to T-45 (early-booking conditions and visibility).
2. Treat the three nights of the long weekend as “separate dates.” Business hotels’ sell-through of remaining inventory was 48.7% for 10/10 but 23.2% for 10/12. Handling all three nights with the same price band and inventory policy tends to leave pricing headroom on the first night and missed revenue on the last night at the same time.
3. The long-weekend premium differs by category. Compared with the regular Saturday 10/3 at the same T-16, the first-night premium was +7.7pt for business hotels and +7.8pt for ryokan, versus +2.9pt for city hotels. City hotels already see strong demand on ordinary Saturdays, so raising rates “because it’s a long weekend” alone tends to rest on thin grounds.
4. Regular Saturdays in October are strong, too. At T-23, the following Saturday, 10/17, was ahead of 10/10. While reviewing the long weekend, check settings for late-October Saturdays against the same yardstick.
Action Plan by Time Horizon — From T-16 to T-1
| Time horizon | Action | Decision trigger (figures from this article) | Goal |
|---|---|---|---|
| This week (T-16 to T-14) | Compare your property’s estimated occupancy for 10/10, 10/11 and 10/12 with the market’s latest values (business 76.8%, 68.5%, 57.9%; city 88.8%, 82.2%, 75.1%) and check your position date by date | If the dates where you trail the market significantly are concentrated on the final night, 10/12 | Establish that the three nights will not be treated uniformly, and address only the weak dates individually |
| This week (same) | Review selling conditions for 10/10 (minimum length of stay, rate band) | If the business-hotel sold-out property rate for 10/10 stays at 29.3% or higher and nearby availability keeps thinning | Consider rate headroom for the first night only, designed together with steering stays into the final night |
| Up to one week out (T-13 to T-7) | Prepare to capture single-night demand for 10/12 (Mon, holiday) — e.g., relaxing plan conditions, boosting visibility to corporate and local demand | If your property shows the same trend as the market’s ample availability for business hotels on 10/12 (latest 57.9%, 20,618 rooms remaining) | Consider capturing demand through conditions first, rather than relying solely on discounts |
| Up to one week out (same) | Plan to release remaining 10/10 rooms in stages rather than clearing them early | Given that, on the two September Saturdays, business hotels gained +8.3 to +14.3pt in the last 7 days | Keep inventory and rate headroom to absorb final-week demand |
| Final week (T-6 to T-1) | Check remaining rooms and the market’s sold-out property rate daily, and fine-tune rates and released inventory in small steps | If the market’s sold-out property rate keeps rising and your remaining rooms are not higher than expected | Capture all attainable demand right to the end while avoiding rushing to fill rooms with discounts |
| After the long weekend | Record the final outcome for the three nights at the three checkpoints (T-45, T-30, last-minute) and use it as the baseline for the next long weekend (November onward) | If any dates show a gap between this article’s gains and sell-through shares and your own results | Build your property’s own “pattern” as input for next time’s groundwork |
Source: Compiled by the HotelBank Editorial Team from MetroEngines Research data
All of these are implications drawn from market-wide estimates; the optimal actions for any given property depend on its location, room mix and sales channels. Check them against your own booking data and adopt what fits.
Summary — Three Yardsticks for Reading Category Gaps on Long Weekends
1. Read gaps both as point differences and as sell-through of remaining inventory. In Osaka, 10/10 shows a 12.0pt gap between city (88.8%) and business (76.8%) hotels, but their sell-through since T-45 was nearly the same at 51.1% and 48.7%. The gap stems not from sell-through speed but from where each stood at T-45.
2. Measure the long-weekend effect against “a regular Saturday at the same lead time.” The premium at T-16 was business +7.7pt, ryokan +7.8pt and city +2.9pt. At some points the following Saturday, 10/17, was even higher — October Saturdays outside the long weekend are strong too.
3. In the final two weeks, save inventory for “the last week.” On the two September Saturdays, more than half of business hotels’ gain over the final 14 days (+13.1 to +20.3pt) came in the last 7 days. Conversely, for slow-selling dates such as the final night, 10/12, consider acting early.
Frequently Asked Questions
Q. For Osaka’s October long weekend, is business hotels’ estimated OCC lower than city hotels’ because they are selling more slowly?
A. Not necessarily. The share of inventory remaining at T-45 that had sold by the latest observation (sell-through of remaining inventory) for 10/10 is nearly the same: 51.1% for city hotels and 48.7% for business hotels. Most of the gap was set by the levels at T-45 (city 77.1%, business 54.8%).
Q. How is sell-through of remaining inventory calculated?
A. Divide the gain in estimated OCC from T-45 to the latest observation by the inventory remaining at T-45 (100 − estimated OCC). For business hotels on 10/10, that is (76.8 − 54.8) ÷ (100 − 54.8) = 48.7%. Because point gains alone make categories with more remaining inventory look faster, we look at this share alongside them.
Q. How should the final night of the long weekend, 10/12, be handled?
A. For business hotels it is the weakest of the three nights, at 57.9% latest and 23.2% sell-through of remaining inventory. Because the next day is a regular Tuesday and demand differs in character from a Saturday, setups that encourage multi-night stays from the first night and conditions that capture single-night demand, put in place early, are more likely to limit missed revenue than holding inventory until the very end.
Q. How much stronger is the long weekend than a regular Saturday?
A. Compared with the regular Saturday 10/3 at T-16, the premium for the first night, 10/10, is +7.7pt for business hotels, +7.8pt for ryokan and +2.9pt for city hotels. However, at T-23 the following Saturday, 10/17 (city 90.8%, business 74.2%), was ahead of 10/10 (city 88.1%, business 71.9%); in October, Saturdays outside the long weekend are strong as well.
Q. When does inventory in the final two weeks tend to sell?
A. For business hotels on two September Saturdays with complete observations through T-1 (9/12 and 9/19), the last 7 days accounted for +14.3pt and +8.3pt of the T-14 to T-1 gains (+20.3pt and +13.1pt) — more than half. Growth into the day before arrival was also large, so keeping inventory to sell in the final week fits this pattern for Saturday nights.
About the Data
• Definition of estimated OCC (based on OTA-listed inventory): OTA-listed-inventory occupancy = 100 − 100 × OTA-listed remaining rooms ÷ total rooms. The scope is a fixed cohort of properties listing at least 30% of their total rooms on OTAs (the same set of properties for each stay date; the number of properties is shown as N= in this article). It is an estimate based on the absorption of inventory sold on OTAs and is defined differently from actual room occupancy (rooms not listed are counted as sold, so it tends to read high).
• Booking curves: based on observations from T-45 to the latest date. Scope: Osaka Prefecture (based on listings on major booking sites). For the October long weekend and for 10/3 and 10/17, the fixed cohorts are city N=38 properties / 8,161 rooms, business N=297 properties / 48,884 rooms (10/12: N=298 properties / 48,919 rooms) and ryokan N=23 properties / 655 rooms. For the September reference dates, 9/12 is city N=35 properties / 8,016 rooms and business N=296 properties / 48,736 rooms; 9/19 is city N=35 properties / 8,016 rooms and business N=294 properties / 48,505 rooms. Latest values are from the September 24, 2026 observation.
• Estimated settled ADR: the settled price level (tax-exclusive equivalent) estimated from OTA and other sales data (lowest-plan level × category-specific factor, an ensemble across multiple channels). Past months are finalized values; current and future months are estimates based on current sales. Median error against published operating results: 6.6%. N= for each month is shown in the table (Osaka Prefecture, city hotels / business hotels / ryokan).
• Sold-out property rate: the estimated share of properties with no listed inventory visible on OTAs and similar channels. Sell-through of remaining inventory: the gain in estimated OCC from T-45 to the latest observation divided by the inventory remaining at T-45 (100 − estimated OCC).
• Data as of: September 25, 2026. Sales and inventory change daily; the figures in this article are a snapshot as of the time of retrieval.
References and Sources
■ Data Sources
OTA-listed inventory and sales data (Osaka Prefecture) collected by MetroEngines Research. Booking curves use fixed cohorts (October long weekend: 38 city hotels, 297 business hotels, 23 ryokan) observed from August 26 to September 24, 2026; estimated settled ADR uses monthly aggregates from January 2025 to December 2026. The Expo 2025 Osaka, Kansai period is based on materials published by the Japan Association for the 2025 World Exposition.
■ Calculation Assumptions
Estimated OCC = 100 − 100 × OTA-listed remaining rooms ÷ total rooms. Sell-through of remaining inventory = (latest estimated OCC − T-45 estimated OCC) ÷ (100 − T-45 estimated OCC). Because the September reference dates use cohorts that partly differ from October’s, they are used only as a reference for the shape of late-stage gains, not for levels. October 2026 estimated settled ADR is an in-progress estimate.
■ Limitations
Rooms not listed on OTAs are counted as sold, so values read higher than actual room occupancy. Latest values are snapshots at T-16 to T-18 and are not final outcomes. The ryokan cohort is small (23 properties, 655 rooms) and fluctuates considerably day to day. These are market-wide estimates and differ from individual properties’ results.
■ External Sources
• Japan Association for the 2025 World Exposition, “Overview” (Expo 2025 Osaka, Kansai dates)