

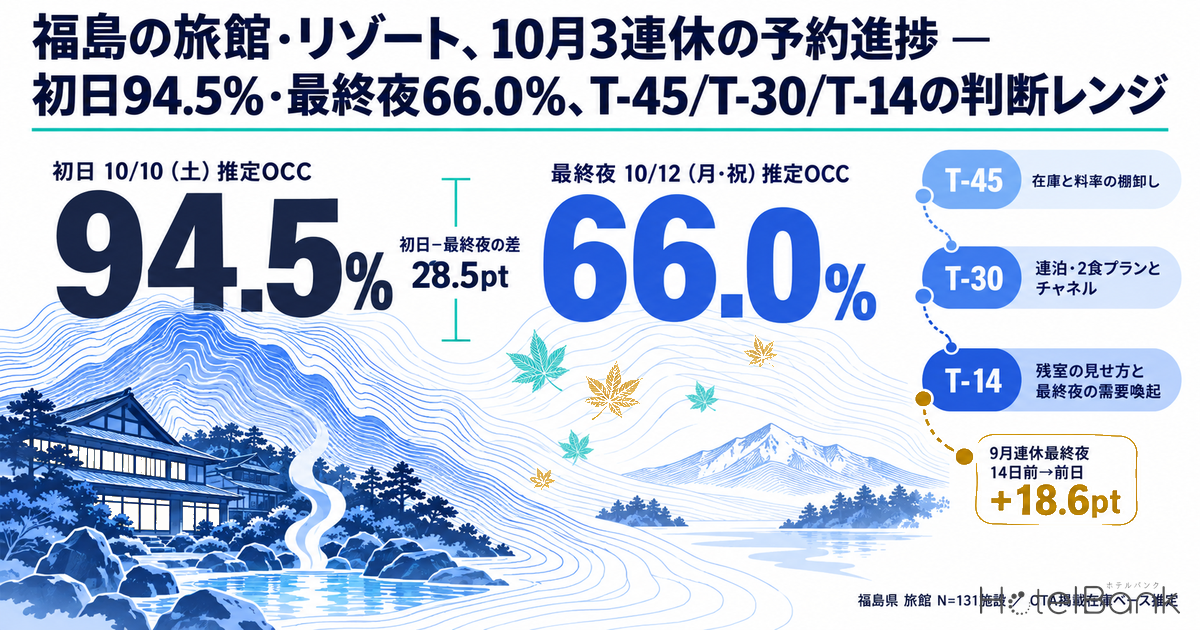
For the October three-day weekend that includes Sports Day (Saturday, October 10 to Monday, October 12, 2026), Fukushima Prefecture’s ryokan had reached an estimated OCC (based on OTA-listed inventory) of 94.5% for the first night, October 10, with 14 days to go, and the share of properties with no listed inventory (estimated sell-out rate) stood at 65.6%. The final night, October 12, meanwhile, was only at 66.0% with 16 days to go, and the gap to the first night had barely moved, from 28.6pt at T-45 to 28.5pt. At resort hotels the gap widened from 20.9pt to 33.2pt. The final night of September’s holiday (Sep 23) climbed +18.6pt, from 64.4% at T-14 to 83.0% on the eve-of-stay observation, so the last two weeks before the final night remain the decisive window for selling out. This article tracks market pace at three fixed points (T-45, T-30 and the latest observation) and sets out pace ranges to use as decision benchmarks in three blocks: T-45, T-30 and T-14.
Scope: Fukushima Prefecture ryokan N=131 properties (4,173 rooms) and resort hotels N=19 properties (1,522 rooms), based on listings on major booking sites. Occupancy in this article is an estimate based on OTA-listed inventory; price levels are not covered. Definitions are at the end of the article. Data as of September 27, 2026 (latest observation September 26).
• OCC (occupancy) = rooms sold as a share of total rooms in the area (an estimate based on OTA sales inventory). In this article it is calculated on a fixed cohort of properties that list at least 30% of their total rooms on OTAs.
• This article analyzes occupancy (estimated OCC) only; price levels (ADR) are not covered.
• Source: MetroEngines Research (continuous tracking of OTA public inventory for about 27,000 verified operating properties)
- — First night 94.5% / final night 66.0%: For Fukushima ryokan (N=131 properties, 4,173 rooms), the October three-day weekend stood at an estimated OCC of 94.5% for the first night, Oct 10 (T-14), and 66.0% for the final night, Oct 12 (T-16), as observed on September 26, 2026.
- — First-to-final-night gap stuck in the 28pt range: For ryokan it went from 28.6pt at T-45 to 28.5pt at the latest observation, with no narrowing; for resort hotels (N=19) it widened from 20.9pt to 33.2pt.
- — Night-by-night gap larger than in six nearby prefectures: At T-16, Fukushima’s first-night-minus-final-night gap was 28.1pt, second only to Niigata (28.2pt) among the seven prefectures compared. Its final-night 66.0% was the second-lowest after Shizuoka (64.4%).
- — September holiday final night gained +18.6pt in the last two weeks: Sep 23 went from 64.4% at T-14 to 83.0% on the eve of stay. However, +11.8pt of that came between T-3 and the eve, so last-minute stop-sells are likely part of the jump.
- — Final-night landing range of 71–85%: A projection applying three paths to the 66.0% at T-16: recent pace continues (+5.1pt), a normal Sunday (+12.6pt), or September’s holiday final night (+18.9pt).
Ryokan N=131: First Night Above 90%, Final Night in the 60s — Two Distinct Pace Patterns
We plotted the booking curve for each night of the three-day weekend for Fukushima ryokan (N=131 properties, 4,173 rooms), from T-45 to the latest observation. The first night, Oct 10, was already high at an estimated OCC of 82.3% at T-45 (observed August 26, 2026), reaching 88.8% at T-30 and 94.5% at T-14 — a gain of +12.2pt from T-45. The sell-out rate also rose from 33.8% to 51.5% to 65.6%, meaning roughly two in three properties had no listed inventory visible on OTAs and similar channels.
The middle night, Oct 11, went 69.4% (T-45) → 78.1% (T-30) → 85.2% (T-15), a gain of +15.8pt — the largest of the three nights. It added +7.1pt in just the 15 days from T-30 to T-15, which reads as demand spilling over to the second night once the first night filled. The final night, Oct 12, went 53.7% → 61.2% → 66.0% (T-16), a gain of +12.3pt. Because the next day is a weekday its level is lower, but its pace itself is not very different from the other two nights.
Source: MetroEngines Research; compiled by HotelBank Editorial Team
| Segment / Night | T-45 | T-30 | Latest observation (days out) | Gain from T-45 | Sell-out rate (T-45 → latest) |
|---|---|---|---|---|---|
| Ryokan Oct 10 (Sat) | 82.3% | 88.8% | 94.5% (T-14) | +12.2pt | 33.8%→65.6% |
| Ryokan Oct 11 (Sun) | 69.4% | 78.1% | 85.2% (T-15) | +15.8pt | 23.7%→36.6% |
| Ryokan Oct 12 (Mon, holiday) | 53.7% | 61.2% | 66.0% (T-16) | +12.3pt | 13.0%→15.3% |
| Resort Oct 10 (Sat) | 69.0% | 85.9% | 90.1% (T-14) | +21.1pt | 36.8%→57.9% |
| Resort Oct 11 (Sun) | 64.8% | 71.0% | 79.9% (T-15) | +15.1pt | 31.6%→26.3% |
| Resort Oct 12 (Mon, holiday) | 48.1% | 51.4% | 56.9% (T-16) | +8.8pt | 0.0%→0.0% |
Estimated OCC = estimated occupancy based on OTA-listed inventory. Ryokan N=131 properties / 4,173 rooms; resort hotels N=19 properties / 1,522 rooms (same property set for each night). Sell-out rate = share of properties with no listed inventory visible on OTAs and similar channels (estimated).
Source: MetroEngines Research; compiled by HotelBank Editorial Team
Resorts N=19: First Night Surged by T-30, Widening the Gap to the Final Night
Resort hotels (N=19 properties, 1,522 rooms) form a much smaller cohort than ryokan, so a single property’s inventory moves show up clearly in the numbers. With that caveat, the pattern is this: the first night, Oct 10, jumped +16.9pt from 69.0% at T-45 to 85.9% at T-30. In one day, from T-36 to T-35, it leapt from 74.0% to 83.1% (+9.1pt), suggesting a block of inventory moved at once. At T-14 it stood at 90.1%, with a sell-out rate of 57.9%.
The middle night, Oct 11, went 64.8% → 71.0% → 79.9%, adding +8.9pt in the 15 days after T-30 — gains concentrated in the later stretch. The final night, Oct 12, by contrast went 48.1% → 51.4% → 56.9%, a gain of only +8.8pt from T-45, and its sell-out rate was 0.0% (none of the 19 properties had run out of listed inventory). The gap between the first and final nights widened from 20.9pt at T-45 to 33.2pt at the latest observation. At resorts, demand concentrates in the first half of the holiday, making the handling of final-night vacancies an even sharper issue than for ryokan.
Source: MetroEngines Research; compiled by HotelBank Editorial Team
On autumn leisure demand, Fukushima Prefecture publishes regular foliage updates for the Bandai-Azuma Skyline, and as of September 25, 2026 it reported that the leaves were beginning to change color. In a typical year the peak viewing period coincides with the October holiday, and the first night’s early pace is consistent with this leisure demand. The final night, however, is followed by a weekday, and the numbers show that foliage demand does not easily translate into overnight stays that night. Autumn market structure also differs across the prefecture’s areas, such as Aizu, Urabandai, Iwaki and Koriyama, so area-level conditions are worth checking alongside the prefecture-wide figures.
Compared With Six Nearby Prefectures: Fukushima Is on the Wide-Gap Side
To check whether Fukushima’s ryokan pace is specific to the prefecture or a pattern common to the holiday, we lined up ryokan cohorts for the same three-day weekend in six nearby and competing prefectures (Miyagi, Yamagata, Tochigi, Gunma, Niigata and Shizuoka). At T-16, with days-out aligned, Fukushima’s first-to-final-night gap was 28.1pt, second only to Niigata (28.2pt) among the seven prefectures, and about 8pt wider than Miyagi (19.4pt) or Gunma (20.3pt).
On the level of the final night, Oct 12, itself, Fukushima’s 66.0% was the second-lowest after Shizuoka (64.4%), roughly level with Yamagata (66.2%). The first night, Oct 10, meanwhile, was 94.1%, second only to Niigata (98.0%). In other words, the pattern common to holiday weekends — strong first night, weak final night — shows up more sharply in Fukushima than in most of the prefectures compared. At T-45 the gap was already 28.6pt, the second-largest after Niigata (28.9pt; third-placed Yamagata was 23.7pt), so the gap did not emerge at the last minute but has persisted since sales began.
| Prefecture (ryokan) | N (properties) | First night Oct 10, T-45 | Final night Oct 12, T-45 | Gap (T-45) | First night Oct 10, T-16 | Final night Oct 12, T-16 | Gap (T-16) |
|---|---|---|---|---|---|---|---|
| Fukushima | 131 | 82.3% | 53.7% | 28.6pt | 94.1% | 66.0% | 28.1pt |
| Miyagi | 77 | 80.1% | 60.5% | 19.6pt | 91.3% | 71.9% | 19.4pt |
| Yamagata | 117 | 76.5% | 52.8% | 23.7pt | 91.3% | 66.2% | 25.1pt |
| Tochigi | 148 | 78.9% | 55.5% | 23.4pt | 88.9% | 67.3% | 21.6pt |
| Gunma | 185 | 81.7% | 59.4% | 22.3pt | 92.5% | 72.2% | 20.3pt |
| Niigata | 147 | 87.1% | 58.2% | 28.9pt | 98.0% | 69.8% | 28.2pt |
| Shizuoka | 311 | 71.9% | 53.6% | 18.3pt | 85.7% | 64.4% | 21.3pt |
Estimated OCC = estimated occupancy based on OTA-listed inventory. Each prefecture uses a fixed cohort of ryokan that list at least 30% of their total rooms on OTAs, compared with the same definition and on the same observation dates as Fukushima (T-16 = observed September 24, 2026 for the first night and September 26 for the final night). The first-night value uses T-16 to align with the final night, so it differs from the 94.5% at T-14 cited at the top of the article.
Source: MetroEngines Research; compiled by HotelBank Editorial Team
Lessons From the September Holiday’s “Last Two Weeks”: Final Night +18.6pt From T-14
Eve-of-stay values for Oct 10–12 have not yet been observed. We therefore checked how much September stay dates, which have finished being observed, gained from T-14 to the eve of stay (ryokan N=127–132 properties; compared within a period using the same observation method). The first night of September’s long holiday, Sep 19 (Sat), was already at 96.4% at T-14 and 98.4% on the eve (+2.0pt), leaving little room to grow. A regular non-holiday Saturday, Sep 12, went from 81.4% to 93.5% (+12.1pt). And the holiday’s final night, Sep 23 (Wed, holiday), climbed the most, +18.6pt, from 64.4% at T-14 to 83.0% on the eve-of-stay observation.
Source: MetroEngines Research; compiled by HotelBank Editorial Team
| Stay date (ryokan) | N (properties) | T-45 | T-30 | T-14 | Eve-of-stay observation | T-14 → eve |
|---|---|---|---|---|---|---|
| Sep 12 (Sat) regular weekend | 128 | 71.5% | 75.6% | 81.4% | 93.5% | +12.1pt |
| Sep 13 (Sun) regular Sunday | 129 | 64.4% | 68.0% | 74.7% | 86.9% | +12.2pt |
| Sep 19 (Sat) holiday first night | 129 | 76.9% | 85.6% | 96.4% | 98.4% | +2.0pt |
| Sep 23 (Wed, holiday) holiday final night | 132 | 50.4% | 57.7% | 64.4% | 83.0% | +18.6pt |
| Oct 12 (Mon, holiday) holiday final night | 131 | 53.7% | 61.2% | 66.0% (T-16) | Not yet observed | — |
Source: MetroEngines Research; compiled by HotelBank Editorial Team
The 66.0% for Oct 12 at T-16 sits almost exactly where Sep 23 was at T-16 (64.1%). There is no guarantee Oct 12 will build the same way, but September’s results show that final-night inventory was not “unsold at T-14, therefore unsellable” — it was inventory that moved in bulk during the last two weeks. At resorts (N=19), Sep 23 also rose +14.0pt, from 61.6% at T-14 to 75.6% on the eve. Conversely, nights that are already in the high 90s at T-14, like the first night, have little room left to grow. For the same perspective on filling a holiday’s final night when the next day is a weekday, Mie Prefecture’s September holiday showed a similar pattern, with only the final night (Sep 23) lagging at 73.7% for ryokan.
Projected Landing Range for the Final Night, Oct 12: How to Read the 71–85% Spread
How much the final night will gain over its remaining 16 days has not yet been observed. We therefore projected an eve-of-stay landing range by applying Oct 12’s own recent pace and the actual results of two September nights that have finished being observed. The starting point is 66.0% at T-16 (1,420 rooms remaining).
| Scenario | Basis for the gain (Fukushima ryokan) | Gain from T-16 to eve | Estimated OCC on the eve (projection) | Rooms moving market-wide (projection) |
|---|---|---|---|---|
| Pessimistic: recent pace continues | The same pace as the +4.8pt from T-30 to T-16 (14 days), continued over the remaining 15 days | +5.1pt | 71.1% | About 213 rooms |
| Middle: like a normal Sunday | Sep 13 (Sun) — a night followed by a weekday — gained +12.6pt from T-16 to eve (74.3%→86.9%) | +12.6pt | 78.6% | About 526 rooms |
| Optimistic: like September’s holiday final night | Sep 23 (Wed, holiday) gained +18.9pt from T-16 to eve (64.1%→83.0%) | +18.9pt | 84.9% | About 789 rooms |
Starting point is the estimated OCC of 66.0% for Oct 12 (Mon, holiday) at T-16 (observed September 26, 2026), with 1,420 rooms remaining (ryokan N=131 properties, 4,173 rooms). Room counts are approximated as gain × 4,173 rooms. The projection is a market-wide guide, not a forecast of the actual outcome.
Source: MetroEngines Research; compiled by HotelBank Editorial Team
If the recent pace holds, the final night lands at 71.1%; if it builds like a normal Sunday followed by a weekday, 78.6%; and if it follows September’s holiday final night, 84.9% — a spread of about 14pt. Depending on the scenario, the number of rooms moving market-wide in the final stretch ranges from about 210 to about 790. Note that of Sep 23’s +18.6pt gain (T-14 to eve), +11.8pt was concentrated between T-3 (71.2%) and the eve (83.0%). Because estimated OCC counts rooms withdrawn from sale as consumed, last-minute stop-sells may be part of that jump. The optimistic scenario does not show that “keeping inventory open until the last minute guarantees it will sell”; read it as an upper-bound guide.
For Revenue Managers at Fukushima Ryokan and Resorts — Implications and Action Plan
1. Treat a three-day weekend as three separate nights, not one block of demand. Even within the same holiday, the ryokan market stood at 82.3% for the first night, 69.4% for the middle night and 53.7% for the final night at T-45 — a spread of about 29pt. If you track your own pace for “the holiday as a whole,” a strong first night hides a lagging final night. Compare each night against its market curve.
2. The middle night absorbs demand spilling over from the first night. Ryokan added +7.1pt for Oct 11 between T-30 and T-15, the largest gain of the three nights. Getting the second-night offer in shape as soon as the first night starts filling leaves room to capture that spillover.
3. Treat final-night vacancies as inventory that moves in the last two weeks. Sep 23 gained +18.6pt from T-14 to the eve. Rather than rushing into deep discounts or pulling inventory based on the T-14 level alone, consider keeping inventory open for the demand that arrives late.
4. Resorts skew toward the first half. The gap between the first and final nights widened from 20.9pt to 33.2pt. Whether demand captured early can be converted into multi-night stays will decide how the final night turns out.
This Oct 10–12 holiday is already at around T-14, so use T-45 and T-30 as a retrospective check, and apply the same steps from the start to the next three-day weekend (Saturday, November 21 to Monday, November 23, holiday). Use this article’s market values (ryokan) as the benchmarks. November 21–23 is the only three-day weekend in November 2026, so check how it overlaps with the autumn foliage peak in your area as well.
| Timing | Action | Decision trigger (market values from this article) | Aim |
|---|---|---|---|
| T-45 Inventory and rate review | For each night, list your own rooms sold, rooms remaining and the rate steps (first / middle / final night) | If your first-night pace is above the market’s 82.3%, hold the first-night rate; if your final night is below the market’s 53.7%, rework the final-night offer first | Split the holiday into three nights and decide where to act first |
| T-45 | Consider releasing part of the first night’s single-night inventory only with a multi-night condition | If the market’s first-night sell-out rate has reached the 30% range (33.8%), there is little need to rush single-night sales for the first night | Redirect first-night strength to the middle and final nights |
| T-30 Multi-night / half-board plans and channels | Push two-night stays (first→middle, middle→final) with half board to the front | If the middle night has not reached the market’s 78.1% or the final night the market’s 61.2%, prioritize visibility of multi-night plans | Capture the spillover into the middle night (+7.1pt from T-30 to T-15) |
| T-30 | Review remaining-room allocation by sales channel, moving channel inventory from filled nights to unsold nights | If the first night exceeds the market’s 88.8% and the sell-out rate is above half (51.5%), judge that no extra first-night exposure is needed | Concentrate visible inventory on the weaker nights |
| T-14 Presenting remaining rooms and stimulating final-night demand | Keep final-night inventory open rather than closing it, and keep showing it through a simple one-night, half-board plan | If the final night is around the market’s 66.0%, treat it as inventory that moves late, based on Sep 23’s +18.6pt | Don’t miss the gains of the last two weeks |
| T-14 | For the first and middle nights, fine-tune how the last few rooms are released (decide when to lift multi-night conditions) | If the first night is at the market’s 94.5% level and the middle night at 85.2%, there is little late upside (Sep 19 gained only +2.0pt), so remove conditions and sell out the remaining rooms | Avoid reaching the stay date with the last few peak-night rooms still empty |
Source: MetroEngines Research; compiled by HotelBank Editorial Team
All of these are guides benchmarked on market-wide movements; the best action for your property depends on its guest mix, location and channel mix. Use the numbers as triggers for decisions, and check them against your own past holiday results.
Summary — How to Read Holiday Booking Pace
The October three-day weekend at Fukushima ryokan and resorts offers three ways of reading booking pace.
| Lens | Values this time (ryokan N=131) | How to use it |
|---|---|---|
| 1. Night-by-night gap (first − final night) | 28.6pt at T-45 → 28.5pt at T-16 | If the gap isn’t narrowing, treat the final night not as part of the holiday but as a “night before a weekday” and act separately |
| 2. Spillover into the middle night | +7.1pt from T-30 to T-15 | Once the first night starts filling, it is the signal to boost second-night visibility |
| 3. Upside in the last two weeks | Sep 23 final night +18.6pt / Sep 19 first night +2.0pt | The lower a night is at T-14, the more it pays to keep inventory open and wait for late demand |
Source: MetroEngines Research; compiled by HotelBank Editorial Team
All three apply directly to the three-day weekends from November onward and to the year-end and New Year period. Start by comparing your night-by-night gap against the market at T-45.
About the Data
| Definition of estimated OCC | Occupancy based on OTA-listed inventory = 100 − 100 × OTA-listed remaining rooms ÷ total rooms. Covers a fixed cohort of properties listing at least 30% of total rooms on OTAs (the same property set for each stay date). It is an estimate based on the depletion of inventory sold on OTAs and is defined differently from actual room occupancy (rooms not listed are counted as consumed, so it tends to run high). |
| Booking curve | Based on observations from T-45 to the latest date for each stay date. “Last-minute” and “eve-of-stay observation” refer to the value observed on the day before the stay date. |
| Sell-out rate | Share of properties with no listed inventory visible on OTAs and similar channels (estimated). |
| Price metrics | This article analyzes occupancy (estimated OCC) only and does not cover price levels at ryokan or resort hotels. |
| Coverage N= | Fukushima ryokan: N=131 properties / 4,173 rooms for each stay date Oct 10–12 (based on listings on major booking sites). Fukushima resort hotels: N=19 properties / 1,522 rooms for Oct 10–12. September comparison dates: ryokan N=127–132 properties, resorts N=18–19 properties. |
| Data as of | September 27, 2026 (latest observation September 26). Sales status and inventory change daily, so the figures in this article are a snapshot at the time of retrieval. |
References and Sources
■ Data Source
OTA public inventory data continuously tracked by MetroEngines Research (about 27,000 verified operating properties). We used daily observations from T-45 through the latest observation (September 26, 2026) for stay dates from September 12 to October 12, 2026, for fixed cohorts of Fukushima ryokan (N=131 properties, 4,173 rooms) and resort hotels (N=19 properties, 1,522 rooms). Ryokan in the six nearby prefectures (Miyagi, Yamagata, Tochigi, Gunma, Niigata and Shizuoka) were compared using cohorts with the same definition.
■ Projection Assumptions
Estimated OCC = 100 − 100 × OTA-listed remaining rooms ÷ total rooms. The landing range in Table 4 adds to Oct 12’s estimated OCC of 66.0% at T-16 (observed September 26, 2026): (1) +5.1pt, the T-30 → T-16 gain of +4.8pt (14 days) extended proportionally over the remaining 15 days; (2) +12.6pt, the T-16 → eve gain for Sep 13 (Sun); and (3) +18.9pt, the T-16 → eve gain for Sep 23 (Wed, holiday). Room counts are approximated as gain × 4,173 total rooms.
■ Limitations and Caveats
Estimated OCC counts unlisted and stop-sold rooms as consumed, so it tends to run higher than actual room occupancy; eve-of-stay jumps in particular may include last-minute stop-sells. Resort hotels are a small cohort (N=19), so one property’s inventory moves can shift the figures significantly. Eve-of-stay values for Oct 10–12 had not been observed as of the data date; Table 4 is a guide applying the gains of past nights, not a forecast. Price levels (ADR) are not covered.
| Fukushima Prefecture, “Skyline Autumn Foliage Information” | https://www.pref.fukushima.lg.jp/sec/41310a/skyline-kouyou-info.html |
| Cabinet Office, Government of Japan, “About National Holidays” | https://www8.cao.go.jp/chosei/shukujitsu/gaiyou.html |