

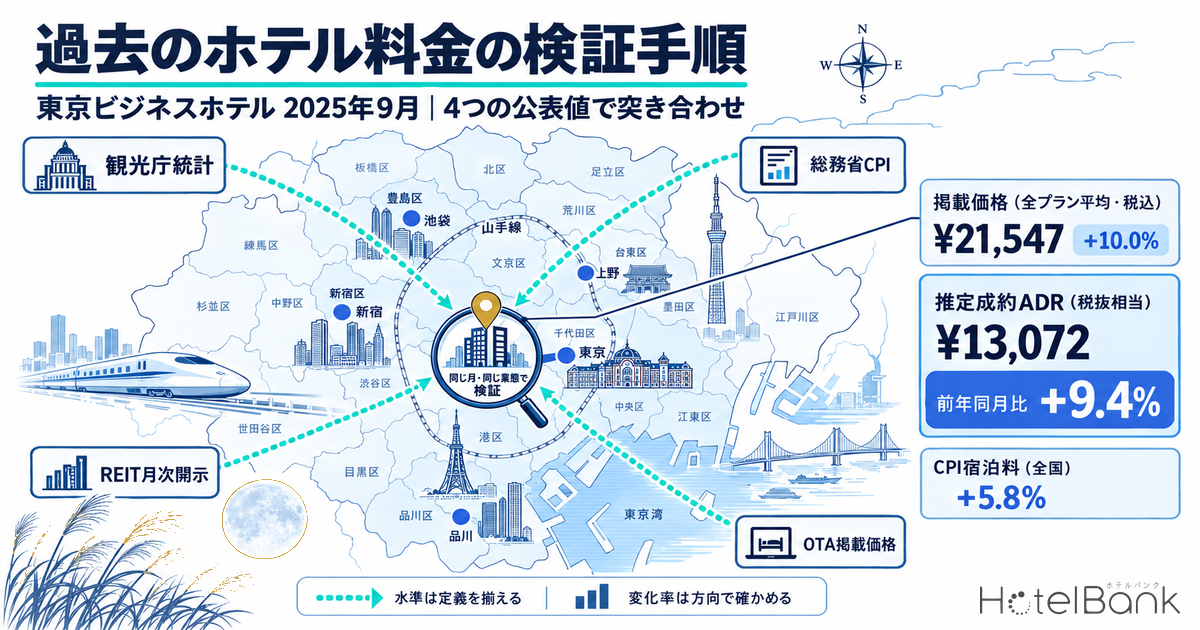
The need to look back at past hotel rates arises when checking whether an assumed ADR is reasonable in underwriting, when building a comp set, and when comparing your own rate history against the market. Yet no single published source can answer a question such as “What were Tokyo business hotels actually selling for in September 2025?” This article lays out a procedure for cross-checking four published figures — Japan Tourism Agency (JTA) statistics, the Ministry of Internal Affairs and Communications (MIC) CPI, the monthly disclosures of listed hotel REITs, and monthly aggregates of OTA listed prices — by applying them to the same month and the same hotel type. The worked example is Tokyo business hotels in September 2025 (all-plan average listed price ¥21,500, N=883 properties).
Metric Definitions Used in This Article
- ADR (Average Daily Rate): An estimated settled rate (tax-exclusive equivalent) calculated by applying a hotel-type-specific adjustment factor to the lowest plan level each property publishes on OTAs (per room, two guests per room, tax-inclusive). In a reconciliation against the property-level results disclosed by listed hotel REITs (91 properties, most recent three months), the median error was about 7%. These are estimates and differ from each property’s actual settled prices and accounting figures. Area-level ADR is the median of the properties covered (the level of a typical property in the area).
- Listed price (all-plan average, tax-inclusive): The average of the published prices (per room, two guests per room, tax-inclusive) of all plans on sale, from room-only to plans with meals. It is not a settled price and is a different metric from ADR.
- Room occupancy rate (JTA): The figure published in the JTA “Accommodation Travel Statistics Survey”: occupied rooms divided by total rooms.
- REIT ADR and RevPAR: Settled results disclosed monthly by each investment corporation (excluding consumption tax). This article quotes the published figures as they are.
- Data sources: MetroEngines Research (monthly aggregates for Tokyo business hotels), Japan Tourism Agency, Statistics Bureau of Japan (MIC), and REIT disclosure materials
- — No official statistic gives room rates in yen. No official statistic publishes room rates in yen. JTA statistics go only as far as demand volume and occupancy; the CPI goes only as far as the rate of price change.
- — Tokyo business hotels were up 9.4% YoY in September 2025. For Tokyo business hotels in September 2025, the listed price (all-plan average, tax-inclusive) was ¥21,500 (N=883 properties) against an estimated settled ADR of ¥13,100 (N=894 properties). YoY changes were +10.0% and +9.4% respectively, above the +5.8% of the national lodging CPI for the same month.
- — The base year shifts the lodging CPI’s YoY change by 1.2pt. The CPI moved to the 2025 base from the July 2026 release. The YoY change in lodging charges for August 2026 is −1.4% on the 2025 base and −0.2% on the 2020 base — a 1.2pt difference depending on the base.
- — Cross-check REIT-disclosed ADR on rates of change. REIT-disclosed ADR is a settled result excluding consumption tax, and the scope of aggregation differs by REIT. Compare it with market data on rates of change, not on levels.
The Four Published Sources Differ in What They Can and Cannot Tell You
The ways to research past rates fall into four families. What matters is whether each one shows “the rate itself,” only “the change in rates,” or “something other than rates.” Even the same phrase “year-on-year” means different things for a YoY point difference in occupancy, a YoY change in a price index, and a YoY change in settled ADR. The efficient approach is to check the coverage of each source in the table below first, then start with the one that fits your question.
| Source | Main items published | Treatment of rates | Release timing | What to check before use |
|---|---|---|---|---|
| JTA “Accommodation Travel Statistics Survey” | Total guest nights, number of guests, room occupancy rate, bed occupancy rate (six facility types, by prefecture, monthly) | Not included | First preliminary at the end of the following month, second preliminary about two months later, final figures the following year | From the January 2026 data, the stratification criterion changed from “number of employees” to “number of rooms.” YoY comparisons may include the effect of this revision |
| MIC “Consumer Price Index” — lodging charges | An index showing price change (national, Tokyo ward area, etc.) | Rate of change only (no yen-denominated level) | Late in the following month (national) | On the 2025 base from the July 2026 data. The 2020 base is published in parallel through the December 2026 data, and the figures differ |
| Monthly disclosures of listed hotel REITs | ADR, occupancy, RevPAR, revenue, and the same month of the previous year | Settled ADR (excluding consumption tax) | The following month to two months later, depending on the REIT | The scope of aggregation (number of properties, whether limited to variable-rent properties) differs by REIT. Owned properties only |
| Monthly aggregates of OTA listed prices (MetroEngines Research) | Listed price (all-plan average, tax-inclusive) and estimated settled ADR (tax-exclusive equivalent) | Two levels: listed price and an estimate | Monthly (the current month is a work-in-progress as of the survey date) | A listed price is not a settled price. Estimated ADR is a model estimate |
Source: Compiled by HotelBank Editorial Team from Japan Tourism Agency, Statistics Bureau of Japan (MIC), REIT disclosure materials, and MetroEngines Research
This article focuses on the practical procedure for verifying a single month against multiple sources.
JTA “Accommodation Travel Statistics Survey” — Rates Are Not a Survey Item
The first point to grasp is that the JTA Accommodation Travel Statistics Survey does not include room rates. What it publishes are total guest nights, number of guests, room occupancy rate, bed occupancy rate and the like, with monthly values available by facility type (ryokan, resort hotels, business hotels, city hotels, simple lodgings, and company/organization lodging facilities) and by prefecture. “Past rates” therefore cannot be reconstructed from JTA statistics alone; their proper role in a discussion of rates is to corroborate demand volume.
The most recent release is the “July 2026 first preliminary report” published on August 31, 2026. Total guest nights in July were 54.67 million (−3.5% YoY); the room occupancy rate was 60.8% overall and 74.2% for business hotels (−0.5pt YoY). However, the first preliminary report is an estimate at a valid response rate of 32.9% and will be revised in the second preliminary report scheduled for release on September 30, 2026. In addition, the stratification criterion was changed from “number of employees” to “number of rooms” from the January 2026 data, and the JTA itself notes that YoY comparisons may include the effect of this revision. When looking back at past occupancy, always confirm whether a figure is preliminary or final, and whether it is a YoY comparison from 2026 onward.
MIC CPI “Lodging Charges” — Shows the Rate of Change, but Watch the Shift to the 2025 Base
The official statistic that can be used to track rate movements is the “lodging charges” item of the Consumer Price Index published by the Statistics Bureau of Japan (MIC). It expresses price change as an index and does not provide rate levels in yen. On the other hand, because the national figure for each month is released late in the following month, it gives an early read on whether rates across the market rose or fell compared with a year earlier.
The practical pitfall here is the base revision. The CPI switched to the 2025 base from the July 2026 data, and the January 2025 through June 2026 data were recalculated retroactively on the 2025 base. Because the 2020-base index also continues to be published in parallel through the December 2026 data, e-Stat shows two figures for lodging charges in the same month. The national lodging charges index for August 2026 was 106.8 on the 2025 base and 181.1 on the 2020 base. In YoY terms the 2025 base shows −1.4% and the 2020 base −0.2% — even the strength of the decline changes.
| Month (2026) | Jan | Feb | Mar | Apr | May | Jun | Jul | Aug |
|---|---|---|---|---|---|---|---|---|
| 2025 base, YoY | +5.5% | +5.7% | +4.5% | +3.7% | +3.6% | +1.5% | +0.9% | -1.4% |
| 2020 base, YoY | +6.0% | +6.0% | +5.0% | +4.6% | +4.8% | +3.1% | +2.0% | -0.2% |
| Difference (2025 base − 2020 base) | -0.5pt | -0.3pt | -0.5pt | -0.9pt | -1.2pt | -1.6pt | -1.1pt | -1.2pt |
Source: Compiled by HotelBank Editorial Team from Statistics Bureau of Japan (MIC), “Consumer Price Index (2025 base)” and “Consumer Price Index (2020 base),” by item, lodging charges, national (e-Stat)
Source: Compiled by HotelBank Editorial Team from Statistics Bureau of Japan (MIC), “Consumer Price Index,” lodging charges, national (e-Stat)
For each month of 2025 the YoY change is identical on the old and new bases, but the gap opens up in 2026, reaching 1.6pt in June and still 1.2pt in August. The update of the base year and the weights lies behind this. If past reports or internal documents quote the lodging CPI, placing those figures next to the latest values without confirming which base they use makes the change look larger than it really is. The safe practice is to link only series on the same base when building a time series, and to state “2025 base” explicitly when quoting.
Monthly Disclosures of Listed Hotel REITs — Quote the Published Figures As They Are
One of the few primary sources that publish settled ADR monthly is the monthly operating results of listed hotel REITs. Japan has seven listed hotel REITs: Ichigo Hotel REIT Investment Corporation (いちごホテルリート投資法人, 3463), Invincible Investment Corporation (インヴィンシブル投資法人, 8963), Nippon Hotel & Residential Investment Corporation (日本ホテル&レジデンシャル投資法人, 3472), Japan Hotel REIT Investment Corporation (ジャパン・ホテル・リート投資法人, 8985), Hoshino Resorts REIT (星野リゾート・リート投資法人, 3287), MORI TRUST REIT (森トラストリート投資法人, 8961), and Kasumigaseki Hotel REIT Investment Corporation (霞ヶ関ホテルリート投資法人, 401A). Some disclose portfolio-level totals, while others center their disclosure on individual properties.
The rule for quoting is simple: use the figures each REIT has published as they are, without processing them. If you average property-level figures yourself to create a portfolio value, it will no longer match the published figure because of differences in scope and weighting. The table below transcribes the portfolio-level figures from the August 2026 monthly disclosures exactly as published.
| REIT | Scope | Room occupancy | ADR | ADR, same month last year | ADR YoY | RevPAR |
|---|---|---|---|---|---|---|
| Invincible Investment Corporation (8963) | 101 domestic hotels | 87.3% | ¥17,887 | ¥18,485 | −3.2% | ¥15,608 |
| Japan Hotel REIT Investment Corporation (8985) | 29 hotels with variable rent, etc. | 84.1% | ¥23,337 | — | −8.8% | ¥19,616 |
| Ichigo Hotel REIT Investment Corporation (3463) | Total of 23 hotels (excluding hotels fully closed) | 84.9% | ¥10,510 | ¥10,801 | −2.7% | ¥8,925 |
Source: Compiled by HotelBank Editorial Team from each REIT’s monthly operating data (August 2026 results; ADR and RevPAR exclude consumption tax). The prior-year ADR for Japan Hotel REIT Investment Corporation is shown as “—” because the corresponding field in its disclosure contains no figure
All three REITs posted August 2026 ADR below the same month of the previous year, with declines ranging from −2.7% to −8.8%. This spread reflects differences in the location and hotel-type mix of the properties held and in the scope of aggregation (all properties or variable-rent properties only). REIT figures are precise, but they are the results of the properties held, not the market rate of a specific area or hotel type. To use them as an area benchmark, it is preferable to pick the properties in the target area from the property-level disclosures and check those.
Monthly Aggregates of OTA Listed Prices — A Worked Example: Tokyo Business Hotels, September 2025
What lets you trace market levels by area and hotel type month by month is the aggregation of OTA listed prices. Of the properties tracked by MetroEngines Research, the published prices of about 27,000 properties confirmed to be operating are aggregated monthly, giving two levels for the same month. One is the listed price (tax-inclusive), the average of all plans on sale; the other is the estimated settled ADR (tax-exclusive equivalent), which applies a hotel-type-specific adjustment to the lowest plan level.
| Metric (Tokyo, business hotels) | Sep 2024 | Sep 2025 | YoY | Aggregation conditions |
|---|---|---|---|---|
| Listed price (all-plan average, tax-inclusive) | ¥19,589 | ¥21,547 | +10.0% | N=883 properties (Sep 2025) / 901 properties (Sep 2024). Per-room rate for two guests per room, including all plans from room-only to plans with meals |
| Estimated settled ADR (tax-exclusive equivalent) | ¥11,954 | ¥13,072 | +9.4% | N=894 properties (Sep 2025) / 910 properties (Sep 2024). Median of the properties covered. Median error of about 7% in reconciliation with REIT-disclosed results |
| Reference: Lodging CPI (national), YoY | — | — | +5.8% | Statistics Bureau of Japan (MIC). Same value on both the 2025 base and the 2020 base |
Source: Compiled by HotelBank Editorial Team from MetroEngines Research / Statistics Bureau of Japan (MIC), “Consumer Price Index”
For Tokyo business hotels in September 2025, the listed price was ¥21,500 and the estimated settled ADR was ¥13,100, putting the listed price at about 1.65 times the settled level. Listed prices come out high because unsold high-priced plans and plans with meals stay on the sales screen, so treating “the price that was listed” as “the price that sold” leads to a large overestimate of ADR. In addition, listed prices are tax-inclusive while REIT disclosures and the estimated settled ADR are tax-exclusive, so roughly 10% of consumption tax is added on top as a definitional difference. If you are checking against the assumed ADR in underwriting, the estimated settled ADR is the one to use.
In terms of rates of change, the YoY change was +10.0% for the listed price and +9.4% for the estimated settled ADR, showing almost the same direction and magnitude. The national lodging CPI for the same month was +5.8%, which shows that Tokyo business hotels were rising more strongly than lodging charges across the country as a whole. The basic division of labor is thus to compare levels only between sources whose definitions match, and to confirm the direction of rates of change across multiple sources.
Source: Compiled by HotelBank Editorial Team from MetroEngines Research (Tokyo, business hotels; estimated settled ADR N=894–924 properties per month, listed price N=883–903 properties. September 2026 is excluded because aggregation is still in progress)
Overlaying the years makes the seasonality of Tokyo business hotels clear: high in April and October–November, low in January and June–August. This is why past rates should be compared “year on year” rather than “month on month.” The rise from September to October was about ¥2,300 in 2025, so comparing across different months risks mistaking a seasonal difference for a price movement.
Cross-Checking All Four for the Latest Month — YoY Change in August 2026
Applying the same procedure to the latest month makes the differences in character between the sources even clearer. Lining up the YoY changes for August 2026, the estimated settled ADR for Tokyo business hotels was −8.9% (¥12,700 → ¥11,600, N=900 → 915 properties), the lodging CPI (national, 2025 base) was −1.4%, and REIT ADR was −2.7% to −8.8%. Because the JTA statistics for August are scheduled for release on September 30, 2026, what is usable at this point goes only as far as the July first preliminary report (business hotel room occupancy of 74.2%, −0.5pt YoY).
Source: Compiled by HotelBank Editorial Team from MetroEngines Research / Statistics Bureau of Japan (MIC), “Consumer Price Index (2025 base)” / each REIT’s monthly operating data (published figures)
All four figures agree in direction: “below the previous year.” The size of the decline varies, however, and this is due to differences in scope. The CPI covers lodging charges nationwide, the REITs cover the properties each holds, and the OTA aggregate covers Tokyo business hotels — each looks at a different population. The point to watch here is the number of properties on the listed-price side: 991 properties in August 2026, up from 892 in the same month of the previous year. Because the YoY change in the listed price (−5.3%) includes turnover in the properties covered, it is more appropriate to base YoY discussion on the estimated settled ADR, whose property count is stable (900 → 915 properties).
A Practical Procedure for Verifying Past Rates
Based on the above, working in the following order minimizes rework when verifying past rates retrospectively.
| Step | Key point |
|---|---|
| 1. Split the question into “level” and “rate of change” | Look at the level to judge whether an assumed ADR is reasonable, and at the rate of change to judge the market’s direction. Compare levels only between sources whose definitions match on tax-inclusive vs. tax-exclusive and settled vs. listed. |
| 2. Confirm levels with sources whose definitions match | Compare settled ADR with settled ADR (REIT disclosures and estimated settled ADR). When using listed prices, assume a definitional difference such as about 1.65 times the settled level (Tokyo business hotels, September 2025). |
| 3. Confirm the direction of the rate of change across multiple sources | Line up the YoY change in the OTA aggregate with the YoY changes in the lodging CPI and REIT disclosures, and check whether the directions agree. |
| 4. Corroborate with demand volume | Use total guest nights and room occupancy from JTA statistics to see whether the price movement is consistent with the rise or fall in demand. State clearly whether figures are preliminary or final. |
| 5. Always record sources and conditions | Recording N (number of properties), tax-inclusive vs. tax-exclusive, the CPI base year, and each REIT’s scope in the footnotes of your materials lets the figures be verified later. |
Source: Compiled by HotelBank Editorial Team
Frequently Asked Questions
Q. Is there an official statistic that publishes past hotel rates (room rates)?
A. No. The JTA “Accommodation Travel Statistics Survey” publishes demand volumes such as total guest nights, number of guests and room occupancy; room rates are not a survey item. To track rate movements with official statistics, use the lodging charges item of the MIC “Consumer Price Index” (an index showing the rate of price change).
Q. Why do the lodging CPI figures differ between the 2025 base and the 2020 base?
A. Because the index switched to the 2025 base from the July 2026 data, updating the base year and the weights. The YoY change in lodging charges for August 2026 was −1.4% on the 2025 base and −0.2% on the 2020 base published in parallel. Always state the base year when quoting a YoY change, and link only series on the same base when building a time series.
Q. Can REIT monthly ADR and OTA listed prices be compared directly?
A. They are not suited to comparing levels. The ADR disclosed by REITs is a settled result excluding consumption tax, while OTA listed prices are the tax-inclusive prices of plans on sale and include unsold high-priced plans. For Tokyo business hotels, the listed price (all-plan average) in September 2025 was about 1.65 times the estimated settled ADR. If you compare them, do so between rates of change such as YoY.
Q. Which source should take priority when tracing past ADR to build a comp set?
A. Use REIT property-level disclosures if you need the results of individual properties, monthly aggregates of settled ADR estimated from OTA listed prices for market levels by area and hotel type, JTA statistics to corroborate demand volume, and the CPI for comparison with prices overall. Cross-checking a single month against multiple sources is the reliable approach.
Summary
Past hotel rates cannot be reconstructed from a single source. JTA statistics show demand volume, the CPI the rate of price change, REIT disclosures the settled results of properties held, and OTA aggregates the market level by area and hotel type — each shows a different facet. Taking Tokyo business hotels in September 2025 as the example, there were two levels — a listed price of ¥21,500 and an estimated settled ADR of ¥13,100 — and the YoY change for both was roughly +9–10%, above the national lodging CPI (+5.8%). Apply the four sources to the same month, confirm levels with matching definitions, and confirm rates of change by agreement in direction. If definitional changes such as the CPI’s shift to the 2025 base are kept in the footnotes, the comp sets and rate-trend verifications you produce can be reproduced when revisited later.
About the timing of the figures: The figures in this article are as of the survey date of September 26, 2026. The JTA figures for July 2026 are first preliminary values and may be revised in the second preliminary report (scheduled for release on September 30, 2026). The OTA aggregate for September 2026 is not shown because the month was still in progress. REIT figures are based on each REIT’s monthly disclosure for August 2026. ADR in this article is an estimate (median error of about 7% in reconciliation with REIT-disclosed results); settled ADR disclosed by REITs is shown excluding consumption tax, and the estimated settled ADR in this article is also at a tax-exclusive equivalent level.
Related Articles
References and Sources
■ Data sources
JTA “Accommodation Travel Statistics Survey” (July 2026, first preliminary report); Statistics Bureau of Japan (MIC), “Consumer Price Index,” item “lodging charges,” national (2025 base and 2020 base); August 2026 monthly disclosures of three listed hotel REITs (8963, 8985, 3463); and MetroEngines Research monthly aggregates for Tokyo business hotels (listed price N=883–991 properties, estimated settled ADR N=894–924 properties, August 2024–August 2026). Retrieved as of September 26, 2026.
■ Calculation assumptions
The listed price is the monthly average of the published prices of all plans on sale (per room, two guests per room, tax-inclusive). The estimated settled ADR is a tax-exclusive-equivalent estimate that applies a hotel-type-specific adjustment factor to the lowest plan level; the area value is the median of the properties covered. YoY change is a comparison with the same month of the previous year under the same aggregation conditions. REIT and CPI figures are transcribed as published and have not been processed.
■ Limitations and caveats
The estimated settled ADR is a model estimate; in reconciliation with REIT-disclosed results (91 properties, most recent three months) the median error is about 7%. The listed price is not a settled price and is affected by changes in the number of properties covered (991 properties in August 2026 vs. 892 in the same month of the previous year). Because the populations of the CPI and the REITs differ from Tokyo business hotels, they are reconciled on the direction of the rate of change rather than on levels. The JTA figures for July 2026 are the first preliminary report and may be revised in the second preliminary report (scheduled for release on September 30, 2026).
- Japan Tourism Agency, “Accommodation Travel Statistics Survey (July 2026 first preliminary report, June 2026 second preliminary report)” (August 31, 2026)
- Japan Tourism Agency, “Accommodation Travel Statistics Survey” statistics page
- MIC, “2025-Base Consumer Price Index, Japan, July 2026” (August 21, 2026)
- Statistics Bureau of Japan (MIC), “Consumer Price Index: 2025 Base Revision Plan (Draft)”
- e-Stat, “Consumer Price Index (2025 base)” (statistical table ID: 0004052037) and “Consumer Price Index (2020 base)” (statistical table ID: 0003427113), item “lodging charges,” national
- Invincible Investment Corporation, Monthly Operating Results (August 2026)
- Japan Hotel REIT Investment Corporation, Monthly Disclosure (August 2026)
- Ichigo Hotel REIT Investment Corporation, Monthly Operating Results (August 2026)
- MetroEngines Research — monthly listed price and estimated settled ADR for Tokyo business hotels (N=883–991 properties)