

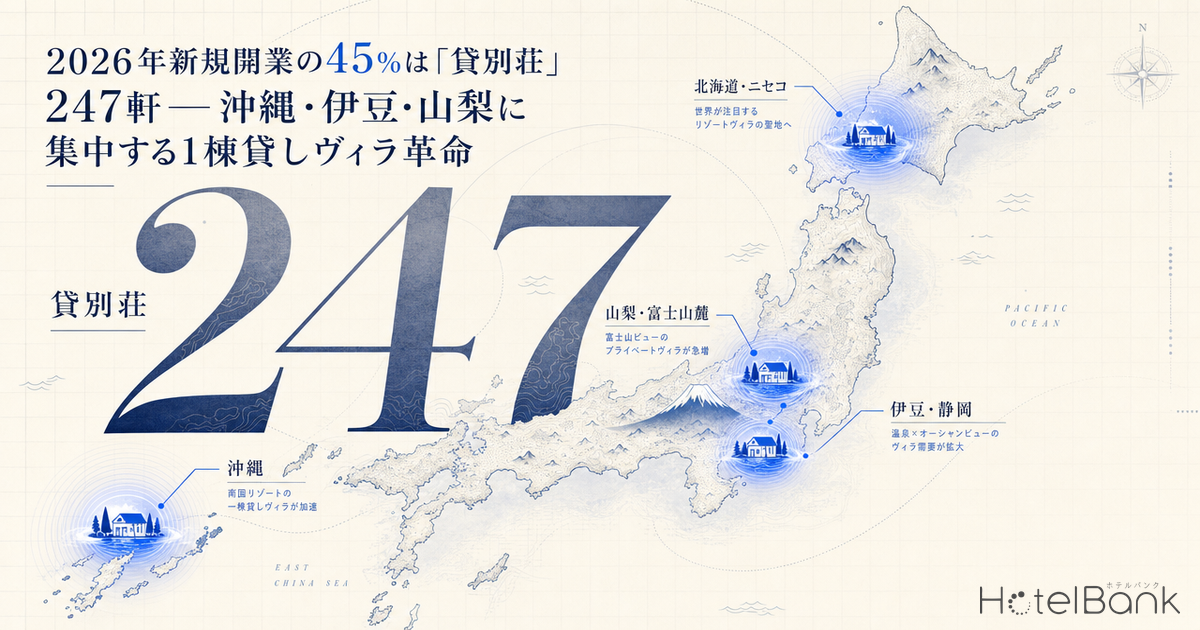
Of the 556 new accommodation facilities that opened in Japan in 2026, a striking 247 (44.4%) fell under the “vacation rental” category. Although down from the previous year (661 in 2025), vacation rentals have held the No. 1 category position for the fifth consecutive year, leaving traditional business hotels (87 facilities, 15.6%) and resort hotels (28 facilities, 5.0%) far behind. In this article, we combine MetroEngines Research’s 2026 new-opening data with OTA published-price data for the four leading prefectures — Okinawa, Shizuoka, Yamanashi, and Hokkaido — to visualize the geographic concentration of the whole-house villa segment and its price-band competition with existing resorts.
Metric Definitions Used in This Article
- ADR (Average Daily Rate): Average of published prices on OTAs. Differs from actual transacted rates. Per-room rate based on 2-person/1-room occupancy (tax included), averaged across all plan types (room-only through plans with meals).
- OCC (Occupancy Rate, estimated): Ratio of sold rooms to total inventory in the area (estimated from OTA sales inventory).
- “Vacation Rental”: In this article, refers to detached whole-house villa-format lodging. The “room count” indicates “number of buildings,” averaging 1.9 buildings (min 1, max 54) — essentially a micro-supply format where “1 building = 1 operating unit.”
- Data Source: MetroEngines Research (based on confirmed OTA listings)
Category Breakdown of 556 New Openings in 2026 — Vacation Rentals Dominate at 44.4%
The breakdown of the 556 facilities confirmed as new openings in 2026 (including those scheduled through December at the time of survey) is as follows: vacation rentals 247 (44.4%), business hotels 87 (15.6%), resort hotels 28 (5.0%), guesthouses 27 (4.9%), hostels 25 (4.5%), city hotels 24 (4.3%), ryokan 21 (3.8%), machiya townhouses 21 (3.8%), cottages 18 (3.2%), and so on. Combining “vacation rental-adjacent categories” such as glamping, pensions, cottages, and machiya brings the total to 293 (52.7%), making it clear that traditional clustered-hotel formats are now in the minority.
Source: MetroEngines Research & Consulting (based on confirmed OTA listings, N=556 facilities)
What stands out is that the average scale of a vacation rental is just 1.9 buildings (min 1, max 54), essentially a micro-supply format in which “1 building = 1 operating unit.” By contrast, business hotels average 118.6 rooms and resort hotels average 115.8 rooms — a completely different order of magnitude from traditional clustered hotels. Recalculating on a room-count basis, 247 vacation rentals × 1.9 buildings on average ≈ 470 buildings of supply — far below the 87 business hotels × 118.6 rooms ≈ 10,300 rooms. The gap between impact measured by facility count and impact measured by bed count is large.
5-Year Trend — Vacation Rental Boom Peaked in 2024; 2026 Is an Adjustment Phase
Looking at the annual trajectory by category, vacation rentals surged from 543 in 2022 → 728 in 2023 → 829 in 2024 (5-year peak), then declined to 661 in 2025 and 247 in 2026 (at survey time). The 2026 figure is based on confirmations as of the survey date and is likely to grow as further OTA listings are added, but there are clear signs that the post-pandemic vacation rental boom is hitting a plateau.
Source: MetroEngines Research & Consulting (based on confirmed OTA listings)
*The 2026 figure is based on confirmations at survey time. Since OTA listings appear several months before opening, the number is expected to grow as additional listings come online.
The 2024-2025 vacation rental rush began with the pandemic-driven “avoid the 3 Cs” demand and was further accelerated by the relaxed operation of the Private Lodging Business Act (minpaku law) and the revised Hotel Business Act (enacted December 2023, strengthening responses to customer harassment and infectious disease). Meanwhile, business hotels shrank from 266 (2025) to 87 (2026, at survey time), indicating a simultaneous plateau in urban business hotel supply. Resort hotels show an even sharper deceleration: 99 (2025) → 28 (2026).
Monthly Opening Pace — 150 in January, Structurally Sparse from May Onward
Looking at monthly 2026 vacation rental openings, 150 facilities opened in January, 44 in February, 36 in March, and just 9 in April — a rush concentrated in January. From May onward, the count drops to a few or a dozen per month, but this is not a “depletion of supply” — rather, since OTA listings only appear a few months before opening, second-half 2026 openings have not yet been observed. This is a survey lead-time issue. In fact, looking at monthly opening records for 2024-2025, supply was stable at an average of 40-100 facilities per month throughout the year, with observation timing being the dominant factor rather than seasonality.
Source: MetroEngines Research & Consulting (based on confirmed OTA listings)
Geographic Concentration Map — 4-Pole Structure: Okinawa 22, Yamanashi 21, Shizuoka 21, Hokkaido 20
Breaking down the 247 vacation rentals opening in 2026 by prefecture reveals a concentration structure in which the top 4 prefectures account for 74 facilities (30%). Okinawa 22, Yamanashi 21, Shizuoka 21, and Hokkaido 20 — all “second-home/resort areas with good access from urban centers.” Next come Hyogo 13 (centered on Awaji Island), Fukuoka 13, Chiba 12 (Boso Peninsula), Kagoshima 12 (remote islands), Nagano 11, and Kanagawa 10 (centered on Hakone), highlighting a clear concentration in specific resort areas.
Source: MetroEngines Research & Consulting (N=124 facilities; only vacation rentals for which latitude/longitude data is available)
Map tiles: CartoDB Positron
At the city level, concentration is even higher. Awaji City 9, Hakone Town 9, Fujikawaguchiko Town 9, Ito City 8, Atami City 6, Miyakojima City 4, Motobu Town (Okinawa) 3, Yamanakako Village 3, Kutchan Town (Otaru City) 3, and others — clustered in some of the nation’s most prominent second-home, hot spring, and resort areas. The areas highlighted in our theme — “around JUNGLIA Okinawa (Motobu/Nago/Nakijin),” “Lake Yamanaka,” “Izu/Atami,” and “Niseko (Kutchan)” — all coincide with the major clusters on this 2026 new-opening map. The whole-house villa “Bise Enpu (備瀬縁梵)” that opened in Bise, Motobu Town in March 2026, covered in our feature on the Bise Enpu villa, is a symbolic example of this concentration in the northern Okinawa resort area.
ADR Comparison Across the Top 4 Prefectures — Vacation Rentals Surprisingly Outprice Resort Hotels
Aggregating OTA published prices for the 2026 Golden Week period (May 1-7), average vacation rental ADRs in the four prefectures were: Okinawa ¥70,800, Hokkaido ¥82,800, Yamanashi ¥86,900, and Shizuoka ¥93,600. Resort hotel ADRs in the same period were Okinawa ¥75,200, Hokkaido ¥59,400, Yamanashi ¥76,800, and Shizuoka ¥75,600. In three of the four prefectures (excluding Okinawa), vacation rental ADRs exceed resort hotel ADRs — a surprising structure at first glance.
Source: MetroEngines Research & Consulting (May 1-7, 2026; N=vacation rentals 1,384 facilities × 7 days / resort hotels 623 facilities × 7 days)
This is a critical shift that overturns the old image of “vacation rental = minpaku = budget lodging.” The reason is simple: vacation rental ADRs are “per-building rates,” and at 4-8 guests per booking, the per-person rate drops to ¥10,000-¥20,000 — comparable to or below a resort hotel shared room. Conversely, when used by just two people, they compete with the suite-class price band of resorts. Whole-house villas target the family/group segment with a strategy of “high price tier as a building, lower per-person rate via group occupancy,” and the segmentation from resort hotels’ “couples/small-party” demand is becoming clearly defined. For details on ADR levels and booking pace differences across major summer resorts such as Niseko, Okinawa, and Karuizawa, see our 2026 Summer Resort 3-Region Comparison: Niseko, Okinawa, and Karuizawa.
Okinawa Case Study — Even with More Vacation Rentals, Existing Resort ADR and Sell-Out Rates Are Rising
We tested the theme’s evaluation axis — “changes in existing hotel ADR and sell-out rate in areas with rising vacation rental supply” — in Okinawa Prefecture, the area with the highest vacation rental concentration. Aggregating monthly ADR and sell-out rate (the percentage of OTA inventory that reached zero) for Okinawa resort hotels overall (about 270 facilities) over the past 6 months (December 2025 – May 2026), ADR rose from ¥47,400 (Dec ’25) to ¥55,800 (May ’26), a +17.6% gain, while the sell-out rate surged from 0% to 38.0%.
Source: MetroEngines Research & Consulting (about 270 Okinawa resort hotels)
This is not a simple substitution story in which “new vacation rental supply squeezes existing resorts,” but rather a structure in which both formats coexist and the overall market is expanding. JUNGLIA Okinawa, which opened in July 2025, has acted as a catalyst, lifting accommodation demand across the Motobu/Nago/Nakijin area as a whole, with both resorts and vacation rentals reaping the benefits. The Nikkei reported “JUNGLIA Effect: Hotel Investment Fever in Okinawa — Tourism Promotion in Northern Main Island,” highlighting that area-wide demand creation is the backdrop of the vacation rental rush.
The same structure can be seen in the year-on-year comparison of Golden Week results. Comparing 2025 GW (May 3-4) and the same period in 2026 for resort hotel ADRs across four prefectures: Okinawa ¥85,400 → ¥91,800 (+7.5%), Shizuoka ¥91,000 → ¥101,100 (+11.0%), Hokkaido ¥64,800 → ¥62,000 (-4.4%), Hyogo ¥91,200 → ¥102,100 (+11.9%) — all with sell-out rates rising significantly from 0% the prior year. Hokkaido’s slight ADR decline is attributable to structural shifts in major resorts (such as new urban supply in Sapporo) rather than price competition with vacation rentals.
The Boundary with Glamping and Cottages — Diversity Within the “Vacation Rental” Category
The boundaries between formats are also becoming blurred. Among 2026 new openings, glamping (4), cottages (18), pensions (6), and machiya (21) all share the “whole-building/small-scale dispersed” format and resemble vacation rentals. Looking at overlap in the four prefectures: Nagano has 11 vacation rentals + 3 pensions + 2 cottages + 1 glamping; Yamanashi has 21 vacation rentals + 1 cottage + 1 glamping — the vacation rental category is expanding by subsuming other formats.
| Prefecture | Vacation Rental | Cottage | Pension | Glamping | Machiya | Total |
|---|---|---|---|---|---|---|
| Okinawa | 22 | 0 | 0 | 1 | 0 | 23 |
| Yamanashi | 21 | 1 | 0 | 1 | 0 | 23 |
| Shizuoka | 21 | 1 | 1 | 0 | 0 | 23 |
| Hokkaido | 20 | 1 | 0 | 0 | 0 | 21 |
| Nagano | 11 | 2 | 3 | 1 | 0 | 17 |
| Kyoto | 7 | 0 | 0 | 0 | 20 | 27 |
Source: MetroEngines Research & Consulting
Kyoto’s case is particularly symbolic. Of Kyoto’s 27 new 2026 openings, 20 are machiya and 7 are vacation rentals — all in “whole-building” format. Machiya renovation projects continue to open along the western Kamogawa and southern wards on a rolling basis, and while they sit in a different category, they are essentially a derivative of the whole-house villa format. The resort-area “villas” of Okinawa, Izu, Yamanashi, and Hokkaido, and Kyoto’s “machiya,” are together the lead actors of 2026’s new supply.
The Revised Hotel Business Act and Its Link to Format Transitions
Regarding the “single-room operation deregulation after the June 15 revised Hotel Business Act enforcement” cited in our theme, no official enforcement date had been announced as of May 2026. That said, easing of minimum room-count regulations under the Hotel Business Act and a step-by-step review of the boundary between Private Lodging Business (minpaku) and Simple Lodging operations are clearly underway. In particular, since the revised Hotel Business Act (enacted December 2023), strengthened infectious disease and customer harassment responses have come bundled with partial expansion of operational flexibility.
Among the 247 vacation rentals opening in 2026, the distribution — averaging 1.9 buildings, with a minimum of 1 — indicates that “1 building = 1 operating unit” entry has become the norm. Many are operating as full-fledged accommodation businesses under Simple Lodging permits (no annual operating-day limit) rather than under the minpaku simplified scheme (180-day annual cap). Going forward, regional disparities in vacation rental supply are expected to widen further between areas adding municipal ordinance restrictions (e.g., Tokyo’s Sumida Ward effective April 2026, Toshima Ward effective December 2026) and resort areas pursuing more permissive operation.
Conclusion — A “Parallel Growth Model” of Whole-House Villas and Existing Resorts
What the analysis of 556 new openings in 2026 reveals is that the vacation rental/whole-house villa segment is not functioning as a “substitute for urban hotel openings” but as a “complementary good supporting expanding resort demand.” In the Okinawa case, amid northern tourism promotion sparked by JUNGLIA Okinawa, resort hotels (ADR +17.6%, sell-out rate 0% → 38%) and vacation rentals (stable around ADR ¥70,800) are growing in parallel. In Yamanashi, Shizuoka, and Hokkaido as well, existing resort GW sell-out rates have risen significantly year-on-year, showing that demand-segment differentiation (couples/small parties vs. families/groups) is progressing faster than price-band competition with vacation rentals.
Category boundaries are also blurring: Kyoto’s machiya, Nagano’s pensions, Izu’s vacation rentals, and Niseko’s cottages are all converging on a common “whole-building, small-party operation” format. While 2026 has entered an adjustment phase from the 2024 peak of the vacation rental boom, geographic concentration in second-home areas, hot spring towns, and remote-island resorts is actually intensifying, and area-level demand-supply balance analysis remains critical. For existing resort hotels, the bigger opportunity is no longer how to avoid price competition with vacation rentals but how to leverage area-wide demand creation to redesign their own guest-mix and rate structure.
⚠ Note on ADR for Future Dates: The ADRs in this article are averages of OTA-published prices at the time of the survey, and will fluctuate as check-in dates approach. Prices set high today may fall due to last-minute discounts. Also, the 2026 new-opening figures are based on facilities confirmed via OTA listings at the survey time, and the numbers are expected to grow as additional listings are added.
Related Articles
- 2026 Summer Resort 3-Region Comparison: Niseko, Okinawa, and Karuizawa — ADR, Booking Pace, and Currency Sensitivity
- [Report] Whole-House Villa “Bise Enpu” Opens in Bise, Okinawa, Nestled in a Fukugi Tree Forest
- 2026 Golden Week Travel Demand Disperses — Hokkaido and Okinawa Surge; Pet-Friendly and Glamping Expand
- Atami’s New Openings (April 2026): A Sustainable Supply Structure Led by Mid-Scale Facilities
- Supply Shock Analysis: 4 Months of Concentrated Openings (May-August 2026)
- 4 New Hotel Openings in June 2026: Reading the Supply Shock Through Grade Differences
- [Report] “Ubaku Villa” Opens in Biei, Hokkaido — A Private Villa for Living-Style Stays
References & Sources
- MetroEngines Research & Consulting — OTA published-price data and new-opening data (based on confirmed OTA listings, N=556 facilities)
- Ministry of Health, Labour and Welfare — “Background on the Hotel Business Act Revisions”
- All Nippon Hotel Association — “On the Partial Revision of the Hotel Business Act Enforcement Order”
- Nikkei — “JUNGLIA Effect: Hotel Investment Fever in Okinawa, Tourism Promotion in Northern Main Island”
- JUNGLIA OKINAWA Official Site (opened July 25, 2025)
- Sumida Ward — Hotel Business / Private Lodging Business Ordinance Revision (effective April 2026)