

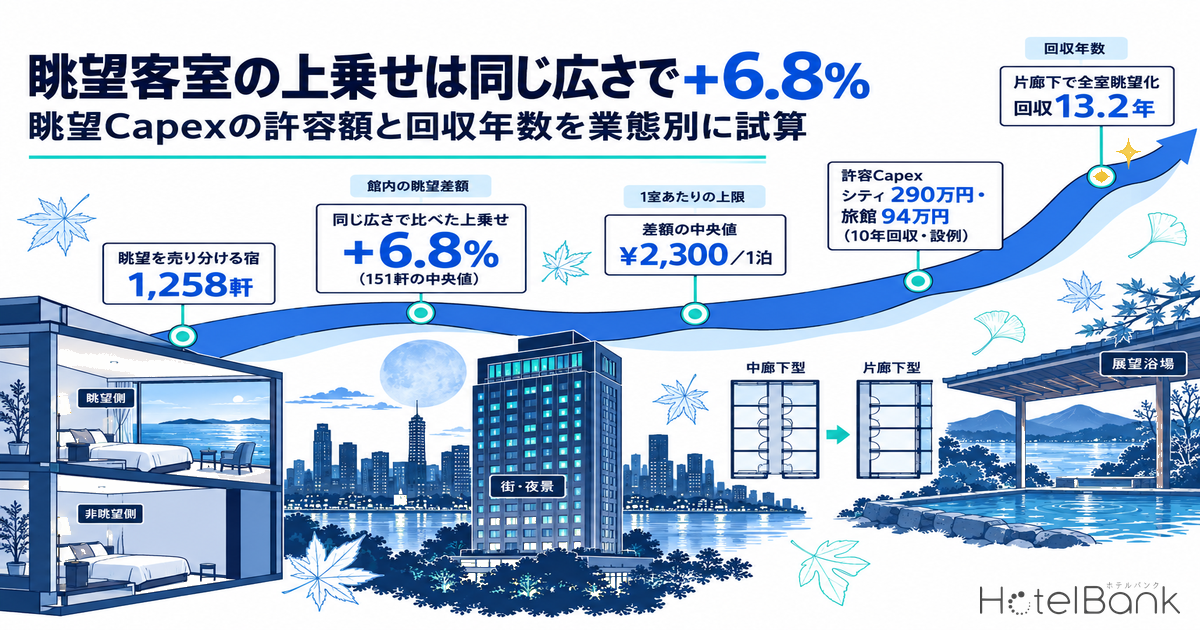
How much should a property spend on views within the same site and building? We extracted 1,258 properties nationwide that sell views separately by room name, such as “ocean view”, “sea side” or “high floor”, and compared listed prices between rooms at the same property, on the same stay date, under the same plan, with the same bed type and the same size (±10%). Across the 151 properties where size could also be matched, the median premium was +6.8% (median difference about ¥2,300). Multiplying this by the estimated settled ADR and the Japan Tourism Agency’s room occupancy rates, we estimated, as illustrative cases by property type, how much can be spent per room on design or renovation that creates a view (allowable Capex) and the payback period.
How this differs from earlier articles: Our earlier analyses of high-floor and club-floor price gaps and of Japan’s tallest hotels dealt with the price gap itself, i.e. the pricing of premium rooms including perks such as lounge access. This article removes club floors, rooms with lounge access, suites and rooms with private open-air baths from the comparison and measures the gap for the view alone. It then recasts that gap into a form usable for design and investment decisions on whether to invest in views within the same site: allowable Capex per room and the payback period.
Metric Definitions Used in This Article
- View premium (in-property difference): the ratio of listed prices (per-room rate for 2 guests per room, tax-inclusive) between rooms whose name contains a word indicating a view and rooms whose name does not, at the same property, on the same stay date, under the same plan name and with the same bed type. For each property we take the median across all pairs, then aggregate the property values. The “size-matched comparison” is limited to pairs where both room names state an area (m²) and the difference is within ±10%. Stay dates are four days: October 7 (Wed), 10 (Sat), 14 (Wed) and 17 (Sat), 2026.
- ADR (average daily rate): an estimated settled rate (tax-exclusive equivalent), calculated by applying a property-type-specific adjustment factor to the cheapest plan level each property publishes on OTAs (2 guests per room, per-room rate, tax-inclusive). Checked against property-level results disclosed by listed hotel REITs (91 properties, latest 3 months), the median error is about 7%. These are estimates and differ from each property’s actual settled prices and accounting figures. This article computes each property’s average over the 12 finalized months from September 2025 to August 2026 and uses the median.
- Room occupancy rate: the occupancy rates used in the estimates are the room occupancy rates by accommodation type from the Japan Tourism Agency’s Overnight Travel Statistics Survey, 2025 annual figures (final), which are actual published statistics. Our separately calculated OCC (occupancy) — rooms sold as a share of total rooms in an area, an estimate based on OTA sales inventory — is not used in this article.
- View mention rate in reviews: the share of guest reviews over the latest 24 months that, on semantic analysis, speak favourably about the view from the room (or from the bath). It measures how often the view is mentioned, not a rating score.
- Data sources: MetroEngines Research & Consulting (listed prices, estimated settled ADR) / HotelBank Editorial Team research (NLP analysis of reviews) / Japan Tourism Agency, Overnight Travel Statistics Survey / Ministry of Land, Infrastructure, Transport and Tourism, Statistics on Building Construction Starts
- — +6.8% View premium compared at the same size and under the same plan (median of 151 properties). Without matching size (727 properties) it is +6.0%: at most properties the premium the view alone earns is under 10%.
- — 72.8% Share of properties pricing the view side higher. 29.1% charge +10% or more, and the top quarter take +11.1% or more.
- — +2.7% In-property premium at resorts where 25% or more of reviews mention the room view. The more the view is the product of the whole property, the less properties differentiate between rooms.
- — ¥2.9M Ceiling on what a city hotel can spend on design or renovation to turn one room into a view room, on a 10-year payback (illustrative). Resorts ¥1.93M, ryokan ¥0.94M: the difference in occupancy feeds straight through.
- — 7.2 rooms If a 100-room hotel goes single-loaded so every room faces the view, on a site at its floor-area-ratio cap rooms are lost in proportion to the added corridor (illustrative). The room revenue lost exceeds the view premium gained.
1,258 Properties Sell Views by Room Name — About 1 in 4 Ryokan and Resorts
First, we counted how many properties carve out views as a room product. The scope was 7,103 properties: all ryokan, resort hotels and city hotels with 30 or more rooms, 1,500 business hotels sampled at random, and 65 properties with many view mentions in reviews. Of these, 1,258 had at least one recently sold room whose name contained words such as “ocean view”, “sea side”, “high floor”, “lake view”, “night view” or “view”.
By property type, 24.1% of ryokan (523 of 2,174) and 23.5% of resort hotels (407 of 1,730) sell views by room name — about 1 in 4. City hotels are at 15.1% (255 of 1,689) and business hotels at 4.7% (71 of the 1,507 sampled). What is counted here is whether a property sells views by distinguishing them in room names, not how good the views are. Note that properties where every room faces the same way, or that describe views without distinguishing them in room names, are not included.
Compared at the Same Size and Plan, the View Premium Is a Median +6.8%
The difficulty in measuring the price of a view is that rooms with better views tend to be larger and set at higher grades. So we matched the comparison conditions step by step. First we limited it to the same property, the same stay date, the same plan name (same meal conditions) and the same bed type, and removed club floors, rooms with lounge access, suites and rooms with private open-air baths from both sides. Under these conditions, 727 properties (113,842 rooms, 49,878 pairs) allowed the cheapest view-side and non-view-side rooms to be compared, with a median premium of +6.0%.
Narrowing further to pairs where both room names state an area and the size difference is within ±10% leaves 151 properties (32,300 rooms, 10,537 pairs). Here the median is +6.8%, with a lower quartile of 0.0% and an upper quartile of +11.1%. 72.8% of properties price the view side higher, and 29.1% by +10% or more. The median difference per night (listed price, tax-incl.) is about ¥2,300: about ¥2,800 at resort hotels, about ¥2,500 at city hotels and about ¥2,000 at ryokan.
On the other hand, 15 properties price the view and non-view sides the same, and 26 price the view side lower. In the latter, differences in building wing or age may be reflected in price, for example where view-side rooms are in a separate wing. It is more natural to read the view not as something priced on its own but as priced together with where in the building the view rooms are placed.
| Property type | Properties compared (no size condition) | Median premium | Properties with size matched | Median premium | Upper quartile | Properties at +10% or more | Median difference |
|---|---|---|---|---|---|---|---|
| Resort hotels | 217 | +5.6% | 51 | +7.2% | +13.0% | 37.3% | ¥2,800 |
| City hotels | 170 | +7.0% | 58 | +6.9% | +10.0% | 25.9% | ¥2,500 |
| Ryokan | 292 | +5.2% | 28 | +4.8% | +8.0% | 21.4% | ¥2,000 |
| Business hotels (reference) | 47 | +8.7% | 13 | +7.9% | +10.3% | 30.8% | ¥2,200 |
| All | 727 | +6.0% | 151 | +6.8% | +11.1% | 29.1% | ¥2,300 |
The gap with the +25.0% shown in our earlier club-floor analysis comes from comparing different things. Club-floor prices include lounge access and higher-grade interiors and amenities, whereas this article’s +6.8% is the difference between rooms of the same size and meal conditions where only the view outside the window differs. When considering at the design stage how much extra can be paid per room for a view, the latter figure is the starting point.
Which Views Translate into Price — All 12 City / Night-View Properties Are Positive
We split the 151 size-matched properties by the words in the view-side room names, classifying each property by the view type that appears most often. Counts are small, so these should be read as tendencies, but all 12 properties selling city views such as “city view”, “night view” or “tower view” price the view side higher, with a median of +9.1%. Sea (37 properties, +5.8%), high floor (40, +5.6%), lake / river (14, +5.2%) and mountain / Mt. Fuji (9, +4.2%) follow.
| View type (words in room name) | Properties | Median premium | Lower to upper quartile | Properties pricing the view side higher |
|---|---|---|---|---|
| City / night view (city view, night view, tower view, etc.) | 12 | +9.1% | +5.1% to +17.2% | 100.0% |
| Sea (ocean view, sea side, bay view, etc.) | 37 | +5.8% | −0.7% to +10.3% | 62.2% |
| High floor (high floor, upper floor, etc.) | 40 | +5.6% | 0.0% to +11.1% | 75.0% |
| Lake / river (lake view, river side, stream side, etc.) | 14 | +5.2% | +1.5% to +7.7% | 78.6% |
| Mountain / Mt. Fuji (mountain view, Fuji side, etc.) | 9 | +4.2% | 0.0% to +9.4% | 66.7% |
| Other (view, panorama, view bath, etc.) | 39 | +7.6% | 0.0% to +13.3% | 71.8% |
For sea views the lower quartile is negative, so pricing policy is split by property. At seaside resorts many rooms face the sea, and “sea side” is often sold as the standard room. City night views, by contrast, change greatly with orientation even within the same building, which likely makes them easier to price as a premium. From a design standpoint, the more a location creates view scarcity within the property, the more an investment in view-side rooms tends to show up in price.
The More Reviews Mention the View, the Smaller the In-Property Premium
Next we looked at the relationship with guest reviews. Semantic analysis of 8,518,666 reviews (42,363 properties) over the latest 24 months compiled by the HotelBank Editorial Team shows that, across the 26,777 properties with 20 or more reviews, the median share of reviews speaking favourably about the room view (mention rate) is 8.1% at resort hotels (1,668 properties), 3.2% at ryokan (6,502), 2.4% at city hotels (1,182) and 0.5% at business hotels (7,721). Of these properties’ reviews, 62.4% touch on some aspect of the room.
Using this mention rate, we split the 727 properties above into three bands. At resort hotels, properties with a mention rate under 10% have an in-property premium of +6.8% and those at 10–25% +7.8%, whereas those at 25% or more stay at +2.7%. At ryokan too, properties at 25% or more are at +3.4%. Properties where the view comes up in 1 in 4 reviews or more are built to “sell the view across the whole property”, with many rooms sharing the same scenery, which leaves little room to differentiate between rooms.
| Type / view mention rate | Properties | In-property view premium (median) | Estimated settled ADR (median) |
|---|---|---|---|
| Resort, under 10% | 60 | +6.8% | ¥17,000 |
| Resort, 10–25% | 101 | +7.8% | ¥17,700 |
| Resort, 25%+ | 47 | +2.7% | ¥15,000 |
| Ryokan, under 10% | 134 | +5.6% | ¥19,200 |
| Ryokan, 10–25% | 107 | +6.6% | ¥18,500 |
| Ryokan, 25%+ | 48 | +3.4% | ¥17,700 |
| City, under 10% | 87 | +8.4% | ¥20,400 |
| City, 10–25% | 56 | +5.7% | ¥18,100 |
| City, 25%+ | 23 | +5.6% | ¥25,400 |
At resorts and ryokan, the estimated settled ADR level shows no pattern of rising with the mention band. The 25%+ band at city hotels (23 properties) is high at ¥25,400, but it includes many central high-rise hotels, so location weighs heavily. From this cross-sectional comparison it cannot be said that a property’s view reputation is added directly to its overall rate. The effect of views splits into a part that shows up as a premium between rooms and a part that shows up as reputation and drawing power, and the latter is hard to measure from price data alone. In investment decisions, it is conservative to base the payback on the former and treat the latter separately as upside.
For reference, below are the properties whose room views and bath views are mentioned most in reviews (in order of mention count). All are properties where the view is valued as central to the stay.
| Property (room view mentioned) | Mentions | Mention rate |
|---|---|---|
| APA Hotel & Resort Yokohama Bay Tower (アパホテル&リゾート〈横浜ベイタワー〉), Kanagawa | 2,301 | 20.1% |
| Candeo Hotels Osaka The Tower (カンデオホテルズ大阪ザ・タワー), Osaka | 1,712 | 34.2% |
| Kobe Meriken Park Oriental Hotel (神戸メリケンパークオリエンタルホテル), Hyogo | 1,519 | 33.1% |
| Biwako Otsu Prince Hotel (びわ湖大津プリンスホテル), Shiga | 1,354 | 40.9% |
| Yokohama Bay Hotel Tokyu (横浜ベイホテル東急), Kanagawa | 1,319 | 32.6% |
| THE BLOSSOM HIBIYA, Tokyo | 1,278 | 37.4% |
| New Otani Inn Yokohama Premium (ニューオータニイン横浜プレミアム), Kanagawa | 1,228 | 47.1% |
| Grand Prince Hotel Hiroshima (グランドプリンスホテル広島), Hiroshima | 1,075 | 30.3% |
| Grand Nikko Tokyo Bay Maihama (グランドニッコー東京ベイ 舞浜), Chiba | 1,041 | 12.9% |
| RIHGA Royal Hotel Hiroshima (リーガロイヤルホテル広島), Hiroshima | 1,025 | 28.5% |
| Property (bath view mentioned) | Mentions | Mention rate |
|---|---|---|
| La Vista Tokyo Bay (ラビスタ東京ベイ), Tokyo | 562 | 16.6% |
| Irago Ocean Resort (伊良湖オーシャンリゾート), Aichi | 444 | 17.3% |
| Aizu Higashiyama Onsen Onyado Toho (会津・東山温泉 御宿 東鳳), Fukushima | 360 | 12.3% |
| Minamisanriku Hotel Kanyo (南三陸ホテル観洋), Miyagi | 351 | 16.3% |
| Hakodate Yunokawa Onsen Umi to Akari (函館湯の川温泉 海と灯), Hokkaido | 344 | 15.7% |
| TAOYA Nikko Kirifuri (TAOYA日光霧降), Tochigi | 335 | 23.1% |
| Hotel Kusakabe Almeria (ホテルくさかべアルメリア), Gifu | 317 | 13.2% |
| Imagine Hotel & Resort Hakodate (イマジン ホテル&リゾート函館), Hokkaido | 314 | 13.7% |
| HOTEL & SPA Century Marina Hakodate (HOTEL&SPA センチュリーマリーナ函館), Hokkaido | 302 | 7.6% |
| Atami Tsukiemon (熱海月右衛門), Shizuoka | 289 | 22.1% |
Distribution of the 151 Size-Matched Properties — Clustered in Cities and Along Coasts
The map shows the locations of the 151 properties where a size-matched comparison was possible. Blue marks properties pricing the view side higher; grey marks those pricing it the same or lower. By prefecture, Hokkaido (19) and Okinawa (18) lead, followed by Tokyo and Kanagawa (10 each), Shizuoka (9), Osaka (7) and Chiba (6). The distribution splits into two types: resorts overlooking the sea or lakes, and high-rise hotels in cities. Individual property names are not shown.
Illustration 1: The Ceiling on Spending to Create One View Room — City ¥2.9M, Ryokan ¥0.94M
From here we recast the measured premium as an investment decision. Using the formula below, we worked back to the ceiling on what can be spent on design or renovation that adds one view-side room (enlarging openings, changing the window-side layout, swapping room orientation, installing a view bath, and so on).
Allowable Capex (10-year payback) = annual profit gain per room × 10 years
For the estimated settled ADR we used the median of properties where a size-matched comparison was possible (resort hotels ¥16,100, 48 properties; city hotels ¥19,400, 58; ryokan ¥17,600, 28). Occupancy is by accommodation type from the Japan Tourism Agency’s Overnight Travel Statistics Survey, 2025 annual figures (final): resort hotels 56.9%, city hotels 74.1%, ryokan 38.2%. The premium rate was set two ways: each type’s median and upper quartile.
As a result, at the median premium and a 10-year payback benchmark, the ceiling per room is about ¥2.9M for city hotels, about ¥1.93M for resort hotels and about ¥0.94M for ryokan. A plan that can capture the upper-quartile premium widens these to about ¥4.2M, ¥3.49M and ¥1.57M respectively. The premium per night is not very different — about ¥1,300 for city, ¥1,200 for resort and ¥800 for ryokan — but the difference in occupancy feeds straight into annual profit, so the allowable amount differs by about 3x between city hotels and ryokan.
| Additional construction cost per room (assumed) | Resort hotels | City hotels | Ryokan |
|---|---|---|---|
| ¥500,000 | 2.6 yrs | 1.7 yrs | 5.3 yrs |
| ¥1M | 5.2 yrs | 3.5 yrs | 10.6 yrs |
| ¥2M | 10.4 yrs | 6.9 yrs | 21.2 yrs |
| Reference: annual profit gain per room | ¥193,000 | ¥290,000 | ¥94,000 |
Allowable Capex moves by the same proportion whichever of the premium rate or occupancy shifts. Holding the city hotel estimated settled ADR (¥19,400) fixed, the table shows allowable Capex (10-year payback) as the premium rate and occupancy vary. The roughly ¥2.9M shown in the text is the combination of a +6.9% premium and 74.1% occupancy (2025, Japan Tourism Agency final figures) — the shaded cell.
| Premium rate vs. room occupancy | 60% | 65% | 70% | 74.1% (city actual) | 80% |
|---|---|---|---|---|---|
| +3.0% (downside) | ¥1.02M | ¥1.1M | ¥1.19M | ¥1.26M | ¥1.36M |
| +5.0% | ¥1.7M | ¥1.84M | ¥1.98M | ¥2.1M | ¥2.27M |
| +6.9% (mid, measured median) | ¥2.35M | ¥2.54M | ¥2.74M | ¥2.9M | ¥3.13M |
| +10.0% (upper quartile) | ¥3.4M | ¥3.68M | ¥3.97M | ¥4.2M | ¥4.53M |
| +13.0% | ¥4.42M | ¥4.79M | ¥5.15M | ¥5.46M | ¥5.89M |
The downside also deserves attention. In our measurements the lower quartile is −0.7% for sea views and 0.0% for high floors, so a quarter of properties cannot price the view side higher. If the premium stays at +3% and occupancy at 60%, allowable Capex shrinks to about ¥1.02M per room. That caps the spec at around ¥1M per room, such as enlarging openings; investments that reach into the structure, such as swapping room orientation or going single-loaded, cannot be recovered from the premium at this level.
Spending ¥2M per room at a ryokan means a simple payback of over 21 years. Comparing Wednesday and Saturday stay dates separately, the ryokan premium is +5.0% and +4.5% (237 properties) — little different — so there is not much room to widen the premium by day of week. When a ryokan invests in views, rather than changing every room uniformly, it is easier to shorten the payback horizon by focusing on a few rooms with especially good views, fitting them out as premium rooms and pushing the premium toward the upper quartile (+8.0%).
Illustration 2: Single-Loaded Corridor So Every Room Faces the View? On a Site at Its Floor-Area-Ratio Cap, 7.2 Rooms Are Lost
The biggest decision in new-build design is whether to go double-loaded, with rooms on both sides of the corridor, or single-loaded, with rooms on one side only so that every room faces the view. Taking a 100-room city hotel as an example, we estimated the payback period from the increase in gross floor area.
Assuming a room frontage of 3.6 m and a corridor width of 1.8 m, in a double-loaded layout rooms on both sides share the corridor, so each room bears about 3.24 m², whereas in a single-loaded layout each room bears about 6.48 m². Across 100 rooms that is an increase of about 324 m². The 2025 planned construction cost for hotels and ryokan based on the Ministry of Land, Infrastructure, Transport and Tourism’s Statistics on Building Construction Starts averages ¥1.952M per tsubo across all structure types (about ¥590,000 per m²); applying this, the additional construction cost is about ¥191M. In a double-loaded layout only half the rooms, 50, face the view, so dividing by the 50 rooms that newly face the view when single-loaded gives about ¥3.83M per room.
| Item (100-room city hotel, illustrative) | Site where floor area can be added | Site at its floor-area-ratio cap |
|---|---|---|
| Added corridor area from single-loading | approx. 324 m² | approx. 324 m² |
| Rooms newly on the view side | 50 rooms | approx. 43 rooms (room count falls) |
| Additional construction cost | approx. ¥191M | No added floor area |
| Effect on room count | 100 rooms kept | approx. 7.2 fewer rooms (assuming 45 m² gross floor area per room) |
| Annual revenue gain from the view premium | approx. ¥18.1M (premium +6.9%) | Shrinks from a ceiling of approx. ¥18.1M |
| Annual revenue lost from fewer rooms | — | approx. ¥37.8M |
| Payback period | 13.2 yrs (9.1 yrs at +10.0% premium) | Net annual revenue falls |
On a site where floor area can be added, single-loading pays back in 13.2 years at the median premium, or 9.1 years if the upper-quartile premium can be captured. On a site where the floor-area-ratio cap binds, however, the added corridor shows up not as extra floor area but as fewer rooms. Assuming 45 m² of gross floor area per room, about 7.2 rooms are lost, and their room revenue (about ¥37.8M a year) exceeds the revenue gained from the view premium (about ¥18.1M a year). On urban sites at their floor-area-ratio cap, a double-loaded layout that places premium rooms on the side with the better view tends to be the more rational choice than facing every room toward the view. Turner & Townsend expects Japanese construction costs to rise 5.3% in 2026 and 5.0% in 2027 (published March 2026), so the later construction starts, the more the additional cost grows. On sites that can use floor-area-ratio relaxation schemes for accommodation, the assumptions change, so those conditions should be reviewed alongside this estimate.
Illustration 3: A Panoramic Bath Pays Back Through Reputation, Not a Price Premium
Placing the main bath on the top floor or the side with the best view is not a facility recovered through a room premium. Because every guest uses the bath, its value cannot be carved out as a difference in room price. In reviews, the share of reviews speaking favourably about the view from the bath reaches about 6% at the top 10% of resort hotels and ryokan (resorts 5.8%, ryokan 5.9%). At the very top it exceeds 10%: 23.1% of reviews at TAOYA Nikko Kirifuri and 22.1% at Atami Tsukiemon mention the bath view.
The effect of this facility shows up largely in the property’s overall reputation and in bookings that name the property, so the payback period cannot be derived directly from this article’s price data. In investment decisions it is practical to evaluate the extra cost of a panoramic bath (dealing with structure, plumbing and loads when placing it on the top floor, for example) separately from the room view premium, as an investment that raises the drawing power of the whole property. A bath also keeps incurring renewal costs for circulation filters and piping after installation, which need to be budgeted alongside the initial cost.
Locations with view scarcity
In cities with night views, or buildings where the scenery changes greatly with orientation, the view side is easier to price higher. All 12 city / night-view properties are positive, with a median of +9.1%. Designs that place premium rooms on the view side offer an investment opportunity.
Property types with high occupancy
City hotels benefit from 74.1% occupancy (2025, Japan Tourism Agency final figures), giving allowable Capex of about ¥2.9M per room on a 10-year payback. A spec of around ¥1M per room, such as enlarging openings, pays back in 3.5 years in this illustration.
Properties that sell the view as a whole
At resorts and ryokan where the view comes up in 1 in 4 reviews or more, the in-property premium is +2.7–3.4%. The view works more as reputation for the whole property than as a room premium, and pairs well with investment in common areas such as a panoramic bath.
Summary — Judge View Investment by Splitting It into “What a Premium Recovers” and “What Reputation Delivers”
Comparing rooms within the same property with the same size and meal conditions, the view premium is a median +6.8%, a difference of about ¥2,300 per night. The top quarter of properties take +11.1% or more, and city views in particular were priced higher at every property. On the other hand, the more reviews mention the view, the smaller the in-property premium: the view works more as reputation for the whole property than as a room premium.
Recast as a design and investment decision, the ceiling recoverable from the room premium on a 10-year payback is about ¥2.9M per room for city hotels, about ¥1.93M for resort hotels and about ¥0.94M for ryokan (illustrative). A single-loaded new build facing every room toward the view pays back in 13.2 years on a site where floor area can be added, but on a site at its floor-area-ratio cap the loss of rooms weighs more. For developers and design firms, the starting point is a layout that places premium rooms on the side with the better view; for renovation investors and REIT managers, simply carving out view-side rooms in existing assets by room name and selling them separately offers headroom to capture a premium without additional works.
⚠ Note on future-date prices and estimates: The view premium is based on listed prices for October 2026 stay dates published on OTAs at the time of the survey (September 21, 2026), and changes as check-in approaches. The premium is a cross-sectional comparison within the same property and does not guarantee that a renovation will earn the same premium. Allowable Capex and payback periods are illustrative cases based on the stated assumptions (80% profit-retention share, 3.6 m frontage, 1.8 m corridor width, 45 m² gross floor area per room, etc.) and are simple calculations that do not account for discount rates, tax, depreciation, maintenance and replacement costs, or revenue lost to closure during works. Actual investment decisions require analysis based on specific site conditions and quotations.
References and Sources
■ Data sources
Listed prices (MetroEngines Research & Consulting; stay dates October 7, 10, 14 and 17, 2026; 2 guests per room, tax-incl.; surveyed September 21, 2026). Scope: 7,103 properties in total — all ryokan, resort hotels and city hotels with 30+ rooms, a random sample of 1,500 business hotels, and 65 properties with many view mentions in reviews. Of the 1,258 properties selling views by room name, 727 allowed a comparison (49,878 pairs) and 151 were size-matched (10,537 pairs). Estimated settled ADR covers the 12 finalized months from September 2025 to August 2026. Reviews: HotelBank Editorial Team research (NLP analysis of 8,518,666 reviews at 42,363 properties over the latest 24 months).
■ Estimation assumptions
Illustration 1: estimated settled ADR (resort about ¥16,100, city about ¥19,400, ryokan about ¥17,600; property medians of 12-month averages), premium rate (median: resort +7.2%, city +6.9%, ryokan +4.8% / upper quartile: +13.0%, +10.0%, +8.0%), room occupancy (2025 final figures: resort 56.9%, city 74.1%, ryokan 38.2%), 80% of added revenue retained as profit (an assumption allowing for sales commissions and similar deductions), simple 10-year payback. Illustration 2: 100 rooms, 3.6 m room frontage, 1.8 m corridor width, 45 m² gross floor area per room, construction cost ¥1.952M per tsubo (about ¥590,000 per m²), premium +6.9% (sensitivity +10.0%).
■ Limitations and caveats
(1) The premium is a cross-sectional comparison within the same property using listed prices for October 2026 stay dates published at the time of the survey (September 21, 2026), and does not show that a renovation will earn the same premium. (2) Allowable Capex and payback periods are simple-payback illustrations that exclude discount rates, tax, depreciation, maintenance and replacement costs, and revenue lost to closure during works. (3) Occupancy is the national average by property type (Japan Tourism Agency 2025 final figures) and differs from the occupancy of individual properties and locations; see the two-way table in the text for sensitivity. (4) The size-matched comparison covers a limited 151 properties, of which 13 are business hotels, so those are reference values. By view type, three groups have fewer than 15 properties. (5) Construction cost is an all-structure average per tsubo and varies with structure, region and timing of construction start (the outlook for construction cost inflation is +5.3% in 2026 and +5.0% in 2027). (6) The effect of common areas such as panoramic baths cannot be carved out as a room price difference, and no payback period is calculated for them from this article’s price data.
■ Market data
- MetroEngines Research & Consulting — listed prices, estimated settled ADR
- HotelBank Editorial Team research — NLP analysis of guest reviews (room views, bath views)
■ Government statistics and public data
- Japan Tourism Agency, Overnight Travel Statistics Survey (2025, annual figures, final)
- Ministry of Land, Infrastructure, Transport and Tourism, Statistics on Building Construction Starts (e-Stat)
■ Industry sources
- archi-book, “Hotel construction cost per tsubo” (2025 cost per tsubo by structure, based on the Statistics on Building Construction Starts)
- Turner & Townsend, “Trends shaping Japan’s construction market in 2026” (March 12, 2026) — construction cost inflation outlook: +5.6% in 2025, +5.3% in 2026, +5.0% in 2027