

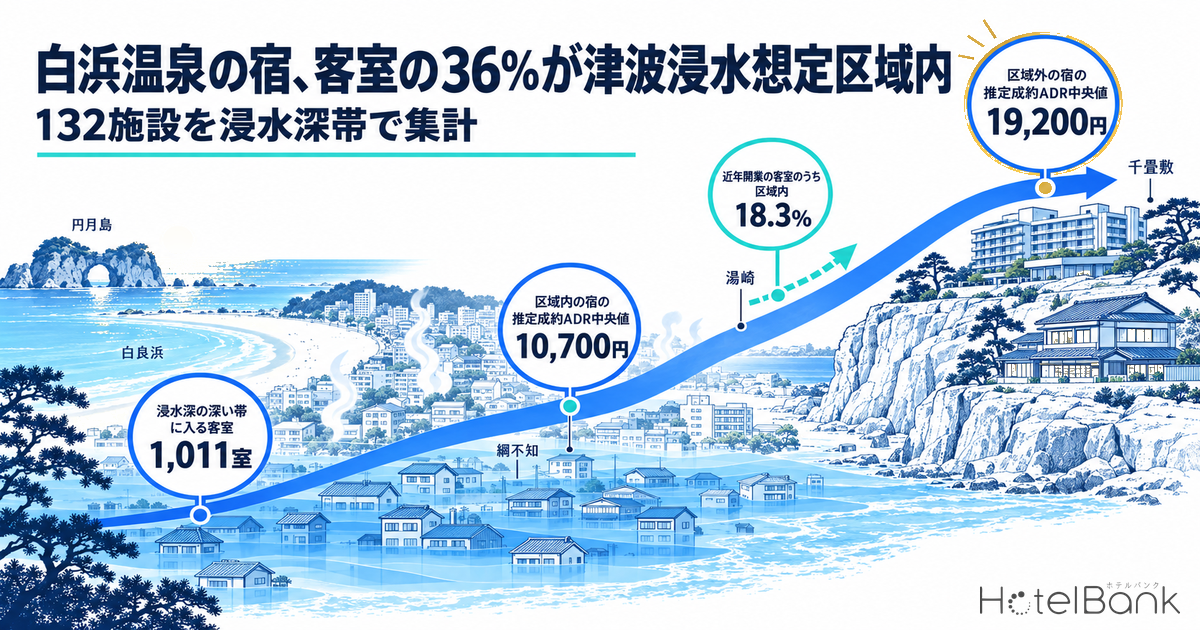
We overlaid the registered coordinates of lodging properties in the Shirahama Onsen area of Shirahama Town, Wakayama (around Shirarahama Beach, Yuzaki and Tsunashirazu) on the tsunami inundation zones designated by Wakayama Prefecture. The sample covers 132 properties with 3,040 rooms for which MetroEngines Research could confirm selling prices for stays in September–November 2026. Of these, 57 properties with 1,101 rooms (36.2% of rooms) sit inside the projected inundation zone. Rooms in areas with a projected inundation depth of 3m or more total 1,011, or 33.3% of the sample. By contrast, properties outside the zone have a higher median estimated settled ADR, and more than 80% of rooms at properties opened since 2017 are located outside the zone. This article tallies the distribution by inundation depth band and its relationship with property size, property type, rates, zoning and land prices, and sets out the design, insurance and BCP issues to consider when rebuilding or developing new properties.
Metric Definitions Used in This Article
- ADR (average daily rate): An estimated settled rate (tax-exclusive equivalent), calculated by applying a property-type adjustment factor to the lowest plan level each property publishes on OTAs (per room, two guests per room, tax-inclusive). Checked against property-level results disclosed by listed hotel REITs (91 properties, most recent three months), the median error is about 7%. These are estimates and differ from each property’s actual settled prices and accounting figures. Area-level ADR is the median of the properties in scope (the level of a typical property in the area).
- Tsunami inundation projection / depth bands: The tsunami inundation projection set by Wakayama Prefecture under the Act on Regional Development for Tsunami Disaster Prevention (an official projection assuming a maximum-class tsunami), obtained from the MLIT Real Estate Information Library (National Land Numerical Information, “Tsunami Inundation Projection”). Depth bands follow the categories in that dataset (0.3m to under 1m, 1m to under 2m, 2m to under 3m, 3m to under 5m, 5m to under 10m, etc.).
- Inside/outside the zone: Determined by whether each property’s registered coordinate (a single point) falls within an inundation polygon. Cases where only part of a site overlaps the zone, building height in floors, and ground elevation are not taken into account.
- Data sources: MetroEngines Research (properties and prices); MLIT Real Estate Information Library (tsunami inundation projections, sediment disaster warning zones, zoning, land prices, designated emergency evacuation sites)
- — 36.2%: Of the 132 properties and 3,040 rooms confirmed on sale in Shirahama Onsen (3km radius from the center), 57 properties with 1,101 rooms lie inside the tsunami inundation zone designated by Wakayama Prefecture.
- — 1,011 rooms: Most rooms inside the zone fall in the 3m-or-deeper bands, with 757 rooms (24.9% of rooms in scope) in the 5m-plus band alone. The shallow bands under 3m account for just 9 properties and 90 rooms.
- — ¥19,200 vs ¥10,700: The property-level median estimated settled ADR (Sep 2025–Aug 2026, N=50) outside the zone is about 1.8 times that inside the zone. Higher-priced properties cluster on the coastal terraces from Yuzaki to Senjojiki.
- — 18.3%: Of the 930 rooms at properties opened since 2017, 170 are inside the zone — a sharp drop from 44.4% for properties opened in 2016 or earlier.
- — ¥14,800: Shirahama Town’s estimated settled ADR (12-month average) is the highest among southern Kii (Nanki) coastal municipalities with 15 or more properties in scope, and about 1.5 times the Wakayama prefectural figure (¥9,700).
Key Points — Inundation Zones Concentrate on the Flatland Behind Shirarahama; Higher-Priced Properties Sit on the Terraces
We start with the conclusions. First, roughly one-third of the rooms at lodging properties in the Shirahama Onsen area lie in zones with a projected inundation depth of 3m or more. This reflects the historical pattern in which onsen ryokan and minshuku (family-run guesthouses) clustered on the flat town area behind Shirarahama Beach and the lowlands along Tsunashirazu Bay. Second, the intuition that “the higher-priced seafront properties are the ones most exposed to inundation” is not supported by the data. The median estimated settled ADR is ¥19,200 for properties outside the zone and ¥10,700 for those inside, with many high-priced ryokan and resorts located on the coastal terraces from Yuzaki to Senjojiki. Third, newer supply increasingly chooses sites outside the zone. Of the 930 rooms at properties opened since 2017, only 170 (18.3%) are inside the zone, a marked decline from properties opened in 2016 or earlier (44.4%).
From an investment perspective, existing properties inside the zone enjoy the locational value of being at the heart of the onsen town and right next to the beach. When rebuilding or undertaking major renovations, building vertical evacuation capacity, placing power-receiving and transformer equipment on upper floors, structuring insurance and incorporating a BCP into the business plan can help preserve that locational value over the long term. Terrace sites outside the zone have been chosen to absorb new supply, and their price levels back that up. The figures are reviewed in turn below.
Scope and Method
The study area is a 3km radius centered on the core of Shirahama Onsen in Shirahama Town (33.68°N, 135.355°E). This radius covers Shirarahama, Yuzaki, Senjojiki, Tsunashirazu, Higashi-Shirahama and part of Katata. MetroEngines Research’s property master lists 190 properties with 4,156 rooms in this radius as of 2026, based on opening and closing dates. Because this includes properties that are closed or whose sales activity could not be confirmed, this article tallies the 132 properties and 3,040 rooms for which selling prices could be confirmed for stays in September–November 2026.
The tsunami inundation projection was obtained from the public data of the MLIT Real Estate Information Library in map-tile units (zoom level 15), yielding 3,786 inundation polygons within the tiles where the sampled properties are located. We determined which inundation-depth polygon contains each property’s registered coordinate and tallied the number of properties and rooms by depth band. Note that the tsunami inundation projection is an official government projection assuming a maximum-class tsunami and does not indicate when or how often such an event will occur. The tallies in this article are intended to characterize locations and do not assess the safety of any individual property.
Properties and Rooms by Inundation Depth Band — 757 Rooms in the 5m-Plus Band
By depth band, the largest group is outside the zone, at 75 properties and 1,939 rooms (63.8%). Inside the zone, the 5m-to-under-10m band is the largest at 28 properties and 757 rooms, followed by the 3m-to-under-5m band at 20 properties and 254 rooms. The shallow bands from 0.3m to under 3m total just 9 properties and 90 rooms. In other words, in Shirahama Onsen most properties inside the inundation zone sit not on its “shallow edges” but in its “deep core.” The flatland behind Shirarahama is low-lying, so properties that fall within the zone tend to fall into the deeper bands.
| Depth band (tsunami inundation projection) | Properties | Rooms | Share of rooms | Rooms per property |
|---|---|---|---|---|
| Outside zone | 75 | 1,939 | 63.8% | 25.9 |
| 0.3m to under 1m | 4 | 42 | 1.4% | 10.5 |
| 1m to under 2m | 3 | 43 | 1.4% | 14.3 |
| 2m to under 3m | 2 | 5 | 0.2% | 2.5 |
| 3m to under 5m | 20 | 254 | 8.4% | 12.7 |
| 5m to under 10m | 28 | 757 | 24.9% | 27.0 |
| Inside zone, total | 57 | 1,101 | 36.2% | 19.3 |
| Total | 132 | 3,040 | 100.0% | 23.0 |
The skew of the distribution toward deeper bands bears directly on design policy for rebuilding and renovation. The table below shows how the number of properties and rooms in zones at or above a given depth changes as the threshold moves from 0.3m to 5m. Even if raising floor levels or moving equipment to upper floors could address inundation of up to 1–2m, the rooms remaining in the deeper bands would total 1,016–1,059, barely below the zone-wide total (1,101 rooms). The point at which the affected room count drops significantly is 5m: the 1,011 rooms at 3m or more fall to 757 at 5m or more. Inside the zone in Shirahama Onsen, designs that provide evacuation space on upper floors are more likely to be the central issue than approaches that avoid inundation by raising the building.
| Projected depth threshold | Affected properties | Affected rooms | Share of rooms in scope |
|---|---|---|---|
| 0.3m or more (entire zone) | 57 | 1,101 | 36.2% |
| 1m or more | 53 | 1,059 | 34.8% |
| 2m or more | 50 | 1,016 | 33.4% |
| 3m or more | 48 | 1,011 | 33.3% |
| 5m or more | 28 | 757 | 24.9% |
On the Map — Inundation Zones, Lodging and Designated Tsunami Evacuation Sites
The map below divides the tsunami inundation projection into a roughly 100m mesh and shades each cell by the depth band at its center point (darker means deeper). White circles are the sampled lodging properties (circle size reflects room count), and gray diamonds are the sites Shirahama Town has published as designated emergency evacuation sites for tsunamis. The inundation zone extends continuously across the flatland from behind Shirarahama to Tsunashirazu Bay, while it barely touches the coastal terraces on the Yuzaki–Senjojiki side or the hills of Katata. The distribution of lodging follows this topography, with small and mid-sized properties packed into the commercial district behind Shirarahama.
Of the 60 designated tsunami evacuation sites within the 3km radius, 54 are on high ground, school grounds or temple and shrine precincts outside the inundation zone. The remaining 6 are inside the zone, and 4 of these are buildings in the 5m-plus band — designations that can be read as premised on evacuation to upper floors (vertical evacuation). Several of the designated sites carry the names of lodging properties, showing that hotel buildings play a role in the local evacuation system.
Differences by Size — 47.5% of In-Zone Rooms Are at Four Properties With 100+ Rooms
Broken down by room count, the composition differs inside and outside the zone. Large properties with 100 or more rooms number 4 (523 rooms) inside the zone and 6 (866 rooms) outside. These 4 properties account for 47.5% of the 1,101 rooms inside the zone, meaning about half of in-zone rooms are concentrated at large properties. Mid-sized properties with 30–99 rooms are few inside the zone (2 properties, 125 rooms) and more common outside (11 properties, 644 rooms). Among small-to-mid properties with 10–29 rooms, the split is roughly even, with 20 properties and 329 rooms inside versus 16 properties and 306 rooms outside. Small lodgings with 1–9 rooms (minshuku, vacation rentals, guesthouses, etc.) number 31 properties with 124 rooms inside the zone and 42 properties with 123 rooms outside.
These differences also matter for evacuation planning. Large properties are generally mid- to high-rise reinforced concrete buildings and can more readily offer evacuation to upper floors within the building. Small lodgings with 1–9 rooms and whole-house rentals, on the other hand, tend to be low-rise, so their plans are more likely to assume moving to designated evacuation sites on high ground (horizontal evacuation). The 31 small lodgings inside the zone make up more than half of all in-zone properties by count, so soft measures such as guiding guests along evacuation routes and providing information in multiple languages offer substantial room for small lodgings to strengthen their reliability.
Crossing depth band with property size makes the in-zone composition even clearer. Of the 4 large in-zone properties with 100+ rooms, 3 (423 rooms) lie in the 5m-plus band, accounting for 55.9% of the 757 rooms in that band. Meanwhile, no property with 30 or more rooms falls in the shallow bands under 3m; all 9 properties there have 29 rooms or fewer. Of the 31 small in-zone lodgings with 1–9 rooms, 14 are in the 5m-plus band, and for buildings without upper floors, horizontal evacuation to high ground is the default. Depending on the combination of size and depth, the measures available vary widely even among properties that are all “inside the zone.”
| Depth band \ Property size | 1–9 rooms | 10–29 rooms | 30–99 rooms | 100+ rooms | Total |
|---|---|---|---|---|---|
| Outside zone | 42 props / 123 rms | 16 props / 306 rms | 11 props / 644 rms | 6 props / 866 rms | 75 props / 1,939 rms |
| Inside zone, under 3m | 6 props / 27 rms | 3 props / 63 rms | — | — | 9 props / 90 rms |
| Inside zone, 3–5m | 11 props / 33 rms | 7 props / 81 rms | 1 prop / 40 rms | 1 prop / 100 rms | 20 props / 254 rms |
| Inside zone, 5m+ | 14 props / 64 rms | 10 props / 185 rms | 1 prop / 85 rms | 3 props / 423 rms | 28 props / 757 rms |
| Total | 73 props / 247 rms | 36 props / 635 rms | 13 props / 769 rms | 10 props / 1,389 rms | 132 props / 3,040 rms |
By property type, 21 of the 36 ryokan (720 of 1,352 rooms, or 53.3%) are inside the zone, making ryokan the type with the most in-zone rooms. Only 4 of the 16 resort hotels (138 of 895 rooms, 15.4%) are inside the zone, as many sit on the terraces. Of the 15 minshuku (134 rooms), 10 properties with 78 rooms are inside the zone, suggesting many remain in the traditional lodging quarter behind Shirarahama.
| Property type | Properties | Rooms | In-zone properties | In-zone rooms | In-zone room share |
|---|---|---|---|---|---|
| Ryokan | 36 | 1,352 | 21 | 720 | 53.3% |
| Resort hotel | 16 | 895 | 4 | 138 | 15.4% |
| Deluxe hotel | 2 | 267 | 1 | 85 | 31.8% |
| Minshuku | 15 | 134 | 10 | 78 | 58.2% |
| Auberge | 3 | 80 | 1 | 5 | 6.3% |
| Hostel / guesthouse | 14 | 107 | 3 | 10 | 9.3% |
| Pension | 8 | 37 | 4 | 18 | 48.6% |
| Vacation rental / cottage / campground | 33 | 87 | 9 | 16 | 18.4% |
| Business hotel / other | 5 | 81 | 4 | 31 | 38.3% |
| Total | 132 | 3,040 | 57 | 1,101 | 36.2% |
Relationship With Rates — Median Estimated Settled ADR of ¥19,200 Outside the Zone
Next, we examine the relationship between inundation exposure and room rates. We took the 50 properties (31 ryokan, 16 resort hotels, 3 business hotels) for which an estimated settled ADR was available for at least 6 of the 12 months from September 2025 to August 2026, calculated each property’s period average, and compared the medians by depth band. The median for the 25 properties outside the zone was ¥19,200 versus ¥10,700 for the 25 inside, putting outside-zone properties at roughly 1.8 times the level. Within the zone, the median was ¥9,100 for under 3m (4 properties), ¥10,700 for 3m to under 5m (7 properties) and ¥12,200 for 5m and above (14 properties) — all below the outside-zone figure.
Comparing ryokan only, to remove differences in property-type mix, the median is ¥21,400 for the 13 outside the zone versus ¥11,200 for the 18 inside. Room-weighted averages point the same way, at ¥19,800 outside and ¥15,500 inside. The terraces from Yuzaki to Senjojiki host many high-end ryokan and resorts with rooms and open-air baths overlooking the Pacific, and the added value of these views appears to be reflected in their rates. Properties inside the inundation zone are close to Shirarahama Beach and the center of the onsen town, offering convenient beach access and walkability at affordable price points — they can be seen as supporting the depth of Shirahama Onsen’s price range.
The estimated settled ADR for Shirahama Town as a whole averaged ¥14,800 over the 12 months from September 2025 to August 2026. On a monthly basis, the low was ¥11,800 in June 2026 and the high ¥17,400 in December 2025. The January–August 2026 average was ¥14,600, up 6.9% from the same period a year earlier (¥13,600), indicating an upward trend. By month, January 2026 rose sharply at +23.2% YoY, while June was -7.7% YoY and August -1.9% YoY. The seasonality of higher rates during the summer holidays and the year-end/New Year period is clear, reflecting the demand structure of a beach resort.
To compare area-level rates with the surrounding region, we lined up the estimated settled ADR for southern Kii coastal municipalities and Wakayama Prefecture as a whole over the same period. Shirahama Town’s 12-month average of ¥14,800 is the highest among municipalities with 15 or more properties in scope, above Nachikatsuura Town (¥12,900) and Tanabe City (¥12,000), and about 1.5 times the prefectural figure (¥9,700). Its January–August 2026 YoY change of +6.9% also outpaced the prefecture (+2.6%). All of these are coastal municipalities that include tsunami inundation zones, and in Shirahama, inundation exposure does not show up as a drag on area-wide rates. The rate gap between inside and outside the zone is more naturally read as reflecting differences in location within the town (the flatland behind Shirarahama versus the terraces).
| Municipality / area | 12-month average | Peak month | Lowest month | Jan–Aug 2026 YoY | Properties in scope (monthly) |
|---|---|---|---|---|---|
| Shirahama Town | ¥14,800 | ¥17,400 (Dec 2025) | ¥11,800 (Jun 2026) | +6.9% | 54–59 |
| Nachikatsuura Town | ¥12,900 | ¥16,800 (Aug 2026) | ¥9,500 (Jun 2026) | +9.3% | 15 |
| Tanabe City | ¥12,000 | ¥13,800 (Aug 2026) | ¥10,700 (Jun 2026) | +1.9% | 28–30 |
| Susami Town (reference) | ¥21,900 | ¥34,600 (Jan 2026) | ¥16,300 (Jun 2026) | -5.5% | 5 |
| Kushimoto Town (reference) | ¥7,500 | ¥8,900 (Feb 2026) | ¥6,400 (Jun 2026) | +6.4% | 4–7 |
| Wakayama Prefecture (all) | ¥9,700 | ¥11,800 (Aug 2026) | ¥7,900 (Jun 2026) | +2.6% | 210–227 |
Supply Trends — More Than 80% of Rooms Added Since 2017 Are Outside the Zone
Based on opening and closing dates in the property master, the number of properties and rooms within the 3km radius grew from 97 properties and 2,531 rooms in 2012 to 190 properties and 4,156 rooms in 2026. Rooms increased by about 1,100 in 2017–2019 in particular, reflecting a run of large property openings during that period. Since 2020, the room count has been roughly flat, and growth in the number of properties has been driven mainly by small properties such as vacation rentals and guesthouses.
Splitting the 132 sampled properties by opening period, of the 56 properties and 930 rooms opened since 2017, only 23 properties and 170 rooms (18.3% of rooms) are inside the zone. For the 58 properties and 2,044 rooms opened in 2016 or earlier, 29 properties and 907 rooms (44.4%) are inside the zone, showing a clear tendency for newer supply to locate outside it. By property count, there have also been 23 new openings inside the zone, but many of these are whole-house rentals and small lodgings; the large blocks of rooms have gone to the terraces and hills. This can be read as site selection being reflected to some degree in development decisions since the tsunami inundation projections were published.
This chart is based on properties confirmed as listed on OTAs. Only about 19% of properties are listed on OTAs before opening, and more than half are listed after opening, so counts for the most recent months and years may increase as further listings appear. We recommend referring to it alongside the building-plan pipeline based on building confirmation applications (MLIT “Building Starts Statistics”).
| Opening period (property master) | Properties | Rooms | In-zone properties | In-zone rooms | In-zone room share |
|---|---|---|---|---|---|
| 2016 or earlier | 58 | 2,044 | 29 | 907 | 44.4% |
| 2017 or later | 56 | 930 | 23 | 170 | 18.3% |
| Opening date unknown | 18 | 66 | 5 | 24 | 36.4% |
Zoning and Land Prices — 65% of Properties in Commercial Zones Are Inside the Inundation Zone; Commercial Land Prices Flat
We also checked the overlap with zoning. Commercial zones with a 400% floor area ratio host 46 sampled properties with 1,238 rooms, of which 30 properties and 526 rooms are inside the inundation zone (65.2% by property count). The commercial zone is designated over the center of the onsen town behind Shirarahama; while its high floor area ratio leaves room for redevelopment, sites there tend to overlap the inundation zone. Category II residential zones (200% FAR) contain 30 properties with 1,185 rooms, 13 properties and 477 rooms of which are inside the zone. Many large properties are spread across residential and commercial zones.
| Zoning district (floor area ratio) | Properties | Rooms | In-zone properties | In-zone rooms |
|---|---|---|---|---|
| Commercial (400%) | 46 | 1,238 | 30 | 526 |
| Neighborhood commercial (200%) | 3 | 229 | 0 | 0 |
| Category II residential (200%) | 30 | 1,185 | 13 | 477 |
| Category I residential (200%) | 32 | 192 | 10 | 51 |
| Category I/II mid-high-rise exclusive residential (200%) | 19 | 194 | 4 | 47 |
| Category I low-rise exclusive residential (50–80%) | 2 | 2 | 0 | 0 |
For land prices, we tracked five official land price and prefectural land price survey points within the radius since 2019. The two commercial points at the center of the onsen town (Shirahama Aza Kamibori, prefectural land price survey; Shirahama Aza Hamadori, official land price) both lie in the 3m-to-under-5m inundation band, at ¥76,200 and ¥64,100 per ㎡ in 2026. Declines since 2019 were limited to 1.5–3.3%, and prices have been flat to slightly rising since 2023. The three residential points outside the zone range from ¥30,700 to ¥38,600, also showing only small movements. That commercial land prices inside the inundation zone have not collapsed indicates that the market continues to recognize the locational value of the onsen town center.
Supplementary Indicator — 24 Properties and 355 Rooms in Sediment Disaster Warning Zones
Because Shirahama Onsen’s coastal terraces and hills run close to the sea, we also checked sediment disaster warning zones separately from tsunami exposure. Of the 132 sampled properties, 24 properties with 355 rooms are located in sediment disaster warning zones (some in special warning zones), and 12 properties with 133 rooms of these also overlap the tsunami inundation zone. For sites near the edges of terraces or slopes, the high ground that serves as a tsunami evacuation destination and the management of sloped land become linked issues. In investment decisions, it is useful to check both hazards — tsunami and sediment disasters — on the same map, and to compare multiple hazards alongside rates and disaster-prevention investment at the trade-area level.
Implications for Investment — Design, Insurance and BCP Issues That Change by Depth Band
Based on the tallies so far, lodging assets in Shirahama Onsen can be organized into three broad zones. The following summarizes, for each combination of depth band and location, the issues worth considering when rebuilding, renovating or acquiring.
Outside the zone (terraces and hills)
75 properties, 1,939 rooms / median ADR ¥19,200
Many high-priced properties make the most of their views, and more than 80% of rooms added since 2017 are here. Sites are often near slopes, so the key checks are whether a sediment disaster warning zone applies and whether access roads pass through low-lying areas.
Inside the zone, under 3m
9 properties, 90 rooms
A band with relatively shallow projected inundation, mainly small lodgings. When rebuilding, combining a raised ground-floor level with placing equipment and supplies on upper floors may shorten the time needed to reopen.
Inside the zone, 3m+
48 properties, 1,011 rooms
The band with the highest locational value, at the center of the onsen town and right by the beach. For large properties, building into the business plan a design that positions upper floors as evacuation space, upper-floor placement of power-receiving/transformer equipment and emergency generators, and an evacuation guidance plan for guests makes it easier to sustain locational value over the long term.
| Issue | Outside zone (terraces) | Inside zone, under 3m | Inside zone, 3m+ |
|---|---|---|---|
| Building design | Check condition of slopes and retaining walls; provide redundant access routes | Raise floor levels; use the ground floor for parking, lobby, etc. | Secure evacuation space on upper floors; verify the structure’s resistance to wave forces |
| Equipment placement | Check emergency power capacity | Place power-receiving/transformer equipment and machine rooms on upper floors | Move power-receiving/transformer equipment, emergency generators and water supply equipment to upper floors |
| Insurance / finance | Check the scope of earthquake insurance and sediment disaster coverage | Check the scope of coverage and deductibles for earthquake and tsunami damage | Design coverage scope, payment limits and business continuity cost coverage |
| BCP / operations | Leverage the high-ground location as a community reception base | Guidance plans to nearby evacuation sites; multilingual information | Operating procedures for vertical evacuation; coordination with the local evacuation system |
The timing of a rebuild or major renovation is the most effective opportunity to build these issues into the business plan. Large properties in the 3m-plus band in particular also hold value as local disaster-prevention infrastructure, since their upper floors can serve as evacuation space for guests and nearby residents. Indeed, within the radius there are cases where hotel buildings have been designated as tsunami emergency evacuation sites. Because insurance premiums and the scope of coverage vary widely with a building’s structure, age and location, it is useful in acquisition due diligence to share the inundation depth band as a precondition with insurers and designers at an early stage.
Summary
In the Shirahama Onsen area, 57 properties with 1,101 rooms (36.2%) of the 132 properties and 3,040 rooms confirmed on sale lie inside the tsunami inundation zone designated by Wakayama Prefecture, most of them in bands with a projected depth of 3m or more. About half of in-zone rooms are concentrated at four large properties with 100+ rooms, while by property count, small lodgings with 1–9 rooms predominate. On rates, the median estimated settled ADR of properties outside the zone (¥19,200) exceeds that of properties inside (¥10,700), and higher-priced properties are concentrated on the coastal terraces. More than 80% of rooms added since 2017 have chosen sites outside the zone, signaling a shift in where new supply locates.
The locational value of Shirarahama Beach and the onsen town center is also reflected in land prices, with commercial land prices inside the zone holding flat. To make the most of this locational value over the long term, the key is to structure design, equipment placement, insurance and BCP around the inundation depth band at the rebuilding or acquisition stage. The inundation projection is an official maximum-class scenario, and we hope readers will use the tallies in this article as material for understanding the characteristics of each location.
Note on methodology: The tsunami inundation projection in this article is the projection set by Wakayama Prefecture under the Act on Regional Development for Tsunami Disaster Prevention (assuming a maximum-class tsunami), obtained via the MLIT Real Estate Information Library. It does not indicate the timing or frequency of occurrence or damage to individual buildings. Inside/outside classification is based on a single registered coordinate per property and does not consider building height, ground elevation or site shape. For the latest hazard maps and evacuation information, please refer to the official information from Shirahama Town and Wakayama Prefecture. Estimated settled ADR uses finalized months only (September 2025–August 2026).
References and Sources
■ Data sources
Property and price data from MetroEngines Research & Consulting (3km radius from the center of Shirahama Onsen [33.68°N, 135.355°E]; 132 properties and 3,040 rooms confirmed on sale for stays in Sep–Nov 2026; 190 properties and 4,156 rooms in the property master). Hazard, urban planning and land price data from the MLIT Real Estate Information Library (tsunami inundation projection [set by Wakayama Prefecture], sediment disaster warning zones, zoning, official land prices and prefectural land price survey, designated emergency evacuation sites). Rates are estimated settled ADR (finalized months from Sep 2025 to Aug 2026 for Shirahama Town, southern Kii coastal municipalities and Wakayama Prefecture).
■ Calculation assumptions
Inside/outside classification and depth bands were determined by which category of inundation polygon (3,786 polygons obtained in zoom-level-15 map tiles) contains each property’s single registered coordinate. Property-level estimated settled ADR uses the period average for the 50 properties with values for at least 6 of the 12 months, and medians were compared by depth band. Table 2 shows affected properties and rooms when the projected depth threshold is varied from 0.3m to 5m; Table 3 is a cross-tabulation of depth band and property size band.
■ Limitations and caveats
Building height, structure, ground elevation and site shape are not considered. The tsunami inundation projection is an official projection assuming a maximum-class tsunami and does not indicate the timing or frequency of occurrence or damage to individual buildings. Because the sample is based on confirmed sales, properties that are closed or whose sales activity could not be confirmed are excluded. Property-level ADR is N=50, and the under-3m band (N=4) is for reference only. Estimated settled ADR for Susami Town and Kushimoto Town is treated as reference only, as fewer than 10 properties are in scope.
■ Market data
- MetroEngines Research & Consulting — Property master (3km radius, 190 properties / 4,156 rooms), selling prices (N=132 properties, 3,040 rooms), estimated settled ADR (Shirahama Town; property-level N=50)
■ Government statistics and public data
- MLIT Real Estate Information Library (国土交通省 不動産情報ライブラリ) — Tsunami inundation projection (set by Wakayama Prefecture), sediment disaster warning zones, zoning, official land prices and prefectural land price survey, designated emergency evacuation sites
- MLIT National Land Numerical Information download site (国土数値情報ダウンロードサイト) — Tsunami inundation projection data
- Wakayama Prefecture, “Tsunami Inundation Projection Maps for a Nankai Trough Megaquake (2013)” (南海トラフ巨大地震の津波浸水想定図(H25))
- Wakayama Prefecture, “On the Designation of Tsunami Disaster Warning Zones” (津波災害警戒区域の指定について)
- Shirahama Town, “Shirahama Town Tsunami Hazard Map” (白浜町津波ハザードマップ)
- MLIT, “About the Act on Regional Development for Tsunami Disaster Prevention” (津波防災地域づくりに関する法律について)