

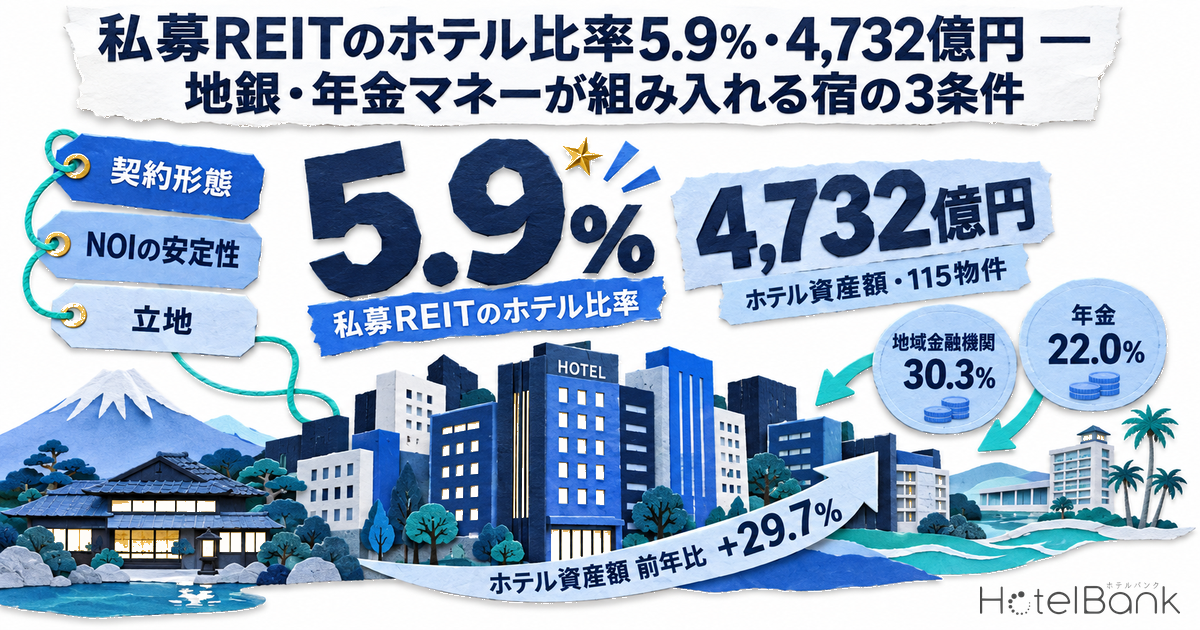
According to The Association for Real Estate Securitization (ARES)’s Private REIT Quarterly No.43 (as of end-June 2026), total assets of private REITs stood at ¥8.07 trillion (¥8,066.5bn), up 11.3% year on year. Hotels account for ¥473.2bn across 115 properties, a share of just 5.9%. But hotel assets grew 29.8% in a year — 2.6 times the pace of the total (+11.3%). By investor, regional financial institutions hold 30.3%, central financial institutions 27.0%, pension funds 22.0% and operating companies and others 20.7%, so the shape of return they need differs from listed REITs, whose unit prices move every day. In this article we compare the scale with the 300 domestic properties of the seven listed hotel REITs, then set out the conditions that make a hotel easy for a private REIT to acquire along three axes: lease structure, NOI stability and location.
Metric Definitions Used in This Article
- ADR (average daily rate): an estimated settled rate (tax-excluded equivalent), calculated by applying a property-type correction factor to the lowest-priced plan each property publishes on OTAs and similar channels (two guests per room, per-room rate, tax included). Checked against property-level results disclosed by listed hotel REITs (91 properties, most recent 3 months), the median error is about 7%. These are estimates and differ from each property’s actual settled prices and accounting figures. Area-level ADR is the median of the properties covered (the level of a typical property in the area).
- Seasonal amplitude: for the 12 months from September 2025 to August 2026, (highest month − lowest month) ÷ 12-month average of monthly ADR. Months in which the number of properties covered fell below 60% of the series median were excluded. This is a first-order approximation for gauging seasonal swings in NOI and does not include seasonal variation in OCC (occupancy).
- Private REIT: following the ARES definition, an unlisted, open-ended investment corporation with no fixed investment term (61 corporations as of end-June 2026). Total assets are the sum of the acquisition prices of the properties held.
- Data sources: The Association for Real Estate Securitization (ARES), MetroEngines Research & Consulting
- — Private REIT total assets are ¥8.07 trillion (end-June 2026). Hotels are ¥473.2bn across 115 properties, a share of only 5.9%, but grew 29.8% in a year and roughly doubled in four years.
- — Investors: regional financial institutions 30.3%, pension funds 22.0%. Pension capital grew about 1.75-fold in four years (our estimate), and it needs stable income with predictable distributions every period.
- — The seven listed hotel REITs hold 300 properties worth ¥1.80 trillion in Japan. They are weighted towards Kanto and Kyushu-Okinawa, and mostly use variable rent to capture upside in room rates.
- — Seasonal amplitude of estimated settled ADR: business hotels 22.0%, resorts 43.4% (September 2025–August 2026, prefecture median). Twelve regional prefectures with amplitude within 15% and 15,000+ rooms lend themselves to fixed rent.
- — In a 150-room model, a 20% fall in revenue cuts variable-rent NOI by −36.9% while fixed-rent NOI is unchanged. But GOP ÷ rent drops to 1.04x, so the stability of fixed rent depends on rent-paying capacity.
Private REITs total ¥8.07 trillion; hotels doubled in four years to ¥473.2bn
In the 43rd survey published by ARES on July 31, 2026, private REITs comprised 61 investment corporations and 2,244 properties, with total assets of ¥8,066.5bn. That is up ¥94.3bn (+1.2%) on the previous quarter and ¥816.6bn (+11.3%) year on year. By use, offices account for ¥2,834.2bn (35.1%), rental housing ¥1,784.2bn (22.1%), logistics ¥1,583.0bn (19.6%), retail ¥1,217.9bn (15.1%), hotels ¥473.2bn (5.9%) and other ¥173.9bn (2.2%), making hotels the fifth largest of the six categories.
The growth rate tells a different story. Lining up the end-June issue of each year, hotel assets almost doubled in four years, from ¥240.8bn in 2022 to ¥473.2bn in 2026 (+96.5%). The number of properties also rose from 59 to 115. The share dipped to 4.4% in 2024 but recovered to 5.9% over the following two years, the highest level in the four-year period. The average acquisition price per property is ¥4.11bn (¥473.2bn ÷ 115 properties), almost the same as in 2022 (¥240.8bn ÷ 59 properties = ¥4.08bn). In other words, the share did not jump because one large property was added; it is the result of stacking up properties in the same size band.
| Reference date (issue) | Investment corporations | Total assets | Hotel assets | Hotel share | Hotel properties |
|---|---|---|---|---|---|
| End-June 2022 (No.27) | 42 | ¥4,855.5bn | ¥240.8bn | 5.0% | 59 |
| End-June 2023 (No.31) | 47 | ¥5,562.6bn | ¥256.3bn | 4.6% | 66 |
| End-June 2024 (No.35) | 58 | ¥6,454.5bn | ¥283.2bn | 4.4% | 76 |
| End-June 2025 (No.39) | 60 | ¥7,249.9bn | ¥364.7bn | 5.0% | 96 |
| End-June 2026 (No.43) | 61 | ¥8,066.5bn | ¥473.2bn | 5.9% | 115 |
Regional financial institutions supply 30% of capital; pension capital up 1.75-fold in four years
What defines a private REIT is who its investors are. In the investor distribution of No.43 (shares of total capital of ¥4,510.7bn), regional financial institutions (regional banks, shinkin banks, etc.) account for 30.3%, central financial institutions (banks other than regional banks, life and non-life insurers, cooperative central institutions, etc.) 27.0%, pension funds 22.0% and operating companies and others 20.7%. Units of a listed REIT are priced in the market every day, but private REIT capital is priced on an appraisal basis, and it can be turned into cash only through redemption requests via the asset manager or a transfer. Investors therefore tend to value stable income with predictable distributions every period over short-term capital gains.
Over the four years, the share of regional financial institutions fell from 34.0% to 30.3%, while pension funds rose from 20.1% to 22.0% and operating companies and others from 17.6% to 20.7%. But total capital itself grew from ¥2,816.3bn to ¥4,510.7bn, so by our estimate (total capital of each issue multiplied by the share), capital from regional financial institutions rose about 1.43-fold, from about ¥960bn to about ¥1.37 trillion, and pension capital about 1.75-fold, from about ¥570bn to about ¥990bn. The regional financial institutions’ share fell not because they cut their investment, but because pension money flowed in even faster.
Pension funds and regional financial institutions are both investors that assume long-term holding and value stable distributions. Their positions differ slightly, though. Pension funds aim to build up, over the long term, a yield that matches their liabilities (benefit payments), and dislike volatility in distributions. Regional financial institutions tend to value ties to local real estate, and also see meaning in channelling money back into their home region. The 61 corporations in the ARES survey include private REITs with regionally based sponsors, such as Hiroshima Chiho Sosei REIT (ひろしま地方創生リート投資法人), Hokkaido REIT (北海道リート投資法人), JR Kyushu Private REIT (JR九州プライベートリート投資法人) and Kyuden Private REIT (九電プライベートリート投資法人). This “home-region” orientation connects to location, the third axis discussed below. Another route by which regional financial institutions channel money into hotels is analysed in detail in Regional Bank-Led Small-Scale Continuous Hotel Funds.
Seven listed hotel REITs hold 300 properties worth ¥1.80 trillion in Japan — private REIT hotels are about 26% of that
For comparison, we totalled the scale of the listed hotel REITs using the REIT ownership master (as of September 21, 2026; Ichigo Hotel REIT only as of September 14). The seven are Ichigo Hotel REIT Investment Corporation (3463), Invincible Investment Corporation (8963), Nippon Hotel & Residential Investment Corporation (3472), Japan Hotel REIT Investment Corporation (8985), Hoshino Resorts REIT, Inc. (3287), MORI TRUST REIT, Inc. (8961) and Kasumigaseki Hotel REIT Investment Corporation (401A). Together they hold 300 properties and 52,337 rooms in Japan, with a total acquisition price of ¥1,804.2bn. The ¥473.2bn of hotels held by private REITs is about 26% of that.
ARES total assets are also “the sum of the acquisition prices of properties held”, so the two can be compared on the same basis. The average acquisition price per property is ¥6.01bn for the seven listed REITs’ domestic holdings and ¥4.11bn for private REIT hotels, so the private side mainly acquires smaller properties. Comparisons of acquisition price per room and of each REIT’s sponsor are covered in earlier articles and are not repeated here. What this article focuses on is that, for the same hotel, listed and private REITs require a different “shape of return.”
| Investment corporation | Domestic properties | Rooms | Total acquisition price |
|---|---|---|---|
| Invincible Investment Corporation (8963) | 110 | 19,260 rooms | ¥603.1bn |
| Japan Hotel REIT Investment Corporation (8985) | 53 | 15,338 rooms | ¥655.7bn |
| Hoshino Resorts REIT, Inc. (3287) | 71 | 8,667 rooms | ¥233.9bn |
| Ichigo Hotel REIT Investment Corporation (3463) | 29 | 4,418 rooms | ¥71.9bn |
| Nippon Hotel & Residential Investment Corporation (3472) | 16 | 1,991 rooms | ¥48.1bn |
| Kasumigaseki Hotel REIT Investment Corporation (401A) | 15 | 726 rooms | ¥49.2bn |
| MORI TRUST REIT, Inc. (8961) | 6 | 1,937 rooms | ¥142.2bn |
| Total, 7 listed REITs | 300 | 52,337 rooms | ¥1,804.2bn |
| (Reference) Private REIT hotels | 115 | — | ¥473.2bn |
Plotting the seven listed REITs’ 300 domestic properties on a map shows they are concentrated in the major cities of Tokyo, Osaka, Fukuoka, Sapporo and Naha and in key tourist destinations. By region, Kanto accounts for 34.3% of the seven listed REITs’ rooms, 8.1 points above its 26.2% share of the 24,592 properties and 1,394,241 rooms nationwide for which we track inventory (based on listings on the major booking sites). Kyushu-Okinawa is also overweight in listed REITs, at 19.6% vs 15.0%. By contrast, Hokkaido-Tohoku (10.1% vs 14.4%), Chubu-Hokuriku (13.4% vs 17.7%), Kinki (15.7% vs 18.3%) and Chugoku-Shikoku (7.0% vs 8.4%) are underweight relative to their share of total market rooms. The share of a region’s rooms owned by listed REITs is 4.9% in Kanto and Kyushu-Okinawa, and 2.6–3.2% in the other four regions.
Axis 1: Lease structure — fixed rent suits pension funds, variable rent suits listed REITs
From the owner’s side, the shape of a hotel’s income is set by its contract with the operator. Broadly there are three types: (1) a fixed-rent lease, in which the operator pays a set amount every month; (2) fixed plus variable, in which a variable portion linked to revenue or GOP (gross operating profit) is added on top of a fixed portion; and (3) variable rent, where rent is almost entirely linked to GOP, or a management contract, where the owner bears the hotel business risk. Here we look only at how each type fits different investors.
Many listed hotel REITs acquire variable-rent properties that let them pass rising room rates through to distributions, and report operating results to investors monthly. MORI TRUST REIT, for example, holds six hotels, three on variable rent and three on fixed rent. It discloses monthly OCC, ADR and RevPAR only for the three variable-rent hotels; for the three fixed-rent hotels it discloses only items such as acquisition price and room count. For a listed REIT whose unit price moves every day, the expectation of upside from variable rent is itself part of the value of its units.
Private REIT investors, pension funds above all, by contrast value predictable distributions every period. A hotel on a long-term fixed-rent lease, whose lessee (the operator) has demonstrably sufficient ability to pay, can be treated as “bond-like income” close to that of offices or housing. The hotel share of private REITs has stayed at 5.9% likely because hotels are usually traded as variable-rent assets, so there have been few properties matching the stability private REIT investors want. Put the other way round, a hotel that can be structured with a contract weighted towards fixed rent is a natural acquisition candidate for a private REIT.
Fixed rent (long term)
Predictable distributions, close to what pension funds and regional financial institutions require. Points to check: the lessee’s ability to pay and the ratio of GOP to rent (rent-paying capacity).
Fixed plus variable
Secures a floor with the fixed portion while still capturing upside. For a private REIT, a design in which the fixed portion makes up most of NOI is easier to acquire.
Variable rent / management contract
Captures upside directly when room rates rise. Combined with monthly disclosure, it suits listed REIT investors who can accept price movements.
Axis 2: NOI stability — seasonal ADR amplitude is 22.0% for business hotels and 43.4% for resorts
Even if the contract leans towards variable rent, a hotel with little seasonal swing to begin with tends to have stable NOI (net operating income). We therefore used MetroEngines Research’s estimated settled ADR to measure seasonal amplitude by property type (difference between the highest and lowest month ÷ annual average) for the 12 months from September 2025 to August 2026. Calculating the amplitude for each prefecture and comparing medians by type gives business hotels 22.0% (47 prefectures; 7,391 properties, the sum of each prefecture’s monthly median count), city hotels 31.9% (15 prefectures), ryokan 38.1% (45 prefectures) and resort hotels 43.4% (20 prefectures). Only series with at least 20 properties covered in each month in a given prefecture are used here.
Indexing the monthly level by type (12-month average for each prefecture = 100, then taking the prefecture median) makes the difference clear. Business hotels range from 94.5 in June, their lowest month, to 109.2 in August, their highest, staying within a band of just under 15 points all year. Resort hotels, by contrast, move 40 points, from 81.1 in June to 121.5 in August, and ryokan show a 36-point gap between 119.1 in December and 83.2 in June. The strength of resorts and ryokan is pricing power — the ability to raise prices sharply in peak periods — which works best when combined with the variable rent of listed REITs that can capture that upside. Business hotels, whose level is flat through the year, lend themselves to fixed rent and are closer to the income shape private REIT investors want.
Note that seasonal amplitude here looks at ADR only and does not include seasonal variation in OCC. In the off-season, room rates and occupancy often fall together, so actual swings in RevPAR are larger than the ADR amplitude. It is best used as a guide for comparing the order between property types (business < city < ryokan < resort).
Axis 3: Location — 12 prefectures where business-hotel amplitude is within 15% and rooms exceed 15,000
The third axis is location. Regional financial institutions supply 30% of capital and tend to value ties to local properties. We therefore picked out the prefectures where the seasonal ADR amplitude of business hotels is within 15% and the rooms covered by our inventory tracking exceed 15,000; the following 12 prefectures qualified. In all of them the estimated settled ADR of business hotels is around ¥6,000–¥8,100, lower than in the big cities, but the level is flat through the year, making these areas where fixed rent is easy to set. The list includes prefectures in regions where the listed REITs’ ownership share is below the total market (Hokkaido-Tohoku, Chubu-Hokuriku, Kinki, Chugoku-Shikoku), so there is room for private REITs funded by local financial institutions to acquire local properties.
| Prefecture | Inventory tracked (properties / rooms) | Business hotel ADR (12-month average) | Business hotel seasonal amplitude | All types seasonal amplitude | ADR N (monthly median) |
|---|---|---|---|---|---|
| Aichi | 560 / 55,454 rooms | ¥7,820 | 13.9% | 21.6% | 325 |
| Chiba | 766 / 50,171 rooms | ¥8,082 | 12.6% | 19.7% | 163 |
| Tochigi | 634 / 24,159 rooms | ¥6,562 | 12.0% | 35.5% | 137 |
| Fukushima | 507 / 24,035 rooms | ¥6,177 | 7.9% | 12.2% | 156 |
| Hyogo | 863 / 35,949 rooms | ¥7,674 | 11.0% | 29.1% | 167 |
| Kumamoto | 531 / 21,793 rooms | ¥6,948 | 11.1% | 27.6% | 118 |
| Kagoshima | 545 / 20,988 rooms | ¥6,104 | 11.5% | 14.9% | 159 |
| Gunma | 603 / 20,751 rooms | ¥6,500 | 14.1% | 27.3% | 102 |
| Nagasaki | 410 / 18,962 rooms | ¥6,708 | 12.0% | 18.7% | 126 |
| Ibaraki | 347 / 18,618 rooms | ¥6,711 | 8.6% | 8.3% | 184 |
| Saitama | 233 / 18,152 rooms | ¥7,664 | 7.9% | 12.4% | 147 |
| Ehime | 288 / 15,473 rooms | ¥5,991 | 10.8% | 20.2% | 101 |
| (Reference) Areas with strong seasonal pricing power | |||||
| Tokyo | 1,398 / 184,377 rooms | ¥14,178 | 44.1% | 41.4% | 914 |
| Osaka | 740 / 112,969 rooms | ¥10,016 | 55.6% | 55.0% | 497 |
| Kyoto | 1,165 / 55,008 rooms | ¥13,892 | 86.3% | 81.6% | 321 |
| Hokkaido | 1,431 / 96,316 rooms | ¥8,881 | 47.1% | 42.4% | 430 |
| Okinawa | 1,226 / 54,258 rooms | ¥8,865 | 31.7% | 34.7% | 194 |
Tokyo, Osaka, Kyoto, Hokkaido and Okinawa, shown for reference, have large amplitudes of 31.7–86.3% even for business hotels. Business hotels in Kyoto vary more than twofold, from ¥21,600 in November to ¥9,600 in June, and can raise prices sharply in the autumn-leaves and cherry-blossom seasons. In Tokyo too, April’s ¥17,800 compares with ¥11,600 in August. Such areas readily reflect inbound and tourism peak demand in their prices, and listed REITs hold many of them as variable-rent properties that capture the upside. Listed and private REITs can thus be seen as having different areas of strength.
Setting the assumed yield — estimating NOI swings for fixed-rent and variable-rent structures
Finally, we take a business hotel close to the conditions of the 12 prefectures above and estimate how NOI and the approach to pricing change between fixed and variable rent. ADR is set at ¥6,700, close to the median estimated settled ADR of business hotels in the 12 prefectures. The figures are only a simple model to illustrate the approach.
■ Assumptions
• 150 rooms, ADR ¥6,700 (around the median estimated settled ADR of business hotels in the 12 prefectures above, tax-excluded equivalent), OCC 80% (an assumed full-year value, not a measured one)
• Room revenue = 150 rooms × ¥6,700 × 80% × 365 days = about ¥293M. With rooms at 90% of revenue, total revenue is about ¥326M
• Operating costs: variable costs proportional to revenue at 25% of revenue, and fixed costs at 25% of base-year revenue (about ¥81.5M), giving GOP of about ¥163M (GOP margin 50%)
• Owner-borne costs (fixed asset and city planning taxes, insurance, repair reserve): ¥26M a year
• Variable rent: rent = 85% of GOP (operator keeps 15%). NOI = rent − owner-borne costs
• Fixed rent: annual fixed rent of ¥110M (about 67% of base-year GOP; GOP is 1.48x rent). NOI = rent − owner-borne costs = ¥84M
• NOI yield: starting from the 4.1% expected yield for hotels (Tokyo) in the Japan Real Estate Institute’s “54th Japanese Real Estate Investor Survey” (as of April 2026), this article provisionally adds +0.5 points for a regional location and a further +0.5 points for variable-rent volatility (fixed rent 4.6%, variable rent 5.1%). These are not market values.
| Revenue change (linked to RevPAR) | Total revenue | GOP | Variable-rent NOI | Fixed-rent NOI | GOP ÷ fixed rent |
|---|---|---|---|---|---|
| Base case | ¥326.1M | ¥163.0M | ¥112.6M | ¥84.0M | 1.48x |
| Revenue −10% | ¥293.5M | ¥138.6M | ¥91.8M (−18.5%) | ¥84.0M (±0%) | 1.26x |
| Revenue −20% | ¥260.9M | ¥114.1M | ¥71.0M (−36.9%) | ¥84.0M (±0%) | 1.04x |
Because of fixed costs, a 10% fall in revenue cuts GOP by 15% and variable-rent NOI by 18.5%. A 20% fall in revenue cuts NOI by 36.9% — a drop similar to the off-season month for resort hotels seen in the previous section (index 81.1). Fixed-rent NOI, meanwhile, stays at ¥84M. But when revenue falls 20%, GOP covers the fixed rent only 1.04 times, leaving the operator almost no margin to pay. In other words, the stability of fixed rent depends on how much headroom GOP has over rent (rent-paying capacity). A business hotel with a small seasonal amplitude finds it easier to keep that headroom, since even in its weakest month of the year GOP is unlikely to fall far below rent.
Converted to a price by dividing base-case NOI by the yields above, the fixed-rent structure is worth about ¥1.83bn (¥84M ÷ 4.6%) and the variable-rent structure about ¥2.21bn (¥112.6M ÷ 5.1%). The variable-rent price is higher, but that valuation includes the upside when room rates rise. The fixed-rent structure is priced about 17% lower but has no NOI swing. Moving the yield by 0.5 points, fixed rent is worth about ¥2.05bn at 4.1% and about ¥1.65bn at 5.1%, and variable rent about ¥2.45bn at 4.6% and about ¥2.01bn at 5.6%. For a private REIT, whether this trade-off — “give up a little yield in return for lower volatility” — can be explained to investors decides whether a hotel gets acquired. At around ¥2bn per property, the scale is about half the ¥4.11bn average acquisition price per hotel in private REITs, a size that is easy to handle both as a single property and as part of a multi-property acquisition.
Laying the price estimate out on two axes, revenue change and NOI yield, gives the table below. If revenue falls 20% and the yield rises to 5.6%, the variable-rent structure drops to about ¥1.27bn, more than 40% below the base case of about ¥2.21bn (5.1%). Because fixed-rent NOI stays at ¥84M regardless of revenue, its value of about ¥1.83bn at 4.6% holds even at −20% revenue (though GOP ÷ rent falls to 1.04x). In the case where revenue rises 10%, the variable-rent structure rises to about ¥2.62bn (5.1%) — it is the variable-rent side that captures the upside.
| Revenue change | Variable-rent NOI | Yield 4.6% | Yield 5.1% (base in this article) | Yield 5.6% | (Reference) Fixed rent at 4.6% |
|---|---|---|---|---|---|
| Revenue +10% (optimistic) | ¥133.4M | ¥2.90bn | ¥2.62bn | ¥2.38bn | ¥1.83bn |
| Base case (central) | ¥112.6M | ¥2.45bn | ¥2.21bn | ¥2.01bn | ¥1.83bn |
| Revenue −10% | ¥91.8M | ¥2.00bn | ¥1.80bn | ¥1.64bn | ¥1.83bn |
| Revenue −20% (pessimistic) | ¥71.0M | ¥1.54bn | ¥1.39bn | ¥1.27bn | ¥1.83bn |
Summary — the hotels private REITs are most likely to acquire next
Private REIT hotel assets total ¥473.2bn, only a 5.9% share, but they grew 29.8% in a year and almost doubled in four years. About 30% of investors are regional financial institutions and just over 20% are pension funds, both of which value stable distributions every period. The 300 domestic properties worth ¥1.80 trillion held by the seven listed hotel REITs are weighted towards Kanto and Kyushu-Okinawa, and are geared to capturing room-rate upside through variable rent.
By contrast, the conditions that make a hotel easy for a private REIT to acquire come down to three: (1) a long-term fixed-rent lease, or a fixed-plus-variable contract in which the fixed portion makes up most of NOI; (2) a property type with a small seasonal ADR amplitude, where GOP stays well above rent even in off-season months (in our measurement, 22.0% for business hotels vs 43.4% for resorts); and (3) a location in a regional core area where the level is flat through the year and local financial institutions can readily see the point of investing. Listed and private REITs have different areas of strength, and across the hotel market as a whole each serves as a channel bringing a different set of investors’ money into hotels. If pension money keeps flowing in, regional business hotels that can be structured on fixed rent may gain prominence as private REITs’ next acquisitions.
Note: This article’s estimated settled ADR uses only finalised months from September 2025 to August 2026. Settled ADR disclosed by REITs is shown excluding consumption tax, and this article’s estimated settled ADR is also at a tax-excluded-equivalent level (an estimate with a median error of about 7% against REIT disclosures). The estimates are a simple model to illustrate the approach and do not indicate the value or future earnings of any specific property or investment corporation.
Related Articles
References and Sources
■ Data sources
Private REIT scale, composition by use and investor distribution are published values from ARES, Private REIT Quarterly No.27–No.43 (end-June of each year). The seven listed hotel REITs’ domestic holdings come from the REIT ownership master (as of September 21, 2026), based on the property lists in each REIT’s IR. Estimated settled ADR by prefecture × property type (September 2025–August 2026) and the property and room counts covered by inventory tracking (24,592 properties, 1,394,241 rooms) are aggregated by MetroEngines Research & Consulting. The expected yield for hotels (Tokyo) is from the Japan Real Estate Institute’s “54th Japanese Real Estate Investor Survey.”
■ Assumptions
The NOI and price estimates assume 150 rooms, ADR ¥6,700 (around the median estimated settled ADR of business hotels in the 12 prefectures), OCC 80% (an assumed full-year value), rooms at 90% of revenue, a variable cost ratio of 25%, fixed costs at 25% of base-year revenue and owner-borne costs of ¥26M a year. Variable rent is 85% of GOP; fixed rent is ¥110M a year. For the NOI yield, this article provisionally added +0.5 points for a regional location to the 4.1% expected yield, and a further +0.5 points for variable rent.
■ Limitations
Seasonal amplitude covers ADR only and excludes seasonal variation in OCC, so swings in RevPAR are larger. Estimated settled ADR is an estimate with a median error of about 7% against REIT disclosures. ARES may revise past values retroactively; the trends in this article use the values as published in each issue. Capital from pension funds and regional financial institutions is our estimate (total capital × share). The estimates are a simple model to illustrate the approach and do not indicate the value or future earnings of any specific property or investment corporation.
■ Market data
- MetroEngines Research & Consulting — estimated settled ADR (September 2025–August 2026, 47 prefectures × property type), property and room counts covered by inventory tracking, REIT ownership master (as of September 21, 2026)
■ Industry bodies and research institutes
- ARES, “Private REIT Quarterly No.43 (as of end-June 2026)” (July 31, 2026)
- ARES, “Private REIT Quarterly No.39 (as of end-June 2025)” (July 31, 2025)
- ARES, “Private REIT Quarterly No.35 (as of end-June 2024)” (July 31, 2024)
- ARES, “Private REIT Quarterly No.31 (as of end-June 2023)” (July 31, 2023)
- ARES, “Private REIT Quarterly No.27 (as of end-June 2022)” (July 28, 2022)
- Japan Real Estate Institute, “54th Japanese Real Estate Investor Survey (as of April 2026)”
■ REIT
- Japan Hotel REIT Investment Corporation, portfolio list (in Japanese)
- Nippon Hotel & Residential Investment Corporation, portfolio (in Japanese)
- IR property lists of Ichigo Hotel REIT Investment Corporation, Invincible Investment Corporation, Hoshino Resorts REIT, MORI TRUST REIT and Kasumigaseki Hotel REIT Investment Corporation