

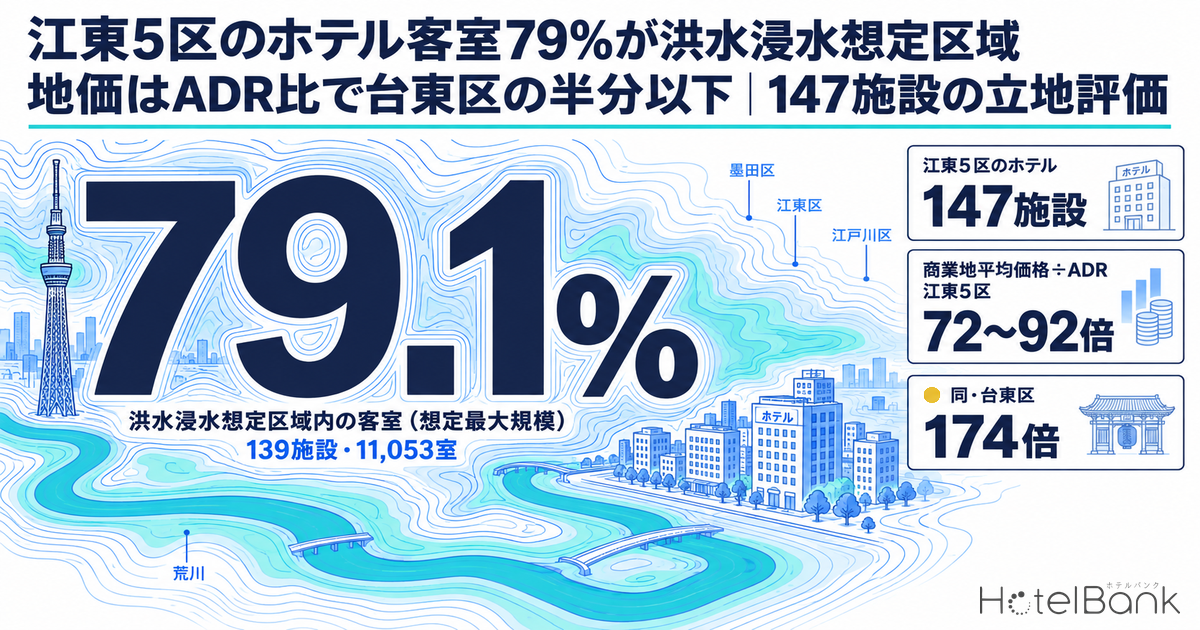
Sumida, Koto, Adachi, Katsushika and Edogawa — the five wards lined up across Tokyo’s eastern lowlands and known collectively as the “Koto 5 Wards” (江東5区) — are home to Tokyo Skytree, Ryogoku, and the Toyosu–Ariake waterfront, and have long been viewed as a lodging location where sites are relatively easy to secure despite the proximity to central Tokyo. At the same time, the five wards jointly published the “Koto 5 Wards Large-Scale Flood Hazard Map” in 2018, showing that almost the entire area could be inundated if the Arakawa or Edogawa rivers overflow. In this article, we extract the 147 operating hotels (13,970 rooms) in the five wards from MetroEngines Research facility data and overlay estimated settled ADR, official land prices, zoning and station ridership with the flood and storm surge inundation zones published by the Ministry of Land, Infrastructure, Transport and Tourism (MLIT), to quantify what can be said about the area as an investment location.
Metric Definitions Used in This Article
- ADR (Average Daily Rate): An estimated settled rate (tax-exclusive equivalent) calculated by applying a segment-specific adjustment factor to the lowest-plan price level each property publishes on major booking sites (two guests per room, price per room, tax included). When checked against property-level results disclosed by listed hotel REITs (91 properties, most recent three months), the median error is about 7%. These are estimates and differ from each property’s actual transacted rates and accounting figures. Area-level ADR is the median of the properties covered (the level of a typical property in the area); in this article we take the simple average of the monthly values for the 12 months from September 2025 to August 2026.
- OCC (Occupancy Rate): The share of rooms sold relative to total rooms in the area (an estimate based on OTA inventory on sale; consistency checks against monthly figures published by REITs confirm accuracy within roughly a few percentage points). It is an estimate based on how inventory sold on major booking sites is absorbed, and differs from the actual occupancy of the whole property.
- Inundation assumptions: We overlaid each property’s representative coordinates (a single point) on the polygon data for flood inundation zones (maximum assumed scale) and storm surge inundation zones provided by the MLIT Real Estate Information Library. Ground elevation, floor height and the presence of flood barriers are not taken into account.
- Data sources: MetroEngines Research & Consulting (facilities, ADR, OCC); MLIT Real Estate Information Library (inundation zones, zoning, official land price points, station ridership); Tokyo Metropolitan Government Bureau of Finance (official land prices, ward averages).
- — 79.1%: Of the 147 hotels and 13,970 rooms in the five wards, 139 hotels and 11,053 rooms fall inside flood inundation zones (maximum assumed scale). Rooms outside the zones are almost entirely limited to reclaimed waterfront land in Koto.
- — 53.4%: For storm surge, 91 hotels and 7,456 rooms sit in zones with an inundation depth of 3m or more. Even in Sumida, where most sites are under 3m for river flooding, 38 hotels and 2,452 rooms are in the 3m-or-more zone for storm surge.
- — About ¥15,400: Sumida’s estimated settled ADR (September 2025–August 2026 average) exceeds both Tokyo as a whole and Taito. Edogawa posted the largest growth at +15.6% YoY.
- — 72–92x: The ratio of average commercial land price in the 2026 Official Land Prices to estimated settled ADR is only 40–50% of Taito’s 174x and 10–20% of Chuo’s 597x; land cost per room equals 1.5–1.9 years of annual room revenue.
- — 2.2–2.8 years even in the downside case: Even in a pessimistic scenario of 400% FAR, ADR −10% and OCC 75% (full year), the five wards stay below Taito’s base case of 3.6 years. However, at the highest-priced point in front of Kinshicho Station the figure is 4.3 years even under base-case assumptions; the lightness of land cost holds only at ward-average price levels.
Supply Structure of the 5 Wards — 147 Hotels, 13,970 Rooms, 47% of Rooms in Koto
Extracting hotels and similar properties operating in the five wards as of September 23, 2026 from the facility data on roughly 27,000 properties that MetroEngines Research tracks and can confirm as operating yields 147 hotels and 13,970 rooms. By ward, Sumida has the most properties at 59, but Koto stands out in room count with 6,551 rooms (46.9% of the five-ward total). Koto averages 168 rooms per property, with large hotels of several hundred rooms clustered on the waterfront in Ariake and Shiomi, whereas Sumida averages 62 rooms with a median of 24, reflecting a dense concentration of small properties including hostels and guesthouses around Ryogoku, Kinshicho and Oshiage.
Edogawa has 24 hotels and 2,415 rooms, averaging 101 rooms per property, with mid-sized business hotels spread around the stations of Nishi-Kasai, Kasai, Funabori and Koiwa. Adachi (11 hotels, 498 rooms) and Katsushika (14 hotels, 840 rooms) are small in both property and room count, and supply is limited to the areas around transfer stations such as Kita-Senju, Ayase, Shin-Koiwa and Kanamachi. By segment on a room basis, business hotels account for 7,653 rooms (54.8%) and city hotels for 3,699 rooms (26.5%); these two segments make up 80% of the total.
| Ward | Hotels | Rooms | Room share | Avg. per hotel | Main clusters |
|---|---|---|---|---|---|
| Sumida | 59 | 3,666 | 26.2% | 62 rooms | Ryogoku, Kinshicho, Oshiage |
| Koto | 39 | 6,551 | 46.9% | 168 rooms | Ariake, Shiomi, Kameido, Toyocho |
| Adachi | 11 | 498 | 3.6% | 45 rooms | Kita-Senju, Ayase, Nishiarai |
| Katsushika | 14 | 840 | 6.0% | 60 rooms | Shin-Koiwa, around Ayase, Kanamachi |
| Edogawa | 24 | 2,415 | 17.3% | 101 rooms | Nishi-Kasai, Kasai, Funabori, Koiwa |
| 5-ward total | 147 | 13,970 | 100% | 95 rooms | — |
Source: MetroEngines Research & Consulting (facility data, N=147 hotels)
Estimated Settled ADR — Sumida at About ¥15,400, Above Tokyo Overall
Averaging ward-level estimated settled ADR over the 12 months from September 2025 to August 2026, Sumida ranks first among the five wards at about ¥15,400 (+4.9% YoY), exceeding Tokyo as a whole at about ¥14,500 and even Taito, with its deep lodging demand, at about ¥14,400. Koto stands at about ¥14,200 (+8.5%), roughly on par with Tokyo overall. By contrast, Edogawa is about ¥12,000, Adachi about ¥10,600 and Katsushika about ¥9,000; the more residential the location in the north-east and east, the lower the rate band.
In terms of growth, Edogawa is the highest of the five wards at +15.6%. Although the limited number of properties covered (17–18 per month) calls for some discounting, rates were up by double digits year on year in November–December 2025 and March–April 2026, and by around +9% in January–February as well. The movement suggests widening room for rate improvement at limited-service hotels along the Tozai Line, which benefit from event demand on the waterfront and access to both central Tokyo and the Maihama area. Adachi (N=5–6) and Katsushika (N=6–8) have small samples, and their figures are best read as directional.
Source: MetroEngines Research & Consulting (estimated settled ADR, 12-month average of monthly medians, September 2025–August 2026)
| Area | Sep 2025–Aug 2026 | Prior-year period (Sep 2024–Aug 2025) | YoY | Hotels covered (monthly) |
|---|---|---|---|---|
| Sumida | ¥15,380 | ¥14,662 | +4.9% | 29–31 |
| Koto | ¥14,178 | ¥13,069 | +8.5% | 39–42 |
| Edogawa | ¥11,958 | ¥10,348 | +15.6% | 17–18 |
| Adachi | ¥10,605 | ¥10,336 | +2.6% | 5–6 |
| Katsushika | ¥8,983 | ¥8,684 | +3.4% | 6–8 |
| (Ref.) Tokyo | ¥14,531 | ¥13,723 | +5.9% | 1,067–1,145 |
| (Ref.) Taito | ¥14,403 | ¥13,822 | +4.2% | 161–177 |
| (Ref.) Chuo | ¥19,082 | ¥17,429 | +9.5% | 148–152 |
Source: MetroEngines Research & Consulting
On a monthly basis, both Sumida and Koto show the same seasonal pattern in 2025 and 2026, with peaks during the cherry blossom and spring holiday season in March–April and the autumn leisure season in October–November. In April 2026, Sumida reached about ¥19,500 and Koto about ¥18,100, both record highs 6–10% above the same month a year earlier. On the other hand, Sumida fell below the prior-year level in June–August 2026, and summer rate formation is not as strong as in spring and autumn. This is a location where annual ADR is decided by how well the spring and autumn peak months are captured.
Source: MetroEngines Research & Consulting (estimated settled ADR, closed months only; Sumida N=28–31, Koto N=39–42)
Occupancy (Estimated) — The Three Main Wards Are on Par with Tokyo Overall
Looking at estimated OCC for June–August 2026, Koto averaged 90.9% over the three months, Sumida 88.5% and Edogawa 88.1%, roughly the same level as Tokyo as a whole (89.9%). Even though rates are lower than in central Tokyo, the pace of inventory absorption is in no way inferior. Koto, with its large waterfront hotels, is the highest of the three wards, and venue demand from exhibitions and concerts appears to be underpinning occupancy. Adachi and Katsushika are excluded from this table because only four to six properties can be tracked on major booking sites and the estimates are not stable.
| Area | June | July | August | 3-month avg. | Hotels / rooms covered |
|---|---|---|---|---|---|
| Sumida | 88.9% | 89.2% | 87.3% | 88.5% | 24–26 hotels / 3,126–3,181 rooms |
| Koto | 91.1% | 91.7% | 89.8% | 90.9% | 27 hotels / 7,557 rooms |
| Edogawa | 88.2% | 89.9% | 86.2% | 88.1% | 11–12 hotels / 1,001–1,008 rooms |
| (Ref.) Tokyo | 90.5% | 91.1% | 88.2% | 89.9% | 780–804 hotels / approx. 103,000–104,000 rooms |
Source: MetroEngines Research & Consulting (occupancy = estimate based on OTA-listed inventory. Hotels and rooms covered are those listed on major booking sites; the universe differs from the facility data tabulation)
Land Prices — Commercial Land Up 15.6% in Koto and 15.0% in Sumida, Yet a Fraction of Central Tokyo Relative to ADR
According to the ward averages in the 2026 Official Land Prices (as of January 1, 2026) published by the Tokyo Metropolitan Government Bureau of Finance, commercial land rose +15.6% YoY in Koto and +15.0% in Sumida, above the +13.8% for the 23 wards as a whole. Katsushika also posted a double-digit increase at +11.1%, while Adachi at +8.5% and Edogawa at +8.7% were among the smaller increases within the 23 wards. The average commercial land price is about ¥1.31 million/m² in Koto, about ¥1.20 million/m² in Sumida, about ¥850,000/m² in Edogawa and Adachi, and about ¥720,000/m² in Katsushika.
What matters for location assessment is not the absolute level of land prices but how heavy the land price is relative to the room rate that can be sold on that land. Lining up the ratio of average commercial land price to estimated settled ADR, the five wards fall within 72–92x, an order of magnitude apart from Taito’s 174x, Shinagawa’s 192x, roughly 380–400x for Shinjuku and Minato, and Chuo’s 597x. Although Sumida’s ADR is higher than Taito’s, its average commercial land price is less than half of Taito’s (about ¥2.51 million/m²). This lightness of land cost relative to rate is precisely the basis on which the five wards are valued as hotel sites.
Source: Compiled from Tokyo Metropolitan Government Bureau of Finance, “2026 Official Land Prices (Tokyo),” and MetroEngines Research & Consulting (estimated settled ADR)
| Ward | Residential avg. price | Residential change | Commercial avg. price | Commercial change | Commercial price ÷ ADR |
|---|---|---|---|---|---|
| Sumida | 613,300 | +13.2% | 1,203,900 | +15.0% | 78x |
| Koto | 661,500 | +11.9% | 1,310,300 | +15.6% | 92x |
| Adachi | 410,800 | +6.3% | 847,300 | +8.5% | 80x |
| Katsushika | 387,500 | +5.6% | 720,100 | +11.1% | 80x |
| Edogawa | 441,100 | +5.7% | 857,400 | +8.7% | 72x |
| (Ref.) Taito | 1,320,800 | +14.2% | 2,512,900 | +19.1% | 174x |
| (Ref.) All 23 wards | 856,400 | +9.0% | 4,015,100 | +13.8% | — |
Source: Compiled from Tokyo Metropolitan Government Bureau of Finance, “Overview of 2026 Official Land Prices (Tokyo),” and MetroEngines Research & Consulting
At the individual-point level, the highest-priced commercial point in every ward is located in front of a station. Among the official land price points in the MLIT Real Estate Information Library, Sumida’s is the point 150m from Kinshicho Station at ¥3.23 million/m² (+19.6% YoY), Koto’s is the point 80m from Toyosu Station at ¥3.00 million/m² (+17.2%), Adachi’s is the point 190m from Kita-Senju Station at ¥6.25 million/m² (+23.8%), Katsushika’s is the point 200m from Shin-Koiwa Station at ¥1.98 million/m² (+11.2%), and Edogawa’s is the point in front of Nishi-Kasai Station at ¥2.18 million/m² (+8.5%). The gap between ward averages and the top points is large; even within the same ward, land cost per room can differ by a factor of two to three between a prime station-front site and a neighborhood commercial district a few hundred meters from the station.
Zoning and Stations — 51% of Rooms in Commercial Districts, Transfer-Station Pulling Power Supports Rates
Overlaying the representative coordinates of the 147 hotels on MLIT zoning data shows that, on a room basis, commercial districts account for 7,117 rooms (50.9%), quasi-industrial districts for 2,958 rooms (21.2%), neighborhood commercial districts for 1,587 rooms (11.4%) and exclusively industrial districts for 1,742 rooms (12.5%). In the four wards of Sumida, Katsushika, Edogawa and Adachi, more than half of rooms are located in commercial districts, whereas in Koto nearly 70% of rooms are concentrated in quasi-industrial districts and industrial-type zones on the waterfront; the way supply came about differs by ward.
| Ward | Commercial | Neighborhood commercial | Quasi-industrial | Exclusively industrial | Residential |
|---|---|---|---|---|---|
| Sumida | 3,112 | 483 | 71 | 0 | 0 |
| Koto | 1,441 | 342 | 2,764 | 1,742 | 262 |
| Adachi | 257 | 163 | 67 | 0 | 11 |
| Katsushika | 770 | 5 | 6 | 0 | 59 |
| Edogawa | 1,537 | 594 | 50 | 0 | 205 |
| 5-ward total | 7,117 | 1,587 | 2,958 | 1,742 | 537 |
Source: Compiled from MLIT Real Estate Information Library (zoning) and MetroEngines Research & Consulting (one Edogawa hotel with 29 rooms excluded as it could not be classified)
Note that under the Building Standards Act, hotels and ryokan cannot be newly built in exclusively industrial districts (Appended Table 2). The 1,742 rooms classified as exclusively industrial are the result of classifying two large Ariake hotels (912 rooms and 830 rooms) by a single representative coordinate each. The zoning and district-plan treatment of each site must be checked individually, and exclusively industrial districts cannot be counted as candidates for new sites.
On the station side, the gateway for demand, comparing 2023 station ridership in the National Land Numerical Information (values for each operator summed by station name) with 2019 shows Oshiage at 103.8% and Kokusai-Tenjijo at 113.9%, above pre-COVID levels. Stations serving tourism and event purposes — Tokyo Skytree and the large waterfront venues — recovered first. By contrast, transfer stations with a heavy commuter weighting, such as Kita-Senju (86.6%), Kinshicho (89.5%) and Toyosu (91.9%), have recovered only to around 90%. From a lodging demand perspective, the depth of tourism and event visitors, rather than the return of commuters, drives rates, so location value tends to arise in the catchments of destination-type stations such as Oshiage, Ryogoku and Ariake.
Source: Compiled by MetroEngines Research & Consulting from MLIT National Land Numerical Information, “Station Ridership” (via the Real Estate Information Library). Values for each operator are summed by station name; they include transfer passengers and counting definitions differ by operator
The Premises Set Out by the Koto 5 Wards Large-Scale Flood Hazard Map
In August 2018, the Koto 5 Wards and the Koto 5 Wards Wide-Area Evacuation Promotion Council published the “Koto 5 Wards Large-Scale Flood Hazard Map,” which overlays the flood inundation zone maps for the Arakawa and Edogawa rivers. The assumed rainfall is the maximum assumed scale in both cases: 632mm of total rainfall over three days in the Arakawa basin for the Arakawa River, and 491mm over three days in the Tone River basin for the Edogawa River. The map shows that about 2.5 million people live in the inundation zones of the five wards, and that there are wide areas where inundation could last two weeks or more, leaving electricity, gas, water and toilets unusable.
For this reason, the five wards have a phased plan: they begin joint deliberations 72 hours (three days) before an overflow, issue voluntary wide-area evacuation information 48 hours before, and issue a wide-area evacuation instruction 24 hours before (called a “wide-area evacuation advisory” when the plan was drawn up in 2018), urging early evacuation outside the wards. In addition, the reverse side of the map also presents the Tokyo Metropolitan Government’s storm surge inundation zone map (assuming a Muroto Typhoon-class storm of 910hPa), noting that almost all of the five wards could be inundated by storm surge if a violent typhoon with a central pressure of 930hPa or lower approaches. In assessing hotel investment locations, three points form the premises: inundation depth, inundation duration, and an operating framework in which wide-area evacuation comes first.
Inundation depth
Under maximum assumed scale rainfall for the Arakawa and Edogawa rivers, wide areas of the five wards are expected to be inundated by 0.5m or more, and parts of the north and east by 3–5m or more. This ties directly to how the first and second floors are used and where equipment is placed.
Inundation duration
In zero-meter zones drainage takes time, and there are areas where inundation lasts two weeks or more. The period until reopening, and how revenue is treated in the meantime, need to be reflected in the business plan.
Wide-area evacuation operations
Evacuation outside the wards is called for in stages starting 72 hours before an overflow. Hotels can decide in advance on procedures for guiding guests, handling reservations and ensuring employee safety.
Source: Compiled from Koto 5 Wards Wide-Area Evacuation Promotion Council, “Koto 5 Wards Large-Scale Flood Hazard Map” (first edition, August 2018), and the Koto Ward and Edogawa Ward websites
Overlaying Hotel Locations — 139 Hotels in Flood Inundation Zones, 49 at 3m or More
Overlaying the representative coordinates of the 147 hotels on the flood inundation zones (maximum assumed scale) in the MLIT Real Estate Information Library, 139 hotels and 11,053 rooms (79.1% of rooms) fall inside the zones. The Arakawa River is the relevant river for the vast majority, at 135 hotels, followed by the Nakagawa, Sumida, Kyu-Nakagawa, Tone and Edogawa rivers. By depth, the largest group is 0.5m to under 3.0m with 79 hotels and 6,598 rooms, followed by 3.0m to under 5.0m with 45 hotels and 3,206 rooms and 5.0m to under 10.0m with 4 hotels and 163 rooms; in total 49 hotels and 3,369 rooms (24.1% of rooms) are located in zones of 3m or more.
The picture differs clearly by ward. In Sumida, Adachi and Katsushika every hotel is inside the zones; in Katsushika 13 of 14 hotels, and in Adachi 9 of 11, are located in zones of 3m or more. In Edogawa, too, 23 of 24 hotels are inside the zones, with 13 hotels and 1,503 rooms — more than 60% of rooms — at 3m or more. In Koto, by contrast, 7 hotels and 2,888 rooms on raised reclaimed waterfront land in Ariake, Shiomi and elsewhere are outside the zones, and the share of rooms inside the zones is only 55.9%. Among the five wards, the Koto waterfront is effectively the only place with a meaningful block of rooms outside the inundation zones.
Source: Compiled from MLIT Real Estate Information Library (flood inundation zones, maximum assumed scale) and MetroEngines Research & Consulting (N=147 hotels, 13,970 rooms)
| Ward | Flood: inside zone | Room share | Flood: 3m or more | Storm surge: inside zone | Storm surge: 3m or more |
|---|---|---|---|---|---|
| Sumida | 59 hotels / 3,666 rooms | 100% | 9 hotels / 191 rooms | 59 hotels / 3,666 rooms | 38 hotels / 2,452 rooms |
| Koto | 32 hotels / 3,663 rooms | 55.9% | 5 hotels / 429 rooms | 33 hotels / 4,434 rooms | 22 hotels / 2,251 rooms |
| Adachi | 11 hotels / 498 rooms | 100% | 9 hotels / 453 rooms | 5 hotels / 154 rooms | 2 hotels / 90 rooms |
| Katsushika | 14 hotels / 840 rooms | 100% | 13 hotels / 793 rooms | 14 hotels / 840 rooms | 12 hotels / 788 rooms |
| Edogawa | 23 hotels / 2,386 rooms | 98.8% | 13 hotels / 1,503 rooms | 24 hotels / 2,415 rooms | 17 hotels / 1,875 rooms |
| 5-ward total | 139 hotels / 11,053 rooms | 79.1% | 49 hotels / 3,369 rooms | 135 hotels / 11,509 rooms | 91 hotels / 7,456 rooms |
Source: Compiled from MLIT Real Estate Information Library (flood inundation zones [maximum assumed scale] and storm surge inundation zones) and MetroEngines Research & Consulting
The picture changes for storm surge. The three wards of Koto and Edogawa, which face Tokyo Bay, and Sumida, along the Sumida River, have many rooms in zones of 3m or more; across the five wards, 91 hotels and 7,456 rooms (53.4% of rooms) are in the 3m-or-more storm surge zone. Sumida hotels, most of which were under 3m for river flooding, include 38 hotels and 2,452 rooms in the 3m-or-more zone for storm surge. Conversely, inland Adachi has only 5 hotels inside the storm surge zone. Because the distribution of “deep” zones differs between flooding and storm surge, it is essential to check both assumptions individually when evaluating a candidate site.
The map below color-codes the 147 hotels by flood depth rank (circle size indicates room count) and overlays the commercial points of the 2026 Official Land Prices (squares). It shows deep inundation zones spreading across Katsushika and northern Edogawa, between the Arakawa and Nakagawa rivers, and Adachi, with only the cluster of large waterfront hotels falling outside the zones.
Source: Compiled from MLIT Real Estate Information Library (flood inundation zones, official land prices) and MetroEngines Research & Consulting
Implications for Investment Decisions — Protecting Light Land Cost with Flood-Resilient Specifications
Translating the figures so far into investment terms, the five wards are a location where “land is light relative to rate.” Assuming a limited-service hotel with 30m² of gross floor area per room that fully uses a 500% FAR, the site area per room is 6m². Comparing land cost per room (this area multiplied by the average commercial land price) with annual room revenue per room (estimated settled ADR × 80% occupancy [a full-year assumption] × 365 days), land cost in the five wards comes to 1.5–1.9 years of annual room revenue. Under the same assumptions the figure is 3.6 years for Taito and 12.3 years for Chuo; the land burden relative to rate in the five wards is strikingly light.
| Ward | Land cost per room | Annual room revenue per room (OCC 80%, full-year assumption) | Land cost ÷ revenue (base) | ADR −10% | OCC 75% (full year) |
|---|---|---|---|---|---|
| Edogawa | ¥5.14M | ¥3.49M | 1.47 yrs | 1.64 yrs | 1.57 yrs |
| Sumida | ¥7.22M | ¥4.49M | 1.61 yrs | 1.79 yrs | 1.72 yrs |
| Adachi | ¥5.08M | ¥3.10M | 1.64 yrs | 1.82 yrs | 1.75 yrs |
| Katsushika | ¥4.32M | ¥2.62M | 1.65 yrs | 1.83 yrs | 1.76 yrs |
| Koto | ¥7.86M | ¥4.14M | 1.90 yrs | 2.11 yrs | 2.03 yrs |
| (Ref.) Taito | ¥15.08M | ¥4.21M | 3.59 yrs | 3.98 yrs | 3.82 yrs |
| (Ref.) Chuo | ¥68.31M | ¥5.57M | 12.26 yrs | 13.62 yrs | 13.08 yrs |
Source: Compiled from Tokyo Metropolitan Government Bureau of Finance, “2026 Official Land Prices (Tokyo),” and MetroEngines Research & Consulting (estimated settled ADR). 30m² GFA per room, 500% FAR and OCC 80% (full year) are assumptions of this article
Because the table above shows sensitivities with FAR, ADR and occupancy moved one at a time, we also check the case where conditions move together. Lining up land cost ÷ annual room revenue for three scenarios — optimistic (600% FAR, ADR +10%, OCC 85%), base (the base assumptions of the table above) and pessimistic (400% FAR, ADR −10%, OCC 75%; all full-year) — the five wards remain within 2.18–2.81 years even in the pessimistic case, below Taito’s base case of 3.59 years. As long as ward-average land prices are used, the “lightness of land relative to rate” in the five wards holds even when assumptions are pushed to the pessimistic side.
| Ward | Optimistic (600% FAR, ADR +10%, OCC 85% [full year]) | Base (500% FAR, OCC 80% [full year]) | Pessimistic (400% FAR, ADR −10%, OCC 75% [full year]) |
|---|---|---|---|
| Edogawa | 1.05 yrs | 1.47 yrs | 2.18 yrs |
| Sumida | 1.15 yrs | 1.61 yrs | 2.38 yrs |
| Adachi | 1.17 yrs | 1.64 yrs | 2.43 yrs |
| Katsushika | 1.17 yrs | 1.65 yrs | 2.44 yrs |
| Koto | 1.35 yrs | 1.90 yrs | 2.81 yrs |
| (Ref.) Taito | 2.56 yrs | 3.59 yrs | 5.31 yrs |
| (Ref.) Chuo | 8.74 yrs | 12.26 yrs | 18.16 yrs |
Source: Compiled from Tokyo Metropolitan Government Bureau of Finance, “2026 Official Land Prices (Tokyo),” and MetroEngines Research & Consulting (estimated settled ADR, September 2025–August 2026 average). 30m² GFA per room; OCC is a full-year assumption
On the other hand, even within the same ward the conclusion changes greatly depending on the land price of the site and the usable FAR. For Sumida (estimated settled ADR ¥15,380, OCC 80% [full year]), we laid out land cost ÷ annual room revenue on two axes, land unit price and FAR. At the ward-average land price the figure is 2.7 years even at 300% FAR, lighter than the Taito-average base case (3.6 years), but at the point 150m from Kinshicho Station (¥3.23 million/m²) it is 4.3 years at 500% FAR, and a 600% FAR is needed to bring it down to the Taito-average level. When choosing a prime station-front site, the ward-average premise that “land is light in the five wards” cannot be applied as it stands.
| Land unit price | FAR 300% | 400% | 500% | 600% |
|---|---|---|---|---|
| Ward average (commercial) (¥1.204M/m²) | 2.7 yrs | 2.0 yrs | 1.6 yrs | 1.3 yrs |
| Point 310m from Ryogoku Station (¥1.540M/m²) | 3.4 yrs | 2.6 yrs | 2.1 yrs | 1.7 yrs |
| ¥2 million/m² (¥2.000M/m²) | 4.5 yrs | 3.3 yrs | 2.7 yrs | 2.2 yrs |
| Equivalent to Taito ward average (¥2.513M/m²) | 5.6 yrs | 4.2 yrs | 3.4 yrs | 2.8 yrs |
| Point 150m from Kinshicho Station (ward high) (¥3.230M/m²) | 7.2 yrs | 5.4 yrs | 4.3 yrs | 3.6 yrs |
Source: Compiled from MLIT Real Estate Information Library (2026 official land price points), Tokyo Metropolitan Government Bureau of Finance, “2026 Official Land Prices (Tokyo),” and MetroEngines Research & Consulting (estimated settled ADR). 30m² GFA per room and OCC 80% (full year) are assumptions of this article
This estimate is a rough calculation using ward-average land prices; at the highest-priced station-front points land cost is two to three times higher, and land cost per room also changes with FAR restrictions based on the width of the fronting road — a 4m fronting road, for example, can cut a designated 600% FAR to 240%. Construction costs also continue to rise: hotel construction costs in 2025 based on MLIT’s Building Starts Statistics were at record highs of ¥1.952 million per tsubo on average across all structures and ¥2.405 million per tsubo for steel-frame construction. Given that construction accounts for the bulk of total project cost, it should be kept in mind that yield is not determined by light land cost alone.
With that in mind, there are concrete ways to build inundation assumptions into a business plan. First, place power receiving and transformation equipment, emergency generators and water supply pumps on floors above the assumed inundation depth. As a sense of scale, our separate estimate for the storm surge zones of Osaka and Ise Bay puts the cost of raising such equipment at ¥30,000–¥250,000 per room, which is small compared with the differences in land cost per room. Second, allocate the first floor to uses such as the lobby and parking that are easy to restore after flooding, and concentrate guest rooms and machine rooms on upper floors. Third, reflect a business suspension period that assumes two weeks of continued inundation in the cash flow plan and insurance (flood coverage under fire insurance), and write guest-handling procedures for each stage of wide-area evacuation into the operating agreement. Differences in flood-risk rating zones also affect insurance premiums and borrowing terms, and should be estimated separately for each site.
Choose a location outside the zones
The raised ground of the Koto waterfront is outside the flood assumption zones and also suits larger room counts. However, part of it falls inside the storm surge zones, so both assumptions should be checked.
Get the specifications right in zones under 3m
In Sumida’s Ryogoku, Kinshicho and Oshiage, the flood assumption is mainly 0.5m to under 3m. By moving equipment to upper floors and being inventive with first-floor uses, it is easier to capture both high ADR and light land prices.
Compensate through the operating plan in zones of 3m or more
In the 3m-or-more zones common in Katsushika, Edogawa and Adachi, make use of inexpensive land on the premise of cash flow and insurance design that allow for closure periods, in addition to equipment placement.
Public-sector preparations are also advancing. Under the “TOKYO Resilience Project,” the Tokyo Metropolitan Government will invest a total project scale of ¥15 trillion through the 2040s, aiming to respond to sea level rise through 2100 (up to about 60cm) in its storm surge measures and to a 1.1-fold increase in rainfall associated with climate change in its inundation measures. As levees and drainage facilities are developed, there is room for the location assessment of the five wards to improve further. In addition, the five wards cite the homes of relatives and acquaintances and hotels in areas that will not be inundated as destinations for evacuation outside the wards, creating a new role — cooperation in receiving evacuees during disasters — for lodging facilities in surrounding wards and prefectures.
Of the J-REIT-owned hotels compiled by MetroEngines Research (as of September 21, 2026), four properties could be confirmed as located in the five wards (three hotels; the 440-room hotel in Kameido consists of two properties, P1 and P2), with 657 rooms (total acquisition price ¥12.669 billion), all owned by Invincible Investment Corporation (インヴィンシブル投資法人, 8963). On a building-confirmation-application basis as of the survey date (MLIT “Survey of Building Dynamics Statistics”), new hotel construction plans scheduled for completion in 2028 can also be confirmed in Ryogoku and Oshiage in Sumida and in Nishiarai in Adachi (* the number is expected to increase as further applications are filed; this is the lower bound of plans that can be confirmed at present). The five wards can be described as a market where listed-REIT ownership is still limited while new limited-service projects continue.
Frequently Asked Questions
Q. How many hotels in the Koto 5 Wards are in inundation zones?
A. Of the 147 hotels and 13,970 rooms operating as of September 23, 2026 in MetroEngines Research facility data, 139 hotels and 11,053 rooms (79.1% of rooms) fall inside the flood inundation zones (maximum assumed scale) of the Arakawa, Edogawa and other rivers. Forty-nine hotels and 3,369 rooms are in zones with an inundation depth of 3m or more. Rooms outside the zones are mainly on reclaimed waterfront land in Koto.
Q. Which of the Koto 5 Wards has the highest estimated settled ADR?
A. On a 12-month average for September 2025–August 2026, Sumida was highest at about ¥15,400, exceeding Tokyo as a whole (about ¥14,500) and Taito (about ¥14,400). Koto was about ¥14,200 and Edogawa about ¥12,000, with Edogawa posting the largest growth at +15.6% YoY.
Q. Are land prices in the Koto 5 Wards inexpensive relative to room rates?
A. The ratio of average commercial land price in the 2026 Official Land Prices to estimated settled ADR was 72–92x in the five wards. Compared with 174x in Taito and 597x in Chuo, land cost relative to rate is substantially lighter.
Q. What should be checked when planning a hotel on land in an inundation zone?
A. Check the assumed inundation depth for both flooding and storm surge, the inundation duration (some areas of the five wards exceed two weeks), and the stages at which wide-area evacuation is issued. On that basis, it is effective to build into the business plan a design that places power receiving and transformation equipment and emergency generators above the assumed inundation depth, first-floor uses that are easy to restore after flooding, and a cash flow plan and flood coverage that allow for closure periods.
Methodology and Sources
Hotels were extracted from the facility data on roughly 27,000 properties that MetroEngines Research tracks and can confirm as operating: the 147 hotels (13,970 rooms) located in Sumida, Koto, Adachi, Katsushika or Edogawa and operating as of September 23, 2026. Estimated settled ADR is the simple average of ward-level monthly values (the median of properties covered) over the 12 months from September 2025 to August 2026, compared with the prior-year period (September 2024–August 2025). Estimated OCC uses ward-level monthly estimates for June–August 2026.
Inundation zones, zoning, official land price points and station ridership were obtained as polygon and point data provided by the MLIT Real Estate Information Library, and classification was based on the zone containing each hotel’s representative coordinates (a single point). Flood depth follows the depth ranks in the National Land Numerical Information (under 0.5m / 0.5m to under 3.0m / 3.0m to under 5.0m / 5.0m to under 10.0m). Because classification is by representative coordinates, hotels where only part of the site falls in a zone, and building-side measures such as raised ground and flood barriers, are not reflected. The maximum assumed scale flood is based on rainfall with a probability of occurrence of roughly once in 1,000 years, and its inundation extent differs from that of more frequent flood scales. Ward-level land prices use the ward average prices and average rates of change in the 2026 Official Land Prices published by the Tokyo Metropolitan Government Bureau of Finance.
* The estimates in this article are simplified and intended for comparing locations. Actual investment decisions require a detailed feasibility study that takes into account the ground elevation, fronting road, building plan and insurance terms of the individual site.
Related Articles
References and Sources
■ Data sources
MetroEngines Research & Consulting facility data (147 operating hotels, 13,970 rooms as of September 23, 2026), estimated settled ADR (ward-level monthly medians, September 2024–August 2026) and estimated OCC (based on OTA-listed inventory, June–August 2026). Flood and storm surge inundation zones, zoning, 2026 official land price points and station ridership from the MLIT Real Estate Information Library. Ward average prices and rates of change from the Tokyo Metropolitan Government Bureau of Finance, “2026 Official Land Prices (Tokyo).”
■ Estimate assumptions
A limited-service hotel is assumed, with 30m² of gross floor area per room and a 500% FAR (6m² of site per room). Land unit price is the ward average commercial land price in the 2026 Official Land Prices; annual room revenue is estimated settled ADR (September 2025–August 2026 average) × OCC 80% (a full-year assumption) × 365 days. The three scenarios are optimistic = 600% FAR, ADR +10%, OCC 85%, and pessimistic = 400% FAR, ADR −10%, OCC 75%. Construction costs, acquisition costs, taxes and operating expenses are not included.
■ Limitations and caveats
Inundation zones and zoning are classified by a single representative coordinate for each hotel and do not reflect ground elevation, flood barriers, or cases where only part of the site falls in a zone. Estimated settled ADR is an estimate, and Adachi (N=5–6) and Katsushika (N=6–8) have few properties covered. Estimated OCC for June 2026 covers the 21 days from June 10 onward. Because there is a two- to three-fold gap between ward-average land prices and the highest-priced station-front points, point-level prices must be used when evaluating individual sites. J-REIT-owned properties are as of September 21, 2026.
■ Market data
- MetroEngines Research & Consulting — facility data (N=147 hotels), estimated settled ADR, estimated OCC, J-REIT-owned property data
■ Government statistics and public data
- MLIT Real Estate Information Library — flood inundation zones (maximum assumed scale), storm surge inundation zones, zoning, official land prices, station ridership
- MLIT National Land Numerical Information, “Flood Inundation Zone Data” (inundation depth rank codes)
- Tokyo Metropolitan Government Bureau of Finance, “2026 Official Land Prices (Tokyo)” (published March 17, 2026)
- Tokyo Metropolitan Government, “Overview of 2026 Official Land Prices (Tokyo)”
- MLIT, “Building Starts Statistics”
- Compiled by MetroEngines Research & Consulting from MLIT, “Survey of Building Dynamics Statistics” (new hotel construction plans, building-confirmation-application basis)
■ Disaster prevention plans and local government materials
- Koto 5 Wards Wide-Area Evacuation Promotion Council, “Koto 5 Wards Large-Scale Flood Hazard Map” (first edition, August 2018)
- Koto Ward, “Koto 5 Wards Large-Scale Flood Hazard Map and Koto 5 Wards Large-Scale Flood Wide-Area Evacuation Plan”
- Edogawa Ward, “Koto 5 Wards Large-Scale Flood Countermeasures Council”
- Edogawa Ward, “Evacuation Information in Edogawa Ward” (voluntary wide-area evacuation information, wide-area evacuation instruction)
- Sumida Ward, “Large-Scale Flood Countermeasures”
- Tokyo Metropolitan Government Office of the Governor for Policy Planning, “TOKYO Resilience Project”
■ REIT