

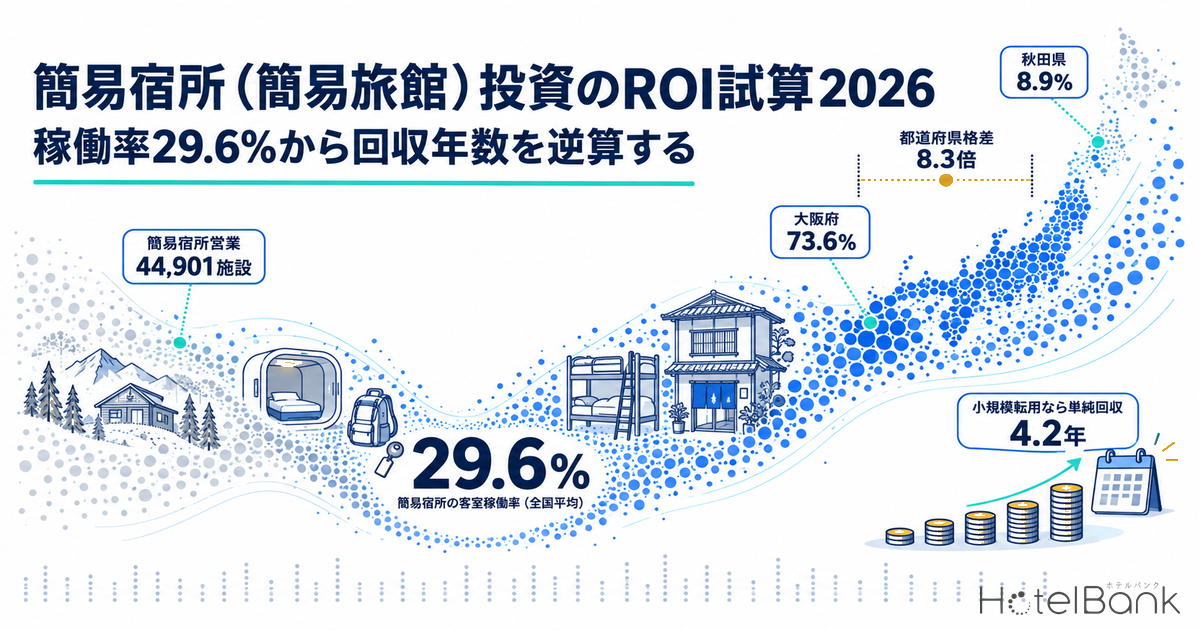
Anyone weighing an investment in lodging runs into the same question first: what does a simple lodging (kan’i shukusho, often searched for as a “simple inn”) actually return? The number of properties licensed under the simple lodging business category of the Hotel Business Act has grown to 44,901 nationwide, yet their room occupancy averages only 29.6%. This article combines published figures from the Ministry of Health, Labour and Welfare, the Japan Tourism Agency and Japan Finance Corporation with our own aggregation of OTA listed prices, and sets out the framework itself for estimating ROI (payback on investment).
Metric Definitions Used in This Article
- Simple lodging (business): one of the business categories defined in the Hotel Business Act, meaning “a business operated with structures and facilities in which the sleeping space is shared by many people (mountain huts, youth hostels, capsule hotels, etc.)” (Ministry of Health, Labour and Welfare, definitions in the Report on Public Health Administration and Services). This article treats “simple inn” (kan’i ryokan), the term commonly used in searches, as a synonym.
- Room occupancy (OCC): the occupancy rates used in this article are the room occupancy rates by type of accommodation published in the Japan Tourism Agency’s Overnight Travel Statistics Survey (2025 annual figures, finalized). They are not our estimated occupancy based on OTA inventory.
- Listed price: the average across all plans of the selling prices each property publishes on OTAs and elsewhere (two guests per room, per-room rate, tax included). Because unsold high-priced plans stay on the listings, it runs higher than the rate actually booked.
- ADR (estimated settled ADR): an estimated settled rate (tax-excluded equivalent), calculated by applying a format-specific correction factor to the cheapest plan level each property publishes on OTAs (two guests per room, per-room rate, tax included). Checked against property-level results disclosed by listed hotel REITs (91 properties, most recent three months), the median error is about 7%. It is an estimate and differs from each property’s actual booked prices and accounting figures. In this article it is used only for capsule hotels, the category for which it has been validated; hostels, guesthouses and dormitories are described with listed prices.
- Data sources: MetroEngines Research & Consulting / Ministry of Health, Labour and Welfare, Report on Public Health Administration and Services / Japan Tourism Agency, Overnight Travel Statistics Survey / Japan Finance Corporation Research Institute, Survey on Business Startups
- — Simple lodging businesses have grown to 44,901 properties (end of FY2024, +7.1% YoY), yet national room occupancy is only 29.6% (2025 annual figure, finalized).
- — Occupancy differs 8.3× between prefectures (Osaka 73.6% / Akita 8.9%). The rank correlation with the number of licensed properties is +0.19: the prefectures with the most supply are not the ones with the deepest demand.
- — The median listed price is ¥15,300 (6 prefectures, N=518 properties, Sep 2025–Aug 2026). Levels split by lodging type: hostels ¥19,800, guesthouses ¥13,500.
- — Startup costs have a median of ¥6M and a mean of ¥9.75M (JFC FY2025 survey, n=2,165). That fits the guesthouse median of 4 rooms: the standard entry is a conversion of an existing building with a handful of rooms.
- — On simple payback (11 rooms, 30% operating margin assumed), a ¥10M initial investment is recovered in 4.2 years even at 25% occupancy, but at ¥60M the site has to deliver 55% occupancy or a ¥18,000 rate.
What Is the Simple Lodging Business? Hotel Business Act Categories and Facility Standards
The business categories under the Hotel Business Act were revised by an amendment in force from June 15, 2018, which merged the “hotel business” and “ryokan business” into a single “ryokan and hotel business”. There are now three categories: ryokan and hotel business, simple lodging business and boarding house business, each with its own licensing requirements, and the Act was amended again in 2023. The Ministry of Health, Labour and Welfare defines the simple lodging business as “a business operated with structures and facilities in which the sleeping space is shared by many people (mountain huts, youth hostels, capsule hotels, etc.)”. Dormitory-style hostels and guesthouses are the typical examples, but many small properties built mainly around private rooms also operate under this license.
What matters for investors is that the licensing requirements are lighter than for the ryokan and hotel business. Article 1 of the Hotel Business Act Enforcement Order sets the following structural and facility standards for the simple lodging business.
| Standard | Requirement |
|---|---|
| Total guest-room floor area | 33 m² or more; where the license application sets capacity at fewer than 10 guests, “3.3 m² × number of guests” or more |
| Bunk beds | Roughly 1 m or more between the upper and lower berths |
| Ventilation, lighting, etc. | Adequate ventilation, natural lighting, artificial lighting, damp-proofing and drainage |
| Bathing facilities | Facilities on a scale that meets guests’ needs, unless a public bath nearby or similar means bathing is judged not to be hindered |
| Washbasins and toilets | Washbasins on a scale adequate for guests’ needs and an adequate number of toilets |
| Prefectural ordinances | In addition to the above, compliance with standards set by prefectural ordinance (including cities with public health centers and Tokyo’s special wards) |
Source: Hotel Business Act Enforcement Order (Cabinet Order No. 152 of 1957), Article 1; compiled by MetroEngines Research & Consulting
The provision to note is the relaxation “3.3 m² × number of guests where capacity is under 10”. With capacity of nine, 29.7 m² of guest-room floor area is enough, which makes converting an ordinary detached house or a single condominium unit viable. Nor does the simple lodging business carry any requirement to install a front desk (genkan-choba). These light requirements are what have made small-scale entry through the conversion of existing buildings possible. For a city-by-city breakdown of payback when a vacant house is converted into a whole-house rental, see Simple Lodging × Vacant Home Reuse 2026: Kyoto, Osaka & Naha Whole-House IRR.
The result shows up in the property count. While the ryokan and hotel business fell by about 30%, from 76,751 properties in FY1997 to 52,946 in FY2024, the simple lodging business grew from 25,324 to 44,901, +77.3%. Growth accelerated sharply from FY2015 onward, and at the end of FY2024 the category was up 2,992 properties (+7.1%) year on year, outpacing the ryokan and hotel business at +3.7%.
Source: Ministry of Health, Labour and Welfare, Report on Public Health Administration and Services (as of each fiscal year-end); compiled by MetroEngines Research & Consulting
Note, however, that this figure counts licenses, not rooms. The Report on Public Health Administration and Services publishes room counts for the ryokan and hotel business, but only property counts for the simple lodging and boarding house businesses. Gauging the size of each property needs another clue, and that is our data in the next section.
Revenue Side: Room Counts and Listed Price Distribution for Hostels and Guesthouses
Estimating revenue takes two things: how many rooms there are, and what one room actually sells for. We track about 168,000 properties in Japan. From the master of about 27,000 whose activity on OTAs can be confirmed, extracting five types—hostels, guesthouses, dormitories, capsule hotels and youth hostels (the lodging types most often operated under a simple lodging license)—gives 2,977 active properties.
A note on populations. The 2,977 properties in this section are counted by our own lodging-type classification, not matched one by one against their license category under the Hotel Business Act. They are a different population from the 44,901 simple lodging businesses published by the Ministry of Health, Labour and Welfare (the latter include mountain huts, seasonal minshuku and inactive licenses; the former exclude properties not listed on OTAs). The two figures cannot be added or subtracted, and the difference between them cannot be read as meaning anything in particular.
The median room count makes the reality of this segment clear.
| Lodging type | Properties | Median rooms | Mean rooms | Share with 1–4 rooms |
|---|---|---|---|---|
| Guesthouse | 1,515 | 4 rooms | 8.0 rooms | 49.7% |
| Hostel | 1,050 | 11 rooms | 17.5 rooms | 28.3% |
| Dormitory | 166 | 14 rooms | 23.2 rooms | 22.9% |
| Capsule hotel | 237 | 114 rooms | 129.0 rooms | 0.8% |
| Youth hostel | 9 | 7 rooms | 7.4 rooms | 11.1% |
Source: MetroEngines Research & Consulting (confirmed-active basis, N=2,977 properties; room counts calculated over the 2,951 properties with a registered count)
Half of all guesthouses have 1–4 rooms, and even the hostel median is 11 rooms. Only capsule hotels (median 114 rooms) are a different animal: in building scale and capital expenditure alike they are close to ordinary hotel development. In other words, even under the single heading of “investing in simple lodging”, residential conversions costing a few million yen and capsule developments costing hundreds of millions sit under the same business license. Any discussion of ROI has to begin by separating the two.
Next, price. The distribution below covers 518 properties in six prefectures—Kyoto, Tokyo, Okinawa, Osaka, Hokkaido and Fukuoka—that were listed in at least six of the last 12 months (Sep 2025–Aug 2026), with each property’s monthly listed price (all-plan average, two guests per room, tax included) averaged at property level.
Source: MetroEngines Research & Consulting (N=518 properties, Sep 2025–Aug 2026)
The median is ¥15,300, with a wide interquartile range of ¥10,900–¥25,500. The top 18.3% sit above ¥30,000 because the mix includes whole-house rentals and machiya-style products where one room is booked by one group; note that these are not prices for a single dormitory bed. By type, the picture is as follows.
| Lodging type | N | 1st quartile | Median | 3rd quartile |
|---|---|---|---|---|
| Hostel | 240 | ¥12,700 | ¥19,800 | ¥32,700 |
| Guesthouse | 224 | ¥9,900 | ¥13,500 | ¥20,800 |
| Capsule hotel | 34 | ¥13,100 | ¥15,000 | ¥18,300 |
| Dormitory | 18 | ¥9,500 | ¥11,200 | ¥16,700 |
| All 5 types | 518 | ¥10,900 | ¥15,300 | ¥25,500 |
Source: MetroEngines Research & Consulting (listed price, all-plan average, two guests per room, tax included; youth hostels omitted as N=2)
Medians by region: Kyoto ¥21,100 (N=135), Tokyo ¥18,000 (N=98), Hokkaido ¥17,400 (N=74), Fukuoka ¥14,500 (N=29), Osaka ¥13,700 (N=56) and Okinawa ¥11,100 (N=126). Kyoto and Okinawa are 1.9× apart. Even within the Tokyo metropolitan area, supply swings widely from one city or ward to the next.
Do not put listed prices straight into the revenue assumption
The listed price is “the average of all plans, including unsold high-priced ones”, and it comes out higher than the rate actually booked per room. Of the five types, capsule hotels are the only one for which estimated settled ADR has been validated. In our Tokyo measurements, the median estimated settled ADR over the 10 qualifying months of the last 12 was ¥5,800 (tax-excluded equivalent; median of 38 properties covered), against a median listed price over the same 12 months of ¥15,000 (34 properties). Capsules list single-occupancy inventory within a two-guests-per-room price structure, which makes the gap especially large for this format, so the ratio cannot be applied as-is to hostels or guesthouses. The direction, though—listed price > booked rate—is common to all of them. In a business plan, treat the listed price as an upper reference and set your own rate assumption as a range.
Occupancy: Location Is the Variable That Moves ROI Most
Of the three components of the revenue formula (rate, occupancy, rooms), occupancy is the one operators most often misjudge in advance. The Japan Tourism Agency’s Overnight Travel Statistics Survey publishes room occupancy by type of accommodation, and simple lodgings are one of those categories. The 2025 annual figures (finalized) are as follows.
| Type of accommodation | 2025 room occupancy | Change vs prior year | Change vs 2019 |
|---|---|---|---|
| All types | 61.6% | +2.0pt | -1.1pt |
| Business hotels | 75.3% | +1.6pt | -0.5pt |
| City hotels | 74.1% | +1.8pt | -5.4pt |
| Resort hotels | 56.9% | +2.8pt | -1.6pt |
| Ryokan | 38.2% | +2.1pt | -1.4pt |
| Simple lodgings | 29.6% | +0.6pt | -3.8pt |
Source: Japan Tourism Agency, Overnight Travel Statistics Survey, 2025 annual figures (finalized); compiled by MetroEngines Research & Consulting
Simple lodgings’ 29.6% is the lowest of the five types in the table (among the agency’s six categories, company and group lodging facilities are lower still at 24.2%), and their shortfall against 2019 (33.4%) is the second largest after city hotels (−5.4pt), at −3.8pt. That contrasts with business hotels, which have recovered to within −0.5pt, and the difference stems from the supply side. From FY2019 to FY2024 the number of licensed simple lodging businesses rose 20.4%, from 37,308 to 44,901, so the pattern reads as added supply absorbing the recovery in demand.
Source: Japan Tourism Agency, Overnight Travel Statistics Survey (2025 figures finalized); compiled by MetroEngines Research & Consulting
Monthly figures show strong seasonality too. In 2025 simple lodgings climbed to 39.1% in August and fell to 24.5% in December. The swing across the year is 14.6pt, close in width to business hotels (high 81.4%, low 66.6%, 14.8pt), but because the level is lower, the relative impact of the swing is far greater. Revenue at 39.1% is 1.6× revenue at 24.5%.
Source: Japan Tourism Agency, Overnight Travel Statistics Survey (2025 and 2024 figures finalized); compiled by MetroEngines Research & Consulting
And the factor that moves ROI most is the difference between prefectures. In 2025 simple lodging room occupancy ranged 8.3×, from 73.6% in Osaka to 8.9% in Akita. That is far larger than the rate gap (1.9× between Kyoto and Okinawa).
Source: Japan Tourism Agency, Overnight Travel Statistics Survey, 2025 annual figures (finalized) / Ministry of Health, Labour and Welfare, Report on Public Health Administration and Services, FY2024; compiled by MetroEngines Research & Consulting
Setting the top 10 prefectures beside the bottom 10 shows that occupancy and the number of licensed properties are entirely separate stories.
| Rank | Top 10 | Occupancy | Simple lodging properties | Rank | Bottom 10 | Occupancy | Simple lodging properties |
|---|---|---|---|---|---|---|---|
| 1 | Osaka | 73.6% | 773 | 38 | Nagano | 13.6% | 4,361 |
| 2 | Kyoto | 52.0% | 3,647 | 39 | Hyogo | 13.4% | 986 |
| 3 | Tokyo | 48.6% | 1,256 | 40 | Ibaraki | 12.8% | 266 |
| 4 | Fukuoka | 44.8% | 400 | 41 | Shiga | 11.7% | 527 |
| 5 | Aichi | 38.2% | 158 | 42 | Fukui | 10.6% | 541 |
| 6 | Okinawa | 34.7% | 3,804 | 43 | Fukushima | 10.5% | 652 |
| 7 | Okayama | 33.8% | 412 | 44 | Ehime | 10.3% | 532 |
| 8 | Mie | 33.2% | 284 | 45 | Tottori | 10.0% | 448 |
| 9 | Miyagi | 31.0% | 335 | 46 | Saga | 9.6% | 194 |
| 10 | Kagawa | 29.6% | 811 | 47 | Akita | 8.9% | 307 |
Source: Japan Tourism Agency, Overnight Travel Statistics Survey, 2025 annual figures (finalized) / Ministry of Health, Labour and Welfare, Report on Public Health Administration and Services, as of end of FY2024; compiled by MetroEngines Research & Consulting
Nagano, which has the most licensed properties in Japan (4,361), ranks 38th on occupancy at 13.6%; second-placed Okinawa (3,804) ranks 6th at 34.7%; and third-placed Kyoto (3,647) ranks 2nd at 52.0%. Meanwhile Osaka, top on occupancy, has only 773 properties—21st in Japan by supply. Across the 47 prefectures, the rank correlation between property count and occupancy is +0.19, essentially no correlation.
How to read the lack of correlation. Simple lodging licenses cover not only urban hostels but also mountain huts, seasonal minshuku and ski-resort lodges. That layer is the main reason Nagano, Yamanashi and Shizuoka have so many properties, and because properties with few operating days enter the count, annual occupancy comes out structurally low. So one cannot jump to either “many properties = fierce competition” or “few properties = untapped market”. What an investment decision should look at is not the license count but measured occupancy and rates in the area.
Cost and Initial Investment: Built Only From Published Figures
Investment amounts vary by an order of magnitude with the property, location and specification, so we do not set our own “standard initial investment”. Instead we refer directly to the actual amounts published by public bodies.
Actual startup costs. According to the Japan Finance Corporation Research Institute’s FY2025 Survey on Business Startups (surveyed August 2025; 2,165 firms within a year of opening responded; all industries except real estate leasing), startup costs had a mean of ¥9.75M and a median of ¥6M. In the distribution, “under ¥2.5M” accounted for 20.1% and “¥2.5M to under ¥5M” for 21.7%, so more than 40% came in under ¥5M. The survey notes a long-term trend toward smaller startup costs.
Funds raised at opening averaged ¥12.19M, of which “borrowing from financial institutions, etc.” was ¥8.27M (67.9%) and “own funds” ¥2.79M (22.9%). Those two account for 90.7%.
| Item | Amount | Note |
|---|---|---|
| Startup cost, median | ¥6M | All industries · n=2,165 |
| Startup cost, mean | ¥9.75M | Large investments pull the mean up |
| Funds raised, mean | ¥12.19M | Includes working capital |
| of which: borrowing from financial institutions, etc. | ¥8.27M | 67.9% of funds raised |
| of which: own funds | ¥2.79M | 22.9% of funds raised |
Source: Japan Finance Corporation Research Institute, FY2025 Survey on Business Startups (published December 5, 2025); compiled by MetroEngines Research & Consulting
It is worth checking consistency with our data here. A guesthouse median of 4 rooms, with half at 1–4 rooms, meshes comfortably with a median startup cost of ¥6M. Two independent data sets, one from the supply side and one from the funding side, point the same way: the standard form of entry in this segment is a conversion of an existing home with a handful of rooms. Capsule hotels (median 114 rooms), by contrast, are clearly outside this range and need a different financing plan as developments involving construction.
Reference figures for new construction. Based on the Ministry of Land, Infrastructure, Transport and Tourism’s Statistics on Building Construction Starts, hotel construction cost in 2024 averaged ¥1.95M per tsubo across all structures (RC ¥1.736M, steel ¥1.648M; 1 tsubo = 3.31 m²). That is up 41% in two years from ¥1.38M in 2022, and in 2025 it stayed high at ¥1.952M across all structures. Avoiding this new-build cost is why conversions of existing buildings are so common for simple lodgings.
Financing. Japan Finance Corporation’s General Loans (Sanitation-Related Business Loans) set, for the ryokan business, a loan limit of ¥400M and a repayment period of up to 13 years (including a grace period of up to 1 year, or up to 2 years where the repayment period exceeds 7 years). The scheme covers simple lodgings licensed under the Hotel Business Act, while private lodging businesses under the Private Lodging Business Act and foreign-visitor accommodation businesses in National Strategic Special Zones are excluded. Funds may be used only for equipment, not for working capital such as labor or advertising costs. Whether you obtain a business license determines which public loan schemes you can use.
Source: Japan Finance Corporation, General Loans (Sanitation-Related Business Loans); compiled by MetroEngines Research & Consulting
The ROI Formula and Sensitivity Analysis: Moving Payback With Three Variables
Formulas
Annual revenue = average selling rate per room × room occupancy × number of rooms × 365
Annual operating profit = annual revenue × operating margin
Simple payback (years) = initial investment ÷ annual operating profit
Gross ROI = annual operating profit ÷ initial investment
Start with a unit that does not depend on scale: annual revenue per room (= rate × occupancy × 365). This becomes the yardstick for choosing a location. Note that the occupancy rates and rates in the sensitivity tables below are all assumptions for the model, not measured values. Measured room occupancy comes from the Japan Tourism Agency’s Overnight Travel Statistics Survey, 2025 annual figures (finalized), as seen in the previous section.
| Average selling rate per room | 25% occupancy (assumed) | 40% occupancy (assumed) | 55% occupancy (assumed) | 70% occupancy (assumed) |
|---|---|---|---|---|
| ¥8,000 | ¥730,000 | ¥1,168,000 | ¥1,606,000 | ¥2,044,000 |
| ¥12,000 | ¥1,095,000 | ¥1,752,000 | ¥2,409,000 | ¥3,066,000 |
| ¥18,000 | ¥1,642,500 | ¥2,628,000 | ¥3,613,500 | ¥4,599,000 |
Source: MetroEngines Research & Consulting estimates (occupancy and rates in the table are sensitivity-analysis assumptions, not measured values)
A ¥8,000 rate at 25% occupancy yields ¥730k a year per room; ¥18,000 at 70% yields ¥4.6M. Within the same “simple lodging” label, the revenue one room generates differs 6.3×. 25% occupancy is slightly below the 29.6% national average and 70% is close to Osaka (73.6%), so both ends are ranges that actually occur.
Next, set the operating margin and room count to derive the payback period. The assumptions are as follows.
| Assumption | Value used | Basis |
|---|---|---|
| Rooms | 11 rooms | Median hostel room count in our data (N=1,042 properties) |
| Operating margin | 30% (conservative) | Among listed REITs’ operating results, the GOP margin for the 91 properties of Invincible Investment Corporation operated by MHM (MyStays Hotel Management) was 38.9% (fiscal period ended December 2024). For simple lodgings, which are small and pay a high share of OTA commissions, 30% was adopted on the assumption that margins fall below even that benchmark |
| Initial investment | ¥10M / ¥30M / ¥60M | Three levels: the JFC survey’s mean startup cost of ¥9.75M as the lowest tier, and cases involving construction or major renovation as the upper tiers |
| Recovered amount | Initial investment only | Simple payback before deducting rent, depreciation, interest and tax. For leased properties, rent needs to be reflected on the operating-margin side |
Source: MetroEngines Research & Consulting (the source of each assumption is given in its row)
On these assumptions, the table below shows the simple payback period when the three variables—initial investment, rate and occupancy—are varied.
| Initial investment | Occupancy | Rate ¥8,000 | Rate ¥12,000 | Rate ¥18,000 |
|---|---|---|---|---|
| ¥10 million | 25% | 4.2 yrs | 2.8 yrs | 1.8 yrs |
| 40% | 2.6 yrs | 1.7 yrs | 1.2 yrs | |
| 55% | 1.9 yrs | 1.3 yrs | 0.8 yrs | |
| 70% | 1.5 yrs | 1.0 yrs | 0.7 yrs | |
| ¥30 million | 25% | 12.5 yrs | 8.3 yrs | 5.5 yrs |
| 40% | 7.8 yrs | 5.2 yrs | 3.5 yrs | |
| 55% | 5.7 yrs | 3.8 yrs | 2.5 yrs | |
| 70% | 4.4 yrs | 3.0 yrs | 2.0 yrs | |
| ¥60 million | 25% | 24.9 yrs | 16.6 yrs | 11.1 yrs |
| 40% | 15.6 yrs | 10.4 yrs | 6.9 yrs | |
| 55% | 11.3 yrs | 7.5 yrs | 5.0 yrs | |
| 70% | 8.9 yrs | 5.9 yrs | 4.0 yrs |
Source: MetroEngines Research & Consulting estimates (11 rooms, 30% operating margin, simple payback before rent and depreciation) (occupancy and rates in the table are sensitivity-analysis assumptions, not measured values)
Three things stand out.
First, at the ¥10M investment level, payback takes 4.2 years even at 25% occupancy. That matches the reality shown in the JFC survey, where more than 40% of startup costs came in under ¥5M. A conversion of an existing home with a handful of rooms and minimal capital expenditure can work as a business even at below-average occupancy. The light requirements of the simple lodging category are what underpin these economics.
Second, the picture changes completely once investment rises to ¥60M. Rates and occupancy are both assumptions, but at a ¥8,000 rate and 25% occupancy payback takes 24.9 years, and even at 40% occupancy it takes 15.6 years. At a scale involving construction or major renovation, payback within 10 years is out of reach unless the location can secure either 55%+ occupancy or a ¥18,000+ rate. The larger the investment, the narrower the choice of locations—which looks obvious, but is easy to miss when the initial investment and the location are considered separately.
Third, occupancy has more leverage than rate. Within the assumed ranges, raising the rate 2.25× from ¥8,000 to ¥18,000 cuts the payback period to 0.44×, whereas raising occupancy 2.8× from 25% to 70% cuts it to 0.36×. And while the rate leaves some room to move through your own product design, most of occupancy is decided by location. The 8.3× prefectural gap seen in the previous section is the variable with the widest swing in this model.
Source: MetroEngines Research & Consulting estimates (11 rooms, 30% operating margin, ¥30M initial investment)
Fourth, how the operating margin is set moves the payback period by as much as rate and occupancy do. The table above fixes the operating margin at a single point, 30%, but that assumption itself has a range. Holding the rate at ¥12,000 and occupancy at 40% (both assumptions) and moving only the operating margin gives the following.
| Operating margin (assumed) | ¥10M initial investment | ¥30M | ¥60M | Basis for the level |
|---|---|---|---|---|
| 25% | 2.1 yrs | 6.2 yrs | 12.5 yrs | Leased property, with rent reflected on the operating-profit side |
| 30% | 1.7 yrs | 5.2 yrs | 10.4 yrs | This article’s standard assumption (set on the conservative side) |
| 38.9% | 1.3 yrs | 4.0 yrs | 8.0 yrs | Listed REIT’s limited-service operating results (Invincible Investment Corporation, 91 MHM-operated properties, fiscal period ended December 2024) |
Source: MetroEngines Research & Consulting estimates (assumptions other than operating margin are the same as the table above) (occupancy, rates and operating margins in the table are sensitivity-analysis assumptions, not measured values)
At the ¥60M level, payback that takes 10.4 years at a 30% operating margin shrinks to 8.0 years at 38.9%, matching the listed REIT’s limited-service operating results. Conversely, if leasing drags the margin down to 25%, it takes 12.5 years. Same property, same rate, same occupancy—yet the payback period moves 1.5× depending on the operating margin. Build a business plan by refining only rate and occupancy, and this is the variable most likely to be overlooked. Self-operation or management contract, lease or ownership, and how much OTA commission can be shifted to direct sales—settle these three before setting the payback assumptions.
Limits of this model
The tables above show simple payback before deducting rent, depreciation, interest and tax; they are not a business plan. For a leased property, rent cuts directly into operating profit, so the 30% operating-margin assumption itself needs revisiting. Simple lodging occupancy is also highly seasonal (2025 low 24.5%, high 39.1%), so even where the numbers work on an annual average, there can be months in which cash flow falls short of operating costs. An actual investment decision requires a detailed feasibility study that reflects the conditions of the specific property.
Risk Factors: Zoning, Fire Safety and Ordinances Can Stop a Plan
The typical way payback assumptions for a simple lodging collapse is not on the numbers but by stumbling on permits. If it turns out after acquiring a property that you cannot build or cannot get a license, the investment stays sunk while revenue is zero.
Zoning. Under the Building Standards Act a simple lodging is treated as a “hotel or ryokan”, so the same use restrictions apply as for the ryokan and hotel business. It cannot be built in exclusively residential zones (Category 1 and 2 low-rise exclusively residential, Category 1 and 2 mid/high-rise exclusively residential), industrial zones or exclusively industrial zones. In Category 1 residential zones it is permitted only up to 3,000 m² of floor area. Trying to convert a vacant house in a residential neighborhood and then discovering the zoning rules it out is a recurring pattern.
| Zoning district | Hotels and ryokan (including simple lodgings) |
|---|---|
| Category 1 low-rise exclusively residential / Category 2 low-rise exclusively residential | Not permitted |
| Category 1 mid/high-rise exclusively residential / Category 2 mid/high-rise exclusively residential | Not permitted |
| Category 1 residential | Permitted only up to 3,000 m² of floor area |
| Category 2 residential / Quasi-residential / Neighborhood commercial / Commercial / Quasi-industrial | Permitted |
| Industrial / Exclusively industrial | Not permitted |
Source: Tokyo Metropolitan Government Bureau of Urban Development, “Overview of Building Use Restrictions by Zoning District” and others; compiled by MetroEngines Research & Consulting. Whether a specific building is permitted depends on special use districts, district plans and so on, so confirm with the relevant administrative agency
Fire safety equipment. Lodging facilities fall under item (5)(a) of Appended Table 1 of the Fire Service Act Enforcement Order (ryokan, hotels, lodging houses and similar). An amendment in force from April 1, 2015 extended the obligation to install automatic fire alarm systems to all item (5)(a) facilities regardless of total floor area. For small facilities under 300 m² of total floor area, a wireless interconnected “automatic fire alarm system for specified small-scale facilities” is accepted, and this is where the cost branches. A license application requires a certificate of compliance with fire safety laws, so fire safety works, as a precondition for obtaining the license, affect both schedule and cost.
Prefectural and municipal ordinances. Article 1, Paragraph 2, Item 7 of the Hotel Business Act Enforcement Order requires, on top of the national structural and facility standards, “compliance with structural and facility standards set by prefectural ordinance”. Ordinances differ by area, including cities with public health centers and special wards, and some municipalities add procedures for consideration of the surrounding environment (such as briefings for neighbors). In addition, Osaka, Kyoto and Tokyo, which rank near the top on simple lodging occupancy, all have deep lodging demand but are also areas where local rules for lodging facilities and accommodation taxes are advancing. The higher a location’s occupancy, the heavier its regulation tends to be—a trade-off to build in at the planning stage.
The risk of supply growth itself. Licensed simple lodging businesses grew 7.1% (+2,992 properties) year on year in FY2024, a faster pace than the ryokan and hotel business at +3.7%. Over the same period, national simple lodging room occupancy improved by only 0.6pt. It is not that demand has failed to grow; rather, the added supply is sharing the added demand. If you are setting a five- or ten-year payback plan, check the trend in license counts in the target area together with whether your property has anything that differentiates it.
Summary: Simple Lodging ROI Depends Less on How Much You Invest Than on Where
To recap the framework built in this article:
On the revenue side, annual revenue per room = rate × occupancy × 365. In our aggregation, the median listed price across 518 properties in six prefectures is ¥15,300, and levels split by lodging type: hostels ¥19,800, guesthouses ¥13,500. But listed prices come out higher than booked rates, so a business plan’s rate assumption should treat the listed price as an upper reference and be set as a range of your own.
Occupancy is 29.6% nationally on the Japan Tourism Agency’s published figures. Yet it ranges 8.3× from 73.6% in Osaka to 8.9% in Akita, and it is essentially uncorrelated with the number of licensed properties (rank correlation +0.19). The prefectures with the most supply are not the ones with the deepest demand.
On the cost side, the JFC survey’s median startup cost of ¥6M and mean of ¥9.75M are the realistic starting point. They are consistent with our guesthouse median of 4 rooms: the standard in this segment is a conversion of an existing building with a handful of rooms. For public financing, JFC’s General Loans (Sanitation-Related Business Loans) offer up to ¥400M over up to 13 years for the ryokan business, and simple lodgings are eligible.
The conclusion of the sensitivity analysis is clear. At the ¥10M investment level, payback takes 4.2 years even at 25% occupancy, but at the ¥60M level payback within 10 years is out of reach unless the location can secure either 55% occupancy or a ¥18,000 rate. And most of occupancy is decided by location. Rather than fixing the investment amount and then looking for a location, work back from a location’s occupancy track record to the maximum amount you can afford to invest—that is the order of operations for getting simple lodging (simple inn) ROI right.
Related Reading
References & Sources
■ Data sources
The revenue side uses our aggregation of OTA listed prices (five types—hostels, guesthouses, dormitories, capsule hotels and youth hostels—covering 518 properties in six prefectures, Kyoto, Tokyo, Okinawa, Osaka, Hokkaido and Fukuoka, listed in at least six of the last 12 months, Sep 2025–Aug 2026) and our property master (2,977 properties, confirmed-active basis). Occupancy is quoted directly from the Japan Tourism Agency’s Overnight Travel Statistics Survey, 2025 annual figures (finalized); property counts from the Ministry of Health, Labour and Welfare’s Report on Public Health Administration and Services, FY2024; and costs and funding from the Japan Finance Corporation Research Institute’s FY2025 Survey on Business Startups (n=2,165). Nowhere do we estimate investment amounts on our own.
■ Model assumptions
Annual revenue = average selling rate per room × room occupancy × rooms × 365; annual operating profit = annual revenue × operating margin; simple payback = initial investment ÷ annual operating profit; gross ROI = annual operating profit ÷ initial investment. Rooms are set at 11 (the median hostel room count in our data), and operating margin at a standard 30%, with sensitivity taken at three levels by adding 25% (leased case) and 38.9% (a listed REIT’s limited-service operating results). Initial investment is set at three levels: ¥10M / ¥30M / ¥60M. Payback is simple payback before rent, depreciation, interest and tax, and the occupancy, rates and operating margins in the sensitivity tables are all assumptions, not measured values.
■ Limits and caveats
The 2,977 properties in our lodging-type classification and the 44,901 simple lodging businesses published by the Ministry of Health, Labour and Welfare are different populations; they cannot be added or subtracted, and the difference cannot be read as meaning anything in particular. Listed prices are all-plan averages that include unsold high-priced plans and run higher than booked rates (of the five types, only capsule hotels have been validated with estimated settled ADR). Occupancy figures are national and prefectural averages by type of accommodation, not the results of any individual location, and are highly seasonal. In addition, zoning, fire safety equipment and local ordinances can prevent a plan from working at all, so this article presents a modeling framework, not an investment decision.
■ Market data
- MetroEngines Research & Consulting — OTA listed-price aggregation (five types: hostels, guesthouses, dormitories, capsule hotels and youth hostels; 6 prefectures, N=518 properties, Sep 2025–Aug 2026), property master (confirmed-active basis, N=2,977 properties), estimated settled ADR (Tokyo capsule hotels)
■ Laws and regulations
- Hotel Business Act Enforcement Order (Cabinet Order No. 152 of 1957), Article 1 — structural and facility standards for the simple lodging business (Ministry of Health, Labour and Welfare)
- Fire and Disaster Management Agency, “Study on extending the obligation to install automatic fire alarm systems to small facilities with lodging”
- Tokyo Metropolitan Government Bureau of Urban Development, “Overview of Building Use Restrictions by Zoning District”
■ Government statistics
- Ministry of Health, Labour and Welfare, “Overview of the FY2024 Report on Public Health Administration and Services” — 98,338 lodging businesses, 44,901 simple lodging businesses, property counts by prefecture
- e-Stat, Report on Public Health Administration and Services, supplementary table “Number of lodging businesses by year, FY1997 onward” (statistics IDs: 0004048085 / 0004026910)
- Japan Tourism Agency, “Overnight Travel Statistics Survey (2025 annual figures, finalized)” (published July 6, 2026) — room occupancy by type of accommodation and prefecture
- Ministry of Land, Infrastructure, Transport and Tourism, Statistics on Building Construction Starts — hotel construction cost per tsubo (2024 and 2025)
■ Financial institutions and industry materials
- Japan Finance Corporation Research Institute, “FY2025 Survey on Business Startups” (published December 5, 2025, n=2,165)
- Japan Finance Corporation, “General Loans (Sanitation-Related Business Loans)” — loan limit and repayment period for the ryokan business
- Invincible Investment Corporation — GOP results for MHM-operated hotels (fiscal period ended December 2024, 91 properties)