

When investors look at entering the lodging business, the option that always comes up right after a ryokan/hotel business (a purpose-built property) is the simple lodging business (kan’i shukusho eigyo). In practice it is also called a budget inn (kan’i ryokan), but the formal licence category under the Inns and Hotels Act is “simple lodging business”, and this article uses that term throughout. It can be opened by converting an existing building, and there is no minimum room count. Because the entry cost is an order of magnitude smaller, the investor base is broad, from individual investors to regional developers.
Yet most articles that discuss ROI in this segment never say where assumptions such as “70% occupancy” or “15% yield” come from. This article (1) checks the requirements against the current text of the Inns and Hotels Act and its Enforcement Order, (2) lays out the measured room occupancy of simple lodgings by prefecture from the Japan Tourism Agency (JTA) Overnight Travel Statistics Survey, (3) aggregates price levels from OTA listed prices, and (4) estimates revenue, GOP and yield per room in three steps. Every assumption is disclosed.
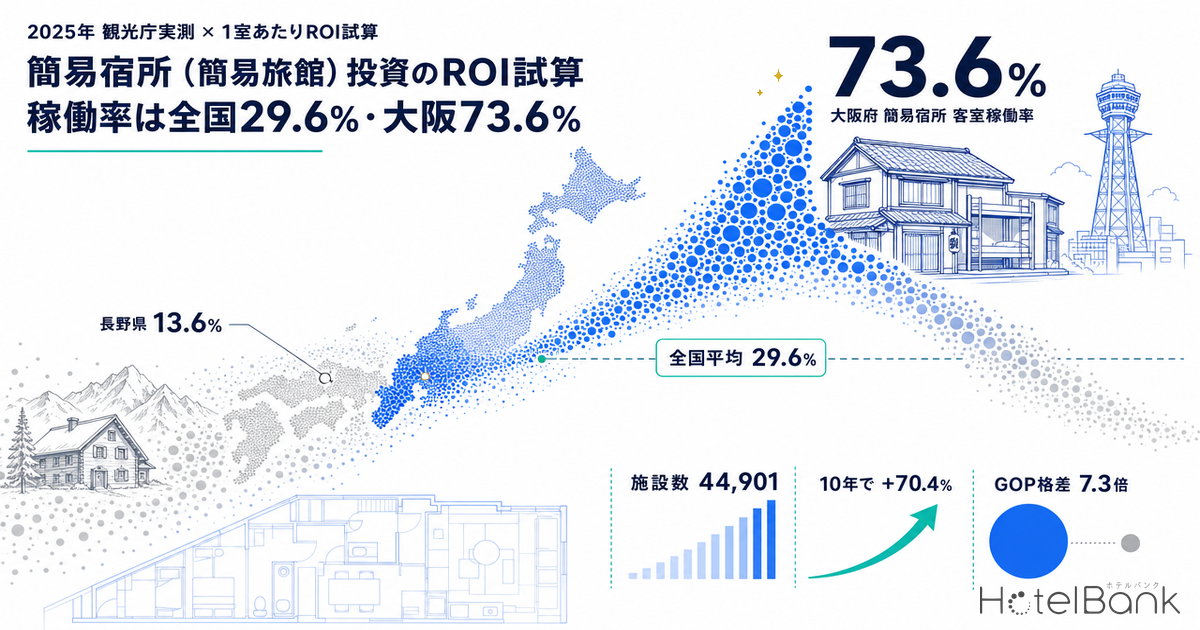
The conclusion first. Room occupancy at simple lodgings in 2025 was 29.6% nationally. But that average is useless for investment decisions. Osaka recorded 73.6% against Nagano’s 13.6%—a 5.4-fold gap within the same licence category. And across the 44,901 facilities nationwide, there is a clear inverse relationship: the more facilities a prefecture has, the lower its occupancy.
Metric Definitions Used in This Article
- Room occupancy (JTA): Room occupancy by accommodation type from Table 8 of the JTA Overnight Travel Statistics Survey. Every mention of “occupancy” in this article refers to this measured public statistic, not to our own estimate. Accommodation type is self-reported by the surveyed facilities.
- Listed price: The average across all plans (room-only through meal-inclusive) of the selling prices published on major booking sites, per room for two guests sharing one room (tax included). This article uses area-level medians (the level of a typical facility in that area).
- ADR (estimated settled rate for the model): An assumed value for the model, obtained by multiplying the median listed price by the ratio “estimated settled ADR ÷ listed price” observed across all facilities in the same prefecture (12-month average for 2025). Our estimated settled ADR is calculated only for validated categories (business, city, resort, ryokan, capsule); the hostel category has not been validated, so the ADR in this article is treated as an assumption rather than an estimate.
- GOP (gross operating profit): Revenue less departmental costs, selling, general and administrative expenses and similar items. The GOP margin in this article is an assumption, not an actual result.
- Mismatched populations: Occupancy is based on the “simple lodging business” licence category under the Inns and Hotels Act (JTA statistics), while prices are based on the booking-site facility categories “hostel” and “guesthouse”. The two populations do not match. The model in this article joins two public data series for reference and does not represent the results of a single set of facilities.
- Data sources: JTA Overnight Travel Statistics Survey; Ministry of Health, Labour and Welfare (MHLW) Report on Public Health Administration and Services; MetroEngines Research & Consulting (checked 17 September 2026)
- — Occupancy: 29.6% nationally, 73.6% in Osaka, 13.6% in Nagano. Measured for 2025 (JTA). The national average cannot support an investment decision.
- — Annual GOP per room ranges from ¥188k to ¥1.373M. Even with the same 45% GOP margin, location alone creates a 7.3-fold gap.
- — At ¥12M invested per room, yields run from 1.6% in Nagano to 11.4% in Tokyo. In practice, yields only stand up in major cities and core tourism cities.
- — Facility count up 70.4% in 10 years (26,349 → 44,901). Only simple lodgings kept growing while ryokan/hotel licences stayed flat. Supply is the biggest risk factor.
- — The current floor-area standard is 33 m² (3.3 m² × guests if capacity is under 10). A front desk is not among the Cabinet Order requirements for simple lodgings. An automatic fire alarm system, however, is mandatory regardless of total floor area.
Status Under the Inns and Hotels Act — Of Three Categories, Only the Floor-Area Rule Really Binds
Article 2 of the Inns and Hotels Act divides the lodging business into three categories: “ryokan/hotel business”, “simple lodging business” and “boarding-house business”. The amendment that took effect on 15 June 2018 merged the previously separate “hotel business” and “ryokan business” into a single “ryokan/hotel business” and abolished the minimum room counts (10 rooms for hotels, 5 for ryokan). At the same time, the maximum fine for unlicensed operation was raised from ¥30,000 to ¥1M. The simple lodging business has remained a separate category both before and after that amendment.
Article 2(4) of the Act defines a simple lodging business as “a business that provides lodging to guests for a fee in a facility whose structure and equipment mainly consist of lodging space shared by many people, other than a boarding-house business”. Dormitory-style hostels obviously qualify, but guesthouses made up entirely of private rooms and whole-house machiya rentals are also often licensed in this category.
The structural and equipment standards are in Article 1 of the Enforcement Order of the Inns and Hotels Act. The standards for the simple lodging business are currently in paragraph 2 of that Article (explanations citing “paragraph 3”, from the days when hotel, ryokan and simple lodging businesses were listed side by side under the old law, are still in circulation, but the paragraph numbers moved up when the categories were merged). The statutory requirements come down to the following seven items.
| Item | Requirement | Implication for investment decisions |
|---|---|---|
| 1 | Total guest-room floor area of at least 33 m². Where the licence application sets capacity below 10 guests, at least 3.3 m² × the number of guests | Plenty of room to go small. With a capacity of 6, even 19.8 m² meets the requirement |
| 2 | Where bunk beds are installed, a gap of roughly 1 m or more between the upper and lower bunks | Drives the ceiling height needed for bunk-bed layouts. Often a constraint when converting existing houses |
| 3 | Adequate ventilation, daylight, lighting, damp-proofing and drainage | Windowless storerooms and similar spaces cannot be used as guest rooms |
| 4 | Bathing facilities sized to meet guest demand, unless, for example, a public bath is nearby | Bathroom capex can be cut if a public bathhouse is close by (subject to consultation with the public health centre) |
| 5 | Washbasin facilities of a scale adequate for guest demand | Shared washbasins are acceptable |
| 6 | An adequate number of toilets | The actual number depends on prefectural ordinances and public health centre practice |
| 7 | Compliance with any other structural and equipment standards set by prefectural ordinance | The biggest variable in practice. Local ordinances add requirements on floor area, toilet counts and front-desk operation |
Source: Prepared by MetroEngines Research & Consulting from the Enforcement Order of the Inns and Hotels Act (Cabinet Order No. 152 of 1957), Article 1(2)
Two points stand out. First, a front desk (genkan choba) is not among the Cabinet Order requirements for the simple lodging business. It is the ryokan/hotel business that must have a front desk or equivalent under item 2 of paragraph 1 of the same Article (the 2018 amendment explicitly allowed ICT-based identity verification equipment as a substitute). Second, there is no minimum room count. So even a one-room facility for 4 guests meets the statutory floor-area requirement with guest-room floor area of 3.3 m² × 4 = 13.2 m² or more, rather than 33 m².
Item 7, however—additional requirements under prefectural ordinances—decides how things work in practice. Some local governments require a front desk or on-site staff by ordinance, others set a minimum floor area per guest room, so the same floor plan can pass in Tokyo and fail in Kyoto. Any pre-acquisition feasibility study should build prior consultation with the competent public health centre into the schedule.
Three Hurdles Beyond the Inns and Hotels Act — Fire Service Act, Building Standards Act, Zoning
Licensing does not end with the Inns and Hotels Act. Three further points matter for the investment decision.
| Area | Content | Legal basis | Impact on cost |
|---|---|---|---|
| Fire Service Act | Ryokan, hotels, lodging houses and similar (Appended Table 1, item (5)(a)) must install an automatic fire alarm system regardless of total floor area | Order for Enforcement of the Fire Service Act, Art. 21(1)(i)(a) | An up-front cost that arises even for small properties. Conversions of existing houses need additional work |
| Fire Service Act | Sprinklers are required for buildings with 11 or more storeys (excluding basements), or, for buildings other than single-storey ones, a total floor area of 6,000 m² or more | Order for Enforcement of the Fire Service Act, Art. 12(1)(iii) and (iv) | Small simple lodgings are generally exempt. A light burden here |
| Building Standards Act | When a change of use turns a building into a special building, a building confirmation application is required if the floor area used for that purpose exceeds 200 m² in total | Building Standards Act, Art. 6(1)(i) and Art. 87(1) | Why so many small simple lodgings are designed to stay within 200 m² |
| Building Standards Act | The use is classed as “hotel or ryokan”. It cannot be built in Category 1 and 2 low-rise residential zones, Category 1 mid/high-rise residential zones, rural residential zones, industrial zones or exclusively industrial zones | Building Standards Act, Art. 48 and Appended Table 2 | Vacant houses in residential neighbourhoods cannot always simply be converted |
Source: Prepared by MetroEngines Research & Consulting from the Order for Enforcement of the Fire Service Act and the Building Standards Act (e-Gov law search, checked 17 September 2026)
In short, up-front investment in a simple lodging swings less on “the cost of building rooms” than on three things: the automatic fire alarm system, escape routes and zoning. Whether you can pick a building that can be designed within 200 m² with a fire alarm system included is the entry point to feasibility in this segment.
Measured Occupancy — Behind the 29.6% National Figure: Osaka 73.6%, Nagano 13.6%
Now to the measured figures. The JTA Overnight Travel Statistics Survey publishes room occupancy by accommodation type (ryokan / resort hotel / business hotel / city hotel / simple lodging / company or group lodging). Room occupancy at simple lodgings for 2025 (full-year final figures) was 29.6% nationally, only a 0.6-point improvement on 29.0% in 2024. In the same year, business hotels ran at 75.3% and city hotels at 74.1%.
Source: Prepared by MetroEngines Research & Consulting from the JTA Overnight Travel Statistics Survey (2024 and 2025 full-year final figures; 2026 second preliminary figures)
Month by month, simple lodging occupancy jumps in August (39.1% in August 2025) and sinks in December–January (24.5% in December 2025, 25.1% in January 2025). The gap between the highest and lowest month of the year is 14.6 points, a completely different demand structure from business hotels, which move within a 72–81% range all year. Simple lodgings depend heavily on leisure and tourism demand, with little support from weekday business demand. Business plans therefore need to model funding on monthly cash flow, not on the annual average.
Monthly figures so far in 2026 are 25.3% in February, 23.9% in March, 24.6% in April, 29.4% in May and 26.1% in June, all below the same month a year earlier. However, from the January 2026 survey the JTA changed its sample stratification basis from “number of employees” to “number of guest rooms”, so year-on-year comparisons need care. The data do show that the level itself has not improved, but the size of the decline should not be treated as a confirmed drop in demand.
| Prefecture | Simple lodging | Ref.: business hotel | Simple lodging facilities (end of FY2024) | Gap vs national average |
|---|---|---|---|---|
| Osaka | 73.6% | 82.9% | 773 | +44.0pt |
| Kyoto | 52.0% | 77.4% | 3,647 | +22.4pt |
| Tokyo | 48.6% | 81.5% | 1,256 | +19.0pt |
| Fukuoka | 44.8% | 77.8% | 400 | +15.2pt |
| Aichi | 38.2% | 75.4% | 158 | +8.6pt |
| Okinawa | 34.7% | 77.2% | 3,804 | +5.1pt |
| Okayama | 33.8% | 74.9% | 412 | +4.2pt |
| Mie | 33.2% | 73.4% | 284 | +3.6pt |
| Miyagi | 31.0% | 69.5% | 335 | +1.4pt |
| Kagawa | 29.6% | 69.7% | 811 | +0.0pt |
| Tokushima | 28.5% | 66.4% | 313 | -1.1pt |
| Kagoshima | 26.5% | 68.9% | 1,626 | -3.1pt |
| National | 29.6% | 75.3% | 44,901 | — |
| Akita | 8.9% | 67.8% | 307 | -20.7pt |
| Saga | 9.6% | 73.9% | 194 | -20.0pt |
| Tottori | 10.0% | 68.5% | 448 | -19.6pt |
| Ehime | 10.3% | 68.4% | 532 | -19.3pt |
| Fukushima | 10.5% | 61.3% | 652 | -19.1pt |
Source: Prepared by MetroEngines Research & Consulting from the JTA Overnight Travel Statistics Survey (2025 full-year final figures) and the MHLW Report on Public Health Administration and Services (FY2024)
Source: Prepared by MetroEngines Research & Consulting from the JTA Overnight Travel Statistics Survey (2025 full-year final figures)
The top of the table runs Osaka 73.6%, Kyoto 52.0%, Tokyo 48.6% and Fukuoka 44.8%. Osaka’s 73.6% is only 9.3 points below its business hotels’ 82.9%, which shows that in this location simple lodgings are effectively functioning as a mainstream outlet for lodging demand. At the bottom, Akita is last at 8.9%, followed by Saga 9.6%, Tottori 10.0%, Ehime 10.3% and Fukushima 10.5%. Hyogo at 13.4% and Nagano at 13.6%, which this article uses in its model, sit close to that level. These are all regions where many pensions and minshuku guesthouses hold simple lodging licences, and operations that do not assume year-round opening pull the average down.
More Facilities, Lower Occupancy — An Inverse Relationship Across 44,901 Facilities
Source: Prepared by MetroEngines Research & Consulting from the JTA Overnight Travel Statistics Survey (2025 full-year final figures) and the MHLW Report on Public Health Administration and Services (FY2024)
Plotting the 47 prefectures as “number of simple lodgings” × “occupancy” shows the upper-right quadrant (many facilities and high occupancy) is almost empty. Nagano, with the most facilities (4,361), runs at 13.6%; Okinawa, second (3,804), at 34.7%; and Hokkaido, fourth (3,314), at 25.2%. The exception is Kyoto, third (3,647 facilities, 52.0%), the only market that fills up despite having many facilities.
Osaka, by contrast, has 773 facilities at 73.6%. The fewer simple lodging licences a city has, the more demand each facility captures. When choosing a target area, “how many simple lodgings are there in the area” works as a leading indicator of occupancy. How much the prefectural ranking reshuffles depending on whether these 44,901 facilities are divided by population, land area or existing room stock is examined in detail in Lodging Supply Denominator: 44,901 Simple Lodgings Move Kyoto 21st→5th.
Source: Prepared by MetroEngines Research & Consulting from the JTA Overnight Travel Statistics Survey (2025 full-year final figures) and the MHLW Report on Public Health Administration and Services (FY2024)
Price Levels — Median Listed Price in the Hostel Category: Osaka ¥18,770, Tokyo ¥30,307
Next, prices. From the listed prices on major booking sites that we collect, we aggregated the listed prices for the facility categories “hostel” and “guesthouse” (two guests per room, per room, tax included, all-plan average) by prefecture. All figures below cover the 12 months from September 2025 to August 2026: we took the monthly area median and then the median of those.
| Prefecture | Hostel median listed price | Facilities covered (monthly median) | Guesthouse median listed price | Facilities covered (monthly median) |
|---|---|---|---|---|
| Tokyo | ¥30,307 | 205 | ¥19,843 | 78 |
| Osaka | ¥18,770 | 78 | ¥15,738 | 51 |
| Kyoto | ¥22,404 | 192 | ¥18,146 | 119 |
| Fukuoka | ¥26,155 | 125 | ¥21,349 | 27 |
| Hokkaido | ¥24,440 | 106 | ¥14,841 | 100 |
| Okinawa | ¥13,994 | 262 | ¥12,569 | 123 |
| Hiroshima | ¥18,578 | 51 | ¥15,812 | 39 |
| Nagano | ¥18,598 | 26 | ¥16,032 | 67 |
Source: MetroEngines Research & Consulting (listed price = per-room rate for two guests sharing one room, tax included, all-plan average)
Source: MetroEngines Research & Consulting
Tokyo’s hostel category is high at ¥30,307 because it includes a substantial number of “whole-house rental” and “multi-bedroom for groups” listings. Read as a rate for two guests in one room it looks expensive, but inventory sold for 4–8 guests pushes the average up. Judging profitability from listed price levels alone is misleading—it only resolves once prices are multiplied by occupancy in the model in the next section.
Okinawa, conversely, is the lowest at ¥13,994. With 3,804 facilities, prices do not hold up, and combined with 34.7% occupancy, revenue per room sinks to near the bottom of the prefectures covered in this article. Hostel and guesthouse supply density also varies sharply between municipalities within the same prefecture, so these prefecture-level figures are best used as a first screen.
ROI in Three Steps — Annual GOP per Room of ¥188k to ¥1.373M
Using the measured figures so far, we build the investment return per room in three steps. Building acquisition prices vary too much by region and property to generalise, so this article leaves total investment as a variable and presents results as “what yield you get at a given total investment per room”.
■ Model Assumptions
- Occupancy: Prefecture-level room occupancy for simple lodgings from the JTA Overnight Travel Statistics Survey, 2025 full-year final figures, used as is (no adjustment).
- ADR: An assumed value obtained by multiplying the prefecture’s median hostel-category listed price (12 months, September 2025–August 2026) by the ratio “estimated settled ADR ÷ listed price” observed across all facilities in the same prefecture (average for January–December 2025: Tokyo 0.568 / Osaka 0.599 / Kyoto 0.496 / Fukuoka 0.481 / Okinawa 0.456 / Hokkaido 0.409 / Nagano 0.453 / Hiroshima 0.454), rounded to the nearest ¥100.
- GOP margin: 45% (assumption). Set between the 38.9% actual GOP margin disclosed by a listed REIT for its managed hotels (Invincible Investment Corporation, 91 properties, fiscal period ended December 2024) and the 50–60% industry rule of thumb for limited-service hotels, as a conservative value for small properties that, even when run unstaffed, outsource much of their cleaning.
- Operating days: 365 (open all year). Seasonal properties are out of scope.
- Total investment per room: Three levels shown: ¥8M / ¥12M / ¥16M. Assumed to cover acquisition, renovation, fire safety equipment, furniture, fixtures and equipment, and licensing costs. For reference, the MLIT Building Starts Statistics put the 2024 estimated construction cost of lodging-use buildings at an all-structure average of ¥1.95M per tsubo (1 tsubo = 3.3058 m²; RC ¥1.736M / steel ¥1.648M), which sets the floor for new builds.
- Not included in the model: interest on borrowings, depreciation, corporate and other taxes, major repair reserves, and pre-opening working capital. The “yield” in this article is therefore a simple GOP-based yield, neither an NOI yield nor an IRR.
- Mismatched populations: Occupancy is based on the “simple lodging business” category under the Inns and Hotels Act, prices on the booking-site “hostel” category. They are not the same set of facilities.
- Scope: Prefectures where the monthly median number of facilities with listed prices is below 25 were excluded as too thin a sample.
Step 1 — ADR × Occupancy × 365 Days Gives Annual Revenue per Room
Take Osaka as the example. The median listed price in the hostel category is ¥18,770. Multiplying by Osaka’s ratio of 0.599 gives a model ADR of ¥11,200. Occupancy is 73.6%.
¥11,200 × 365 days × 73.6% = ¥3,008,768 (annual revenue per room)
For a 10-room property that means annual revenue of ¥30,087,680; for 20 rooms, ¥60,175,360.
Step 2 — Apply the GOP Margin to Get Annual GOP per Room
¥3,008,768 × 45% GOP margin = ¥1,353,946 (annual GOP per room)
| Prefecture | Model ADR | Occupancy (JTA, 2025) | Annual revenue per room | Annual GOP per room |
|---|---|---|---|---|
| Tokyo | ¥17,200 | 48.6% | ¥3,051,108 | ¥1,372,999 |
| Osaka | ¥11,200 | 73.6% | ¥3,008,768 | ¥1,353,946 |
| Kyoto | ¥11,100 | 52.0% | ¥2,106,780 | ¥948,051 |
| Fukuoka | ¥12,600 | 44.8% | ¥2,060,352 | ¥927,158 |
| Hokkaido | ¥10,000 | 25.2% | ¥919,800 | ¥413,910 |
| Okinawa | ¥6,400 | 34.7% | ¥810,592 | ¥364,766 |
| Hiroshima | ¥8,400 | 19.1% | ¥585,606 | ¥263,523 |
| Nagano | ¥8,400 | 13.6% | ¥416,976 | ¥187,639 |
Source: JTA Overnight Travel Statistics Survey (2025 full-year final figures); MetroEngines Research & Consulting model (see “■ Model Assumptions”)
Source: MetroEngines Research & Consulting model
Annual GOP per room is ¥1,372,999 in Tokyo and ¥1,353,946 in Osaka, against ¥187,639 in Nagano. Even with the same 45% GOP margin, location alone opens a 7.3-fold gap. Tokyo has a high ADR with mid-range occupancy, while Osaka has a low ADR with exceptionally high occupancy—it is striking that they reach the same level of GOP by different routes.
Step 3 — Divide by Total Investment per Room to Get the Yield
¥1,353,946 ÷ total investment per room of ¥12M = 11.3% (Osaka, simple GOP-based yield)
| Prefecture | Annual GOP per room | ¥8M invested per room | ¥12M invested per room | ¥16M invested per room |
|---|---|---|---|---|
| Tokyo | ¥1,372,999 | 17.2% | 11.4% | 8.6% |
| Osaka | ¥1,353,946 | 16.9% | 11.3% | 8.5% |
| Kyoto | ¥948,051 | 11.9% | 7.9% | 5.9% |
| Fukuoka | ¥927,158 | 11.6% | 7.7% | 5.8% |
| Hokkaido | ¥413,910 | 5.2% | 3.4% | 2.6% |
| Okinawa | ¥364,766 | 4.6% | 3.0% | 2.3% |
| Hiroshima | ¥263,523 | 3.3% | 2.2% | 1.6% |
| Nagano | ¥187,639 | 2.3% | 1.6% | 1.2% |
Source: MetroEngines Research & Consulting model (see “■ Model Assumptions”; excludes interest, depreciation, taxes and repair reserves)
Here is how to read it. At ¥12M per room fully fitted out, only Tokyo (11.4%) and Osaka (11.3%) reach double-digit yields. Kyoto (7.9%) and Fukuoka (7.7%) follow, while Hokkaido (3.4%), Okinawa (3.0%), Hiroshima (2.2%) and Nagano (1.6%) stop at these levels even on a GOP basis. Once interest, depreciation, taxes and repair reserves are deducted, there is little room for the business to work in the lower-ranked prefectures.
Put the other way round, making an investment work in a lower-ranked prefecture requires at least one of the following: (1) keeping total investment per room at or below ¥8M, (2) running occupancy well above the prefectural average, or (3) pushing ADR above the average. Option (2) in particular is realistic for individual year-round, urban properties, given that the simple lodging occupancy statistic is an average that includes seasonal operations and pensions.
Sensitivity Analysis — Flexing the Osaka Model on Occupancy and GOP Margin
| Assumption | GOP margin 35% | GOP margin 45% | GOP margin 55% |
|---|---|---|---|
| Occupancy 50.0% (assumed, full year) | 6.0% ¥715,400 | 7.7% ¥919,800 | 9.4% ¥1,124,200 |
| Occupancy 60.0% (assumed, full year) | 7.2% ¥858,480 | 9.2% ¥1,103,760 | 11.2% ¥1,349,040 |
| Occupancy 73.6% (2025 full year, JTA measured) | 8.8% ¥1,053,069 | 11.3% ¥1,353,946 | 13.8% ¥1,654,822 |
Source: MetroEngines Research & Consulting model
If occupancy falls 13.6 points from Osaka’s 73.6% average in the JTA statistics to 60%, the yield in the 45% GOP margin case drops from 11.3% to 9.2%. Occupancy has more leverage than GOP margin. Filling rooms does more for returns than cutting costs through unstaffed check-in and self-cleaning—this is the order in which the operating model of a small simple lodging should be designed.
Risk Factors — A 70.4% Supply Increase in 10 Years Is the Biggest Variable
Source: Prepared by MetroEngines Research & Consulting from the MHLW Report on Public Health Administration and Services (as of each fiscal year-end)
According to the MHLW Report on Public Health Administration and Services, the number of simple lodging facilities rose from 26,349 at the end of FY2014 to 44,901 at the end of FY2024, an increase of 70.4% in 10 years. Even over the latest year it grew 7.1%, from 41,909 to 44,901. Over the same period, ryokan/hotel facilities grew only 7.0%, from 49,502 at the end of FY2018 to 52,946 at the end of FY2024 (figures up to FY2017 were compiled separately for “hotel business” and “ryokan business” and do not join up). Growth in lodging supply has piled up in the simple lodging licence category.
With occupancy stuck at 29.6% nationally while the facility count grows 7% a year, the natural reading is that the simple lodging market is loosening on a national-average basis. But as the previous section showed, the loosening is in regions with many facilities; in thinly supplied cities such as Osaka the situation is the reverse. Area selection matters more than any other variable within this segment.
| Category | Risk | What to check in advance |
|---|---|---|
| Regulation | Additional structural and equipment standards under prefectural ordinances (Enforcement Order Art. 1(2), item 7) | Prior consultation with the competent public health centre: how front desk, on-site staffing, toilet counts and room floor area are handled |
| Regulation | Location limits from zoning (cannot be built in low-rise exclusive residential zones, etc.) | Check the zoning on the city planning map. Vacant houses in residential areas may not be convertible |
| Equipment | Automatic fire alarm system mandatory regardless of total floor area | For existing buildings, wiring and control panel costs. Prospects of fire department consent |
| Equipment | Building confirmation application for change of use (over 200 m²) and remedying existing non-conformities | Whether an inspection certificate exists. If not, a legal compliance survey is required |
| Demand | Large seasonal swings (in 2025: 39.1% in August, 24.5% in December) | Funding planned on monthly cash flow. Resilience of fixed costs in the off-season |
| Supply | Facility count up 70.4% in 10 years (26,349 → 44,901 facilities) | Trend in simple lodging licences in the target area. The more facilities a region has, the lower its occupancy |
| Operations | Small scale gives little capacity to absorb fixed costs | Outsourced unit costs for cleaning and linen. Build-up of fixed cost per room |
| Exit | Low liquidity and a limited pool of buyers | Clarify whether the business licence can be succeeded (business transfer vs share transfer) when designing the acquisition scheme |
Source: Prepared by MetroEngines Research & Consulting from the Enforcement Order of the Inns and Hotels Act, the Order for Enforcement of the Fire Service Act, the Building Standards Act, the JTA Overnight Travel Statistics Survey and the MHLW Report on Public Health Administration and Services
Summary — Don’t Decide on Averages. This Segment Is Decided by Area
Judged only by the Inns and Hotels Act requirements, the simple lodging business has low barriers to entry: 33 m² of guest-room floor area (3.3 m² × guests if capacity is under 10), no minimum room count, and no front desk required by the Cabinet Order. The real hurdles in practice are additional prefectural ordinance requirements, the automatic fire alarm system, zoning, and the 200 m² threshold for a change-of-use confirmation application.
Profitability means nothing when discussed as a national average. Room occupancy in 2025 was 29.6% nationally, but 73.6% in Osaka and 13.6% in Nagano. Under this article’s model assumptions, annual GOP per room ranges 7.3-fold, from ¥188k to ¥1.373M. At ¥12M per room fully fitted out, only Tokyo and Osaka among the eight prefectures covered delivered double-digit GOP-based yields.
And the biggest variable is supply. The facility count is up 70.4% in 10 years and 7.1% in the latest year alone. The pattern of national occupancy flatlining while only the facility count grows continues. Put the other way round, being able to identify “municipalities with few simple lodging licences and deep lodging demand” is almost the whole of the investment decision in this segment. The prefecture-level data in this article should serve as material for that first screen.
Related Reading
References and Sources
■ Data sources
Room occupancy is from Table 8 of the JTA Overnight Travel Statistics Survey (full-year final figures for 2024 and 2025; preliminary figures for February–June 2026), simple lodging, business hotel and city hotel categories. Facility counts are from the MHLW Report on Public Health Administration and Services (as of each fiscal year-end, FY2014–FY2024). Prices are listed prices on major booking sites collected by MetroEngines Research & Consulting (hostel and guesthouse categories, monthly area medians for September 2025–August 2026). Legal requirements are from the current statutory text on e-Gov law search (checked 17 September 2026).
■ Model assumptions
Annual revenue per room = model ADR × 365 days × occupancy (2025, measured by prefecture). Model ADR is an assumed value: median listed price × the same prefecture’s estimated settled ADR / listed price ratio (2025 average), rounded to the nearest ¥100. 45% GOP margin, open all year, three levels of total investment per room: ¥8M / ¥12M / ¥16M. Yields are simple GOP-based yields (excluding interest, depreciation, taxes, repair reserves and pre-opening working capital). See “■ Model Assumptions” in the body for details.
■ Limitations and caveats
Occupancy (simple lodging business under the Inns and Hotels Act) and prices (hostel category on booking sites) come from different populations and are not the results of a single set of facilities. Prefectural average occupancy includes seasonal pensions and minshuku and may diverge from year-round urban properties. The JTA changed its sample stratification basis from the January 2026 survey, so year-on-year comparisons for 2026 should be read with a margin. GOP margin and investment amounts are assumptions; the economics of any individual property vary widely with location, scale, ordinances and operating model.
■ Laws and regulations (e-Gov law search, checked 17 September 2026)
- Inns and Hotels Act (Act No. 138 of 1948) Art. 2 (definitions), Art. 3 (business licence)
- Enforcement Order of the Inns and Hotels Act (Cabinet Order No. 152 of 1957) Art. 1(2) (structural and equipment standards for the simple lodging business)
- Order for Enforcement of the Fire Service Act (Cabinet Order No. 37 of 1961) Art. 12 (sprinkler systems), Art. 21 (automatic fire alarm systems), Appended Table 1, item (5)(a)
- Building Standards Act (Act No. 201 of 1950) Art. 6(1)(i), Art. 48, Art. 87(1), Appended Table 2
■ Government statistics
- JTA Overnight Travel Statistics Survey Table 8, room occupancy by accommodation type (6 types) (2024 and 2025 full-year final figures; February–June 2026 second preliminary figures)
- JTA Overnight Travel Statistics Survey (May 2026 second preliminary, June 2026 first preliminary)
- MHLW Report on Public Health Administration and Services Table 8, number of ryokan/hotel facilities and rooms, and number of simple lodging and boarding-house facilities (FY2014–FY2024)
- MLIT Building Starts Statistics Number, floor area and estimated construction cost of buildings by use (lodging)
■ Market data and industry materials
- MetroEngines Research & Consulting — listed prices on major booking sites (hostel and guesthouse categories, September 2025–August 2026) and the ratio of estimated settled ADR to listed price
- Invincible Investment Corporation portfolio (GOP results of managed hotels)
- MHLW, “To Those Starting a Minpaku Service: Guide to Obtaining a Simple Lodging Business Licence” (revised June 2018, in Japanese)