

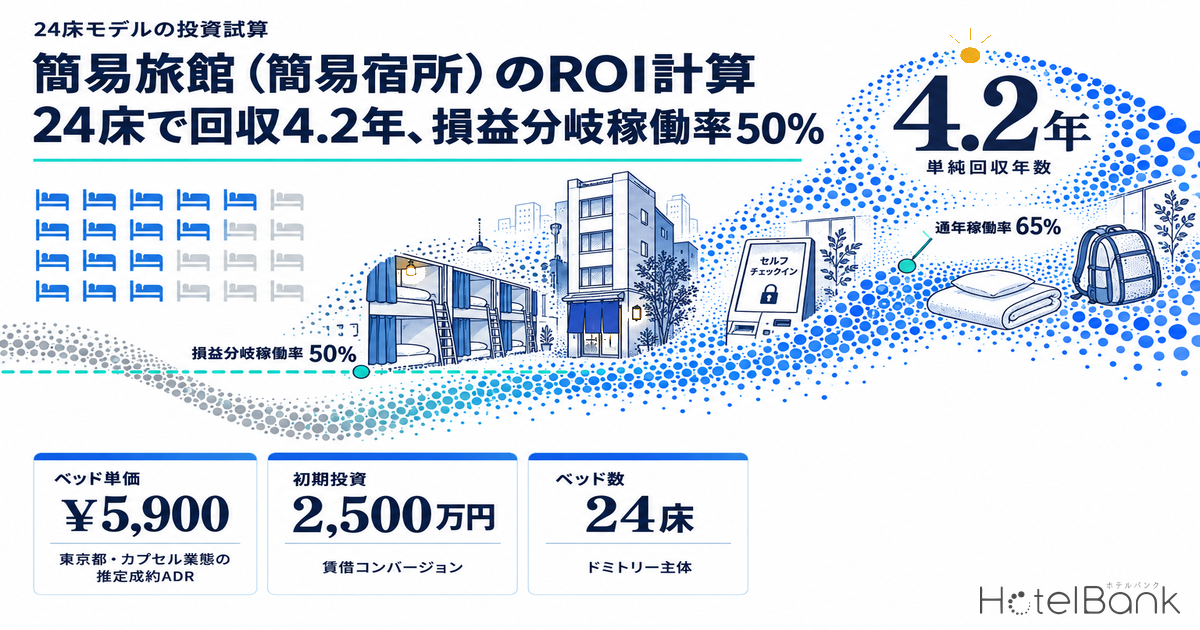
An investment decision on a simple lodging (a kan’i shukusho, the “simple lodging business” category under the Hotel Business Act) ultimately comes down to three numbers: how much one bed sells for, what share of the year it is filled, and how far the initial investment can be held down. This article combines measured estimated settled ADR for the capsule-hotel format, compiled by MetroEngines Research & Consulting, with public statistics from the Ministry of Health, Labour and Welfare and the Japan Tourism Agency, and builds an ROI calculation for a 24-bed model with every assumption stated. To give the conclusion first: break-even occupancy is about 50%, and clearing it by 10 points brings payback into the four-year range.
Metric Definitions Used in This Article
- ADR (average daily rate): estimated settled rate (tax-exclusive equivalent), calculated by applying a format-specific correction coefficient to the cheapest-plan level each property publishes on OTAs and other channels (two guests per room, per-room price, tax included). Checked against property-level results disclosed by listed hotel REITs (91 properties, latest three months), the median error is about 7%. These are estimates and differ from each property’s actual settled prices and accounting figures. Area-level ADR is the median of the properties covered (the level of a typical property in the area).
- OCC (occupancy): the occupancy rates quoted in this article are the room occupancy rates by property type published in the Japan Tourism Agency’s Overnight Travel Statistics Survey. The occupancy used in the calculations is an assumption, not an actual result.
- Bed rate: the capsule-hotel format sells by the unit (one pod, one guest), so this article treats the format’s estimated settled ADR as equivalent to the rate level per bed.
- Data sources: MetroEngines Research & Consulting / Ministry of Health, Labour and Welfare, Report on Public Health Administration and Services / Japan Tourism Agency, Overnight Travel Statistics Survey
- — Break-even is 49.9% year-round occupancy. On the assumptions of 24 beds, a ¥5,900 bed rate and ¥19.7M in fixed costs, occupancy below this level means an operating loss.
- — 4.2-year payback. At 65% year-round occupancy, operating profit is ¥5.98M with a 17.8% margin, enough for simple payback of the ¥25M initial investment.
- — 10 points of occupancy moves payback threefold. It is 12.3 years at 55% and 2.5 years at 75%: a business structure with extremely high operating leverage.
- — Bed rates differ 1.8x by location. Estimated settled ADR for the capsule format is ¥5,900 in Tokyo against ¥3,200 in Hiroshima (March–August 2026 average).
- — Whether you can operate year-round decides the choice of regime. Replacing the operating days with 180 on the same assumptions gives revenue of ¥16.57M, which cannot cover ¥19.7M of fixed costs.
The revenue model is beds × ADR × occupancy — start by pinning down the real rate
In practice, an ROI calculation for a simple lodging is built per bed rather than per hotel room. Dormitory-led properties put several beds in one room and sell by the guest. Annual revenue is “beds × bed rate × occupancy × 365 days”, and of these the bed rate is the easiest to misjudge.
The problem is that OTA listed prices for properties registered as hostels or guesthouses mix whole-building plans and private-room plans, so a straight average departs sharply from the real per-bed level. This article therefore uses the capsule-hotel format as the rate benchmark for simple-lodging-type properties: it sells strictly by the pod and by the guest, and its estimated settled ADR has been validated.
On a six-month average for March–August 2026, estimated settled ADR is ¥5,900 in Tokyo, followed by ¥5,600 in Fukuoka and ¥5,300 in Hokkaido. Hiroshima, the lowest of the nine prefectures in the table, is at ¥3,200, a gap of 1.8x to the top. Even within the same format, the income one bed generates differs this much by location.
| Prefecture | Estimated settled ADR (6-month average) | Properties covered | Listed price (all-plan average, 2 guests per room, tax incl.) |
|---|---|---|---|
| Tokyo | ¥5,900 | 38–39 properties | ¥13,300 |
| Fukuoka | ¥5,600 | 6 properties | ¥16,700 |
| Hokkaido | ¥5,300 | 4–7 properties | ¥15,800 |
| Aichi | ¥5,000 | 4 properties | ¥16,900 |
| Kyoto | ¥4,800 | 5 properties | ¥16,700 |
| Kanagawa | ¥4,500 | 6 properties | ¥11,800 |
| Osaka | ¥4,200 | 10 properties | ¥14,100 |
| Okinawa | ¥3,800 | 3 properties | ¥12,200 |
| Hiroshima | ¥3,200 | 3 properties | ¥7,200 |
The listed price in the right-hand column is a tax-inclusive per-room price for two guests, on a different basis from the estimated settled ADR on the left. The two should not be compared directly, but the structure is visible: somewhat under half of the listed price ends up as the settled level per guest per night. The rate in a business plan should be based on the settled level, not the listed price.
Rates move 20% by month — do not build the plan on an annual average alone
Another point business plans tend to underweight is the month-to-month swing. Estimated settled ADR for the capsule format in Tokyo ranged from ¥5,100 to ¥7,200 across the 10 of the last 12 months for which observations were available, a 42% gap between the cheapest and most expensive month. Osaka ranged from ¥3,800 to ¥5,700 (a 53% gap), swinging even more than Tokyo.
Planning cash flow on the annual average rate alone leaves working capital short in the off-peak months. Build a monthly cash-flow table and check that fixed costs are covered even in the month when rate and occupancy fall furthest.
Don’t use the 2025 national average occupancy of 29.6% as is — Osaka is at 73.6%
Occupancy is what moves an ROI calculation most. The starting point here is room occupancy by property type from the Japan Tourism Agency’s Overnight Travel Statistics Survey. In the finalized 2025 figures, simple lodgings were at 29.6% against 61.6% overall. That is less than half of business hotels (75.3%) and city hotels (74.1%), and the lowest of the five hotel/ryokan types (company and group lodgings, outside that grouping, were at 24.2%).
Putting this 29.6% straight into a business plan is not appropriate, however. In the same statistics, simple lodgings in Osaka were at 73.6%, 2.5 times the national average. The national average reads low because the base includes many seasonal properties that do not assume year-round operation, and properties run more like holiday homes or company retreats. The simple lodging business category bundles everything from urban bed-selling properties to seasonal properties in the mountains, so its average does not work well as a reference value for a business plan.
In practice, it is more realistic to set your own assumption by looking at two things: business-hotel occupancy in the target catchment, and how many simple lodgings already exist there.
Supply is 44,901 properties, +7.1% year on year — and thinner in the big cities
According to the Ministry of Health, Labour and Welfare’s Report on Public Health Administration and Services, there were 44,901 simple lodging businesses nationwide at the end of FY2024, up 2,992 (+7.1%) from 41,909 a year earlier. With 52,946 ryokan/hotel businesses at the same point, simple lodgings account for about 46% of Japan’s lodging facilities by count. That is about 1.9 times the 23,050 of FY2008, sixteen years earlier.
The distribution runs against intuition. Nagano has the most, 4,361, followed by Okinawa (3,804), Kyoto (3,647) and Hokkaido (3,314). Tokyo, by contrast, has 1,256, and Osaka only 773. The two big metropolitan areas, where lodging demand is deepest, are if anything thin in simple lodging supply. Osaka’s standout 73.6% simple lodging occupancy can be read as a sign of that supply-demand gap. How the prefectural ranking reshuffles when the same 44,901 are set alongside ryokan/hotel businesses and private lodging businesses is examined in detail in Lodging Supply Denominator: 44,901 Simple Lodgings Move Kyoto 21st→5th.
| Prefecture | Simple lodging businesses (end of FY2024) | End of FY2023 | Change | Ryokan/hotel businesses |
|---|---|---|---|---|
| Nagano | 4,361 | 4,231 | +130 | 2,656 |
| Okinawa | 3,804 | 3,799 | +5 | 3,799 |
| Kyoto | 3,647 | 3,452 | +195 | 955 |
| Hokkaido | 3,314 | 3,029 | +285 | 2,930 |
| Yamanashi | 2,080 | 1,865 | +215 | 1,325 |
| Shizuoka | 2,016 | 1,793 | +223 | 2,535 |
| Kagoshima | 1,626 | 1,479 | +147 | 847 |
| Chiba | 1,533 | 1,355 | +178 | 1,232 |
| Nagasaki | 1,425 | 1,327 | +98 | 639 |
| Tokyo | 1,256 | 1,217 | +39 | 5,858 |
| Osaka (reference) | 773 | 747 | +26 | 1,646 |
Initial investment by item — a 24-bed leased conversion model
Now to the ROI calculation itself. As the premise, we take a model that leases an existing office building (about 200 m² of floor area) and converts it into a simple lodging with 24 beds. We assume a leased refurbishment rather than a new build because that is the entry route most often seen in the simple lodging market. What follows is a calculation on stated assumptions; actual amounts vary widely with property conditions, region and construction timing.
| Item | Amount (¥M) | Details |
|---|---|---|
| Lease up-front payments | 5.0 | 10 months of a ¥500k monthly rent (deposit, key money, brokerage fee) |
| Interior and equipment works | 15.0 | Bed fit-out, added shower rooms and toilets, shared lounge, layout changes |
| Fire safety equipment | 0.6 | Automatic fire alarm system, exit lights, extinguishers, flame-retardant items |
| Design, permits and professional fees | 1.0 | Design supervision, change-of-use and Hotel Business Act permit application support |
| Furniture, fixtures and systems | 2.4 | Bedding, linen, self check-in kiosk, smart locks, reservation management |
| Pre-opening working capital and advertising | 1.0 | Pre-opening rent, hiring, photography and initial marketing |
| Total | 25.0 | About ¥1.04M per bed |
The two items most likely to swing in this breakdown are interior and equipment works and fire safety equipment. Depending on whether a change of use is required, the structure and number of floors of the existing building, and whether sprinklers are mandatory, construction costs can move by close to double. In particular, whether total floor area is under 300 m² decides whether the automatic fire alarm system can be replaced with a simpler system for specified small-scale facilities, so the standard practice is to consult the local fire department and public health center before choosing the property.
Note also that the national hygiene management guidelines were revised in March 2016 so that a front desk (genkan chōba) at a simple lodging became something “desirable” rather than required, allowing a property to go without one on condition that it provides alternative equipment and an emergency response system (the requirement of fewer than 10 guests originally attached was removed in December 2017). This bears directly on labor costs, so check the local authority’s practice at the planning stage. The standard for total guest-room floor area is 33 m² or more, or, where guests are limited to fewer than 10, at least “3.3 m² × number of guests”.
Annual P&L model — 17.8% operating margin, 4.2-year payback
Operating costs are split into fixed and variable. Fixed costs, such as rent, labor and utilities, arise regardless of occupancy. Variable costs are the incremental linen, amenity and cleaning costs, plus sales commissions to OTAs and other channels.
| Category | Item | Amount (¥M/year) |
|---|---|---|
| Revenue | 24 beds × ¥5,900 × 65% year-round occupancy × 365 days | 33.59 |
| Total bed-nights: 5,694 | — | |
| Fixed costs | Rent | 6.00 |
| Fixed costs | Labor | 8.00 |
| Fixed costs | Utilities | 2.50 |
| Fixed costs | Other fixed costs (maintenance, insurance, telecoms, management) | 3.20 |
| Fixed costs | Fixed costs subtotal | 19.70 |
| Variable costs | Linen, amenities and incremental cleaning (¥800/night) | 4.56 |
| Variable costs | Sales commission (10% of revenue) | 3.36 |
| Variable costs | Variable costs subtotal | 7.92 |
| Operating profit | Revenue − fixed costs − variable costs | 5.98 |
| Operating margin | 17.8% | |
| Simple payback period | Initial investment ¥25M ÷ operating profit ¥5.98M | 4.2 years |
The formula is simple. Annual operating profit = beds × 365 × occupancy × (bed rate − variable cost per night − rate × commission rate) − annual fixed costs. The simple payback period is the initial investment divided by that figure. Depreciation, interest and corporate tax are not included, so the actual cash in hand will be smaller. For a plan submitted to a lender, debt service capacity needs to be judged on this operating profit after interest and tax.
Sensitivity — break-even at 49.9% year-round occupancy, and a 10-point gap moves payback threefold
What matters most in this calculation is not any single number but the sensitivity. At a ¥5,900 bed rate, the year-round occupancy needed to cover ¥19.7M of fixed costs is 49.9%. Below that level, the business makes an operating loss.
A point estimate alone does not show the range of outcomes, so we set three cases that move rate and occupancy together. All share this article’s assumptions of a ¥25M initial investment, ¥19.7M in fixed costs, and variable costs of ¥800/night plus a 10% sales commission; only two variables, the bed rate and year-round occupancy, are moved.
| Item | Pessimistic | Middle | Optimistic |
|---|---|---|---|
| Bed rate | ¥5,300 | ¥5,900 | ¥6,500 |
| Year-round occupancy | 55% | 65% | 75% |
| Total bed-nights (per year) | 4,818 | 5,694 | 6,570 |
| Revenue (¥M/year) | 25.54 | 33.59 | 42.71 |
| Variable costs (¥M/year) | 6.41 | 7.92 | 9.53 |
| Fixed costs (¥M/year) | 19.70 | 19.70 | 19.70 |
| Operating profit (¥M/year) | −0.57 | 5.98 | 13.48 |
| Operating margin | −2.2% | 17.8% | 31.6% |
| Simple payback period | Not recoverable | 4.2 years | 1.9 years |
In the pessimistic case, cutting the rate by just over 10% and occupancy by 10 points is enough to turn the operating line into a loss. In the optimistic case the operating margin rises to 31.6% and payback falls below two years. The point of this calculation is how much the business changes shape with the combination of rate and occupancy, even with the same 24 beds and the same initial investment.
Laying out the simple payback period with occupancy across and bed rate down makes the outline of the business clear.
| Bed rate \ occupancy | 45% | 55% | 65% | 75% | 85% |
|---|---|---|---|---|---|
| ¥4,500 | Operating loss | Operating loss | Operating loss | 15.1 years | 5.6 years |
| ¥5,300 | Operating loss | Operating loss | 8.6 years | 3.9 years | 2.5 years |
| ¥5,900 | Operating loss | 12.3 years | 4.2 years | 2.5 years | 1.8 years |
| ¥6,500 | 20+ years | 5.4 years | 2.8 years | 1.9 years | 1.4 years |
| ¥7,300 | 8.2 years | 3.1 years | 1.9 years | 1.4 years | 1.1 years |
Three things stand out. First, there is a large fault line between 55% and 65% year-round occupancy. At a ¥5,900 rate, payback goes from 12.3 years to 4.2 years: 10 points cut the payback period to a third. This is a business with extremely high operating leverage, and whether the absolute level of fixed costs can be kept down decides success or failure.
Second, the rate also works non-linearly. At 65% year-round occupancy, raising the rate 11% from ¥5,300 to ¥5,900 halves payback from 8.6 years to 4.2 years. Almost everything above fixed costs becomes profit, so pricing skill feeds straight through to profit.
Third, in the ¥4,500 rate band, payback takes 15 years even at 75% year-round occupancy. A strategy of filling beds at a low rate is hard to make work at this level of initial investment. In a location where the rate cannot be raised, the ¥25M initial-investment assumption itself needs rethinking, or the design needs more beds to spread fixed costs.
All of these are calculations on stated assumptions and do not guarantee any particular yield or payback period. A detailed property-by-property feasibility study is essential for an actual investment decision.
The regulatory gap with minpaku (private lodging business) — whether you can operate year-round decides the revenue structure
When considering an investment in a small lodging property, whether to start as a simple lodging or as a private lodging business (minpaku under the so-called New Minpaku Act) always comes up. The biggest difference between the two is the cap on operating days. The permit categories under the Hotel Business Act and its 2018 and 2023 amendments form the background to this choice.
| Item | Simple lodging business (Hotel Business Act) | Private lodging business (Private Lodging Business Act) |
|---|---|---|
| Procedure | Permit from the prefectural governor or equivalent | Notification to the prefectural governor or equivalent |
| Annual operating days | No cap (year-round operation possible) | Capped at 180 days a year (counted from April 1 to March 31 each year) |
| Room floor-area standard | Total guest-room floor area of 33 m² or more; with fewer than 10 guests, at least 3.3 m² × number of guests | At least 3.3 m² per guest |
| Front desk (genkan chōba) | Relaxed to “desirable” by the March 2016 revision of the notice; not required under conditions | Not required (premised on entrusting management to a management company, etc.) |
| Number nationwide | 44,901 properties (end of FY2024, licensed properties) | 65,837 notifications cumulative, 42,070 active (notifications as of July 15, 2026) |
| Implication for revenue design | Investment payback can be designed on full 365-day operation | Operating days are limited to under half, so payback is longer for the same investment |
This difference feeds straight into the ROI calculation. Keeping all of this article’s 24-bed assumptions and replacing only the available operating days, from 365 to 180, halves annual bed-nights from 5,694 to 2,808. Revenue falls to ¥16.57M, below the ¥19.7M of fixed costs, so at this fixed-cost level the business does not work at the operating line. Minpaku is a regime designed around small-scale operation that can cut rent and labor costs sharply, and its design philosophy differs from a dedicated-property investment model like the one in this article.
The trend in notifications also bears out this regulatory gap. Against 65,837 cumulative private lodging notifications, 42,070 are active excluding closures (as of July 15, 2026), meaning about 36% of the cumulative total have already ceased operating. Simple lodging businesses, meanwhile, keep growing on a net basis, from 41,909 at the end of FY2023 to 44,901 at the end of FY2024. It is reasonable to read this as operators moving to the regime that allows year-round operation.
Five points to check before an investment decision
| Check item | What to look at |
|---|---|
| Occupancy track record in the catchment | Set the assumption from business-hotel occupancy and the density of simple lodgings in the catchment, not from the 29.6% national average. Assumptions differ between a catchment like Osaka, with few properties and high occupancy, and one like Nagano, with many properties |
| The real bed rate | Base it on the settled level, not the listed price. Check monthly what the same format actually sells for in the same catchment, and verify that fixed costs are covered even in the cheapest month |
| Absolute level of fixed costs | Operating leverage is high, so rent and labor levels decide the payback period. A design that makes use of the relaxed front-desk requirement can hold labor costs down |
| Fire safety and building requirements | Construction costs can move by close to double with total floor area, number of floors and whether a change of use is required. Consult the local fire department and public health center before signing for a property |
| Choice of regime | If payback is designed on year-round operation, the simple lodging business. The fixed-cost level it can bear is fundamentally different from the private lodging business, capped at 180 days a year |
Summary
The ROI of a simple lodging (simple lodging business) can be expressed by the plain formula beds × rate × occupancy. In practice, though, the hard part is not the formula but how the assumptions fed into it are set. Use the 2025 national average occupancy of 29.6% as is, and almost no plan works. Assume Osaka’s 73.6%, on the other hand, and any plan works.
In this article’s 24-bed model, break-even year-round occupancy came out at 49.9%, and payback at 4.2 years with 65% year-round occupancy and a ¥5,900 bed rate. If occupancy comes in 10 points lower, payback moves to 12.3 years; 10 points higher, to 2.5 years. This range is the essential character of simple lodging investment. It comes down to three things: hold fixed costs down, choose the catchment, and protect the rate.
On the supply side, the simple lodging business keeps expanding, +7.1% year on year in FY2024, and there is still room for the market to grow. On the other hand, the more properties grow, the more average occupancy tends to be diluted. For anyone considering entry, the starting point is to build assumptions on the real supply and demand in your own catchment, pinned down in numbers, rather than on national averages.
⚠ Note on the calculations: The ROI calculations in this article are simplified calculations based on the stated assumptions (24 beds, a ¥25M initial investment, ¥19.7M in fixed costs, variable costs of ¥800/night plus a 10% sales commission) and do not guarantee any particular yield or payback period. Depreciation, interest and corporate tax are not included. An actual investment decision requires a detailed property-by-property feasibility study. Estimated settled ADR is an estimate and differs from each property’s actual settled prices and accounting figures.
Related Articles
References and Sources
■ Data sources
The bed-rate benchmark is estimated settled ADR for the capsule-hotel format, which sells by the pod and by the guest (compiled by MetroEngines Research & Consulting; six-month average for March–August 2026; 3–39 properties per prefecture). Room occupancy by property type is from the Japan Tourism Agency’s Overnight Travel Statistics Survey, 2025 annual figures (finalized). Property counts are from the Ministry of Health, Labour and Welfare’s Report on Public Health Administration and Services (as of end of FY2024). Private lodging notification counts refer to Japan Tourism Agency releases (as of July 15, 2026).
■ Calculation assumptions
A 24-bed model that leases and converts an existing building. Initial investment ¥25M (up-front lease payments 5.0 / interior and equipment 15.0 / fire safety equipment 0.6 / design and permits 1.0 / furniture and fixtures 2.4 / pre-opening working capital 1.0; unit = ¥M), annual fixed costs ¥19.7M (rent 6.0 / labor 8.0 / utilities 2.5 / other 3.2), variable costs of ¥800/night for linen, cleaning and the like plus a 10% sales commission. The middle case is a ¥5,900 bed rate and 65% year-round occupancy. Annual operating profit = beds × 365 × occupancy × (bed rate − variable cost per night − rate × commission rate) − annual fixed costs; simple payback period = initial investment ÷ annual operating profit.
■ Limitations and caveats
The calculations in this article are simplified calculations on stated assumptions and do not guarantee any particular yield or payback period. Depreciation, interest and corporate tax are not included, so the actual cash in hand will be smaller. Estimated settled ADR is an estimate and differs from each property’s actual settled prices and accounting figures (median error of about 7% against property-level disclosures by listed hotel REITs). The occupancy used in the calculations is an assumption, not an actual result. Construction costs vary widely with the existing building’s structure, number of floors, whether a change of use is required, and whether sprinklers are mandatory.
■ Market data
- MetroEngines Research & Consulting — estimated settled ADR for the capsule-hotel format (September 2025–August 2026; properties covered are given in the text and charts), listed prices by category
■ Government statistics and public data
- Ministry of Health, Labour and Welfare, “FY2024 (Reiwa 6) Report on Public Health Administration and Services”, Table 8 (number of ryokan/hotel businesses and rooms, and of simple lodging and boarding-house businesses) (in Japanese)
- e-Stat, “Report on Public Health Administration and Services” annual reports (FY2023 and FY2021, appended table F01-2, lodging businesses by year) (in Japanese)
- Japan Tourism Agency, “Overnight Travel Statistics Survey”, 2025 annual figures (finalized) (in Japanese)
- Japan Tourism Agency minpaku portal, “What is the Private Lodging Business Act (New Minpaku Act)?” (in Japanese)
- Ministry of Health, Labour and Welfare, Health and Public Hygiene Bureau, “On the regulation of front desks etc. for the simple lodging business under the Hotel Business Act” (material submitted to the Council for Promotion of Regulatory Reform) (in Japanese)
■ News and commentary
- Travel Voice, “2025 guest-nights: foreign +8%, Japanese −4%; Osaka tops prefectural room occupancy at 79% — Overnight Travel Statistics (preliminary)” (March 2, 2026) (in Japanese)
- Minpaku Research Institute, “Minpaku notification counts ranked by prefecture — Japan Tourism Agency data summary” (2026) (in Japanese)