

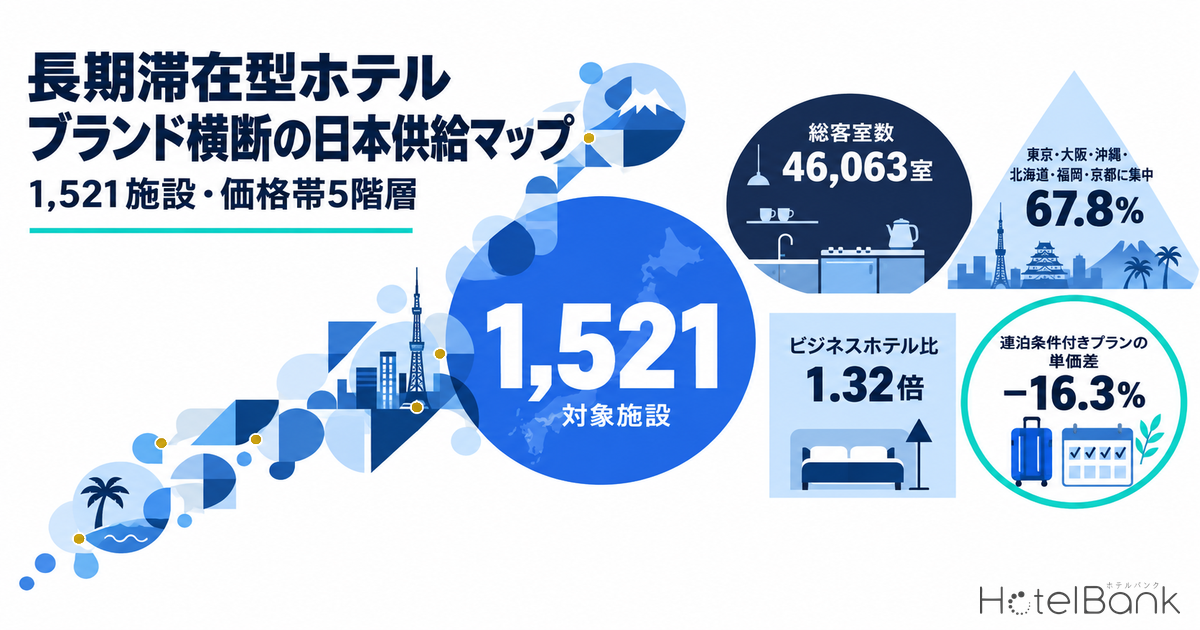
Long-stay hotels in Japan are usually discussed brand by brand, but what investment and development decisions actually need is a picture of supply: where the rooms are, how many there are, and what they sell for. This article cuts across brands and counts two groups of properties: those that list rooms with a kitchen (including kitchenettes and simple cooking facilities), and those that call themselves apartment hotels, condominiums or monthly/weekly stays. Within the scope tracked by MetroEngines Research, 1,521 properties with 46,063 rooms in total span all 47 prefectures. We read their locations, price tiers, price gap against business hotels in the same municipality, and future supply through macro aggregates of area × price tier × property size.
Metric Definitions Used in This Article
- Long-stay properties (the population in this article): Among properties listed on major booking sites whose listing was confirmed as updated on or after August 27, 2026, those that (1) have at least one room type whose name includes terms such as “kitchen”, “mini-kitchen”, “kitchenette”, “self-catering”, “apartment” or “condominium”, or (2) include a format name such as apartment, condominium, serviced apartment, monthly or weekly in the property name. Rooms with only a shared kitchen, whole-house rentals (vacation homes, cottages, machiya townhouses), ryokan, minshuku, pensions and adults-only properties were excluded. This is not a census; it covers the properties listed on major booking sites that MetroEngines Research tracks.
- Total rooms: The total room count of each property. Because the number of kitchen-equipped rooms alone cannot be isolated from public information, counts are summed at the property level. As some large hotels have mini-kitchens in only some room types, the actual number of long-stay-spec rooms is lower than this figure.
- Listed price (lowest-plan level): The monthly value at the level of the cheapest plan published by each property, per room for two guests (tax included). The median over the 12 months from September 2025 to August 2026 is used as the property’s price. This is not an estimated settled ADR.
- Ratio to business hotels: A property’s listed price divided by the median listed price of business hotels in the same municipality (where prices were available for at least 5 business hotels). Business hotels used for comparison: N=7,852 properties.
- Nightly rate of minimum-stay plans: The per-night listed price of plans whose names state a minimum stay such as “7+ nights”, “weekly”, “monthly” or “30 nights”. Compared with the cheapest standard plan (no minimum-stay or advance-purchase condition) for the same property, same room and same stay date.
- Data sources: MetroEngines Research (listed prices and listing information), HotelBank Editorial Team (guest review aggregation)
- — 1,521 properties with 46,063 rooms are spread across all 47 prefectures, but 67.8% of rooms are concentrated in six: Tokyo, Osaka, Okinawa, Hokkaido, Fukuoka and Kyoto.
- — 52.1% of properties have 9 rooms or fewer, while 51.6% of rooms sit in properties with 100+ rooms — a two-tier structure of small apartments and large hotels with kitchen-equipped rooms.
- — 61.2% of rooms are listed at ¥10,000–¥25,000 per night, and only 4.5% at ¥50,000 or more. The median price ratio against business hotels in the same municipality is 1.32x.
- — 162 properties offer plans requiring a stay of 7+ nights, with a median nightly rate 16.3% below the standard plan for the same room on the same date (N=131 properties). The discount depth is almost the same at 7, 14 and 30 nights.
- — Viable markets fall into four types: business districts, tourism/inbound hubs, resort stays and business-hotel-adjacent. Openings peaked at 156 properties in 2020; 2025 saw 78, and 2026 reached 58 properties with 1,950 rooms as of September, with larger properties on average.
What Counts as “Long-Stay” — Two Routes: In-Room Living Functions and Format Names
Long-stay hotels have neither a distinct business category under Japan’s Hotel Business Act nor a dedicated category on booking sites. This article therefore defines the population around the factor that matters most for long stays: in-room cooking facilities. We picked up properties with at least one room type whose name, as listed on booking sites, includes terms such as “kitchen”, “mini-kitchen”, “kitchenette”, “apartment” or “condominium”, and added properties whose name itself includes a long-stay format (apartment hotel, condominium, serviced apartment, monthly, weekly).
The room-name route yields 1,444 properties and the format-name route adds 77 more, for a total of 1,521. Whole-house rentals such as vacation homes, cottages and machiya townhouses, as well as ryokan, minshuku and pensions, were excluded even when they have kitchens, because their demand structure differs. Serviced apartments that operate only on monthly contracts and do not release inventory to booking sites are not included. The figures below therefore describe the supply of long-stay accommodation bookable by the night, not a full census.
| Selection route | Properties | Total rooms | Main types |
|---|---|---|---|
| Has a room type whose name includes kitchen or similar | 1,444 | — | Apartment hotels, limited-service and city hotels with mini-kitchen rooms, condominium-style resorts |
| Property name includes a long-stay format (not covered above) | 77 | — | Weekly/monthly hotels, condominium-style properties, serviced apartments |
| Total | 1,521 | 46,063 rooms | Sum for the 1,494 properties with known room counts |
Source: Compiled by HotelBank Editorial Team from MetroEngines Research data (properties with listing updates confirmed on or after August 27, 2026; total rooms = all rooms in the property)
The population includes properties of brands such as MIMARU, Minn, WAYPOINT, Oakwood, Citadines, Hyatt House, Fraser, Tabino Hotel (たびのホテル) and Tokyu Stay (listed as examples, not in order of size). Because each brand counts its properties differently, this article does not aggregate by brand and sticks to macro aggregates by area, price tier and property size.
Distribution by Prefecture — Present in All 47, with 67.8% of Rooms in Six
The 1,521 properties exist in all 47 prefectures. By room count, however, the skew is large: Tokyo has 10,301 rooms (22.4%), followed by Osaka with 6,488 (14.1%), Okinawa with 5,189 (11.3%) and Hokkaido with 4,270 (9.3%). Adding Fukuoka and Kyoto, six prefectures account for 67.8% of the total. Supply rides on two kinds of demand: business and inbound demand in cities, and stay-oriented demand in resorts.
Circle size = total rooms; circle shade = number of properties. Shows the top 60 municipalities by total rooms.
Source: Compiled by HotelBank Editorial Team from MetroEngines Research data
Total rooms and properties by prefecture (top 15)
Source: Compiled by HotelBank Editorial Team from MetroEngines Research data (N=1,521 properties)
| Prefecture | Properties | Total rooms | Room share | Median listed price | Median of business hotels in prefecture | Price ratio |
|---|---|---|---|---|---|---|
| Tokyo | 322 | 10,301 | 22.4% | ¥21,100 | ¥14,500 | 1.45x |
| Osaka | 114 | 6,488 | 14.1% | ¥12,800 | ¥9,900 | 1.30x |
| Okinawa | 200 | 5,189 | 11.3% | ¥14,100 | ¥9,800 | 1.43x |
| Hokkaido | 143 | 4,270 | 9.3% | ¥17,900 | ¥11,700 | 1.53x |
| Fukuoka | 110 | 2,495 | 5.4% | ¥14,900 | ¥12,200 | 1.22x |
| Kyoto | 116 | 2,479 | 5.4% | ¥17,300 | ¥12,600 | 1.37x |
| Kanagawa | 39 | 1,782 | 3.9% | ¥18,000 | ¥11,300 | 1.58x |
| Shizuoka | 30 | 1,236 | 2.7% | ¥14,100 | ¥9,200 | 1.53x |
| Ishikawa | 24 | 1,185 | 2.6% | ¥16,200 | ¥9,600 | 1.68x |
| Nagano | 39 | 977 | 2.1% | ¥26,300 | ¥11,800 | 2.23x |
Source: Compiled by HotelBank Editorial Team from MetroEngines Research data (listed price = lowest-plan level per room for 2 guests, tax included; property-level median for September 2025–August 2026. Business hotels = median of in-prefecture properties aggregated on the same basis)
By property count Okinawa (200) exceeds Osaka (114), yet by room count the order flips. Okinawa has many condominium-style properties with few rooms each, while in Osaka many hotels with 100+ rooms incorporate mini-kitchen rooms. Nagano stands out with a price ratio of 2.23x, showing that condominium-style properties in mountain resorts such as Hakuba and Nozawa operate in a price band entirely separate from the prefecture’s business hotels.
A Two-Tier Size Structure — 52% of Properties Have 9 Rooms or Fewer; 52% of Rooms Are in 100+ Room Properties
Splitting by property size makes the market structure clear. Properties with 9 rooms or fewer number 793, or 52.1% of the total, yet hold only 3,037 rooms (6.6%). Conversely, properties with 100+ rooms number just 117 (7.7%) but hold 23,764 rooms, or 51.6%. Small apartment-style properties spread widely across the map, while the bulk of rooms comes from large hotels that build kitchens into some of their rooms — a two-tier structure.
Share of properties and share of rooms by property size
Source: Compiled by HotelBank Editorial Team from MetroEngines Research data (N=1,521 properties, 46,063 rooms)
| Property size | Properties | Total rooms | Median listed price |
|---|---|---|---|
| 9 rooms or fewer | 793 (52.1%) | 3,037 (6.6%) | ¥18,500 |
| 10–49 rooms | 505 (33.2%) | 11,719 (25.4%) | ¥14,400 |
| 50–99 rooms | 106 (7.0%) | 7,543 (16.4%) | ¥12,400 |
| 100+ rooms | 117 (7.7%) | 23,764 (51.6%) | ¥13,700 |
Source: Compiled by HotelBank Editorial Team from MetroEngines Research data (listed price = property-level median of the lowest-plan level for 2 guests per room, tax included; 1,499 properties with price data)
Properties with 9 rooms or fewer have the highest median price at ¥18,500 because their room configuration is close to whole-building or whole-floor rentals with high per-room occupancy. The median maximum occupancy of kitchen-equipped rooms is 4 guests, and 592 properties have rooms for 5 or more. Even if the per-room rate looks expensive, the cost per person falls when a family, group or project team shares a room. For developers, the ability to design pricing around how many people use a room is the biggest difference from limited-service hotels.
Five Price Tiers — 61% of Rooms at ¥10,000–¥25,000; 4.5% at ¥50,000+
Splitting each property’s listed price (12-month median of the lowest-plan level for 2 guests per room) into five tiers reveals where supply is thick and where it is thin. By rooms, the ¥10,000–¥15,000 tier holds 31.0% and the ¥15,000–¥25,000 tier 30.2%, so these two tiers account for 61.2% of rooms. Another 19.3% is below ¥10,000, supported by weekly/monthly properties and limited-service hotels in regional areas.
Share of properties and share of rooms by listed price tier
Source: Compiled by HotelBank Editorial Team from MetroEngines Research data (1,499 properties / 45,434 rooms with price data; September 2025–August 2026)
| Price tier | Properties | Property share | Total rooms | Room share |
|---|---|---|---|---|
| Under ¥10,000 | 266 | 17.7% | 8,783 | 19.3% |
| ¥10,000–¥15,000 | 405 | 27.0% | 14,072 | 31.0% |
| ¥15,000–¥25,000 | 441 | 29.4% | 13,743 | 30.2% |
| ¥25,000–¥50,000 | 305 | 20.3% | 6,799 | 15.0% |
| ¥50,000+ | 82 | 5.5% | 2,037 | 4.5% |
Source: Compiled by HotelBank Editorial Team from MetroEngines Research data
The thin layers are the top two tiers at ¥25,000 and above. Together they account for 25.8% of properties but only 19.5% of rooms, meaning each property is small. Multi-guest apartment hotels of around 40 m² such as MIMARU and serviced apartments in central Tokyo serve this band, but only 21 properties nationwide combine 100+ rooms with a price of ¥25,000 or more. Narrowing to the ¥25,000–¥50,000 tier and 50–150 rooms leaves just 15 properties. For developments in cities aiming to capture inbound family and group demand or short-term stays by expatriate staff, this mid-size × upper-mid price combination remains an area of low supply density.
Against Business Hotels in the Same Municipality: Median 1.32x
We compared the price level of long-stay properties with the median listed price of business hotels in the same municipality. Across the 1,165 properties that could be compared, the median ratio is 1.32x, with an interquartile range of 0.96–2.00x. One in four properties sells at or below business-hotel levels, while another one in four is priced at 2x or more. Long-stay accommodation is not a single price band: it splits into a layer competing as a substitute for business hotels and a layer that creates a separate market through room size and capacity.
Distribution of price ratios against business hotels in the same municipality
Source: Compiled by HotelBank Editorial Team from MetroEngines Research data (N=1,165 properties; benchmark = median of 5+ business hotels with listed prices in each municipality)
By prefecture, the lowest price ratios are in Fukuoka (1.22x) and Osaka (1.30x): the thicker the supply of limited-service hotels in a city, the closer long-stay properties price to that band. By contrast, Nagano (2.23x), Aichi (1.83x) and Ishikawa (1.68x) show large gaps against business hotels. In these areas long-stay properties specialize in resort and inbound group demand and sustain prices decoupled from business-travel demand.
Nightly Rates for 7–30 Night Stays — 16.3% Below Standard Plans, and Longer Stays Do Not Deepen the Discount
To look at long-stay product design, we extracted plans with a minimum stay of 7 nights or more. 162 properties (10.7% of the population) offer them; by the upper minimum-stay requirement, 90 properties set 7–13 nights, 24 set 14–29 nights and 48 set 30+ nights (monthly). By prefecture, Okinawa leads with 41 properties, followed by Tokyo with 23 and Kyoto and Hokkaido with 17 each.
For the 131 properties where October 2026 stay dates could be matched against a standard plan (no minimum-stay or advance-purchase condition) for the same property, room and date, the nightly rate of minimum-stay plans was a median 83.7% of the standard plan — i.e., 16.3% cheaper. The interquartile range is 75.0%–93.8%. Notably, length makes almost no difference: 83.5% for 7–13 nights, 84.2% for 14–29 nights and 83.6% for 30+ nights. The depth of the discount is essentially set at 7 nights.
Nightly rate of minimum-stay plans (standard plan for same room and date = 100)
Source: Compiled by HotelBank Editorial Team from MetroEngines Research data (listed prices for October 2026 stays, 2 guests per room, tax included. 7–13 nights N=68 properties, 14–29 nights N=23, 30+ nights N=40)
Comparing these long-stay nightly rates with business hotels in the same municipality (median listed price for October 2026), the median across the 96 comparable properties is 1.28x (interquartile range 0.98–1.79x). Even after the long-stay discount, long-stay room rates sit at roughly 1.3x business hotels, and 25 of the 96 properties (26.0%) drop to business-hotel levels or below. The ability to keep a price gap of around 30% after discounting, as a premium for space and a kitchen, underpins the revenue structure of long-stay properties.
Only 48 properties set 30+ night (monthly) plans because month-long stays are often transacted through other channels — direct sales, corporate contracts, fixed-term leases — rather than through daily inventory on booking sites. Long-stay rates on booking sites are best read as a published floor for long-stay pricing.
Market Conditions Where Long-Stay Works — Business Demand, Station Traffic and Supply Density
For the top 14 municipalities by total rooms, we lined up the number of workers and daily station passengers within a 1 km radius of the long-stay cluster point (room-weighted centroid), the share of long-stay rooms among all rooms in the municipality, and the price ratio.
| Municipality | Properties | Total rooms | Share of rooms in municipality (upper bound) | Workers within 1 km (office-type share) | Station passengers within 1 km (per day) | Properties with 7+ night plans | Ratio to business hotels (median) |
|---|---|---|---|---|---|---|---|
| Shinjuku Ward, Tokyo | 40 | 3,329 | 12.9% | 283k (32.7%) | 3.664M | 0 | 1.34x |
| Naniwa Ward, Osaka City | 26 | 1,616 | 11.7% | 77k (14.3%) | 988k | 1 | 1.50x |
| Chuo Ward, Osaka City | 22 | 1,490 | 3.5% | 176k (23.2%) | 475k | 4 | 1.35x |
| Kita Ward, Osaka City | 4 | 1,454 | 6.3% | 313k (30.1%) | 634k | 0 | 1.41x |
| Minato Ward, Tokyo | 21 | 1,305 | 3.9% | 204k (49.9%) | 450k | 3 | 1.82x |
| Chuo Ward, Sapporo | 30 | 1,210 | 4.1% | 101k (31.5%) | 272k | 5 | 1.25x |
| Miyakojima City, Okinawa | 20 | 1,177 | 16.0% | — | No rail station | 5 | 1.26x |
| Kanazawa City, Ishikawa | 23 | 1,145 | 7.6% | 35k (25.5%) | 20k | 1 | 1.71x |
| Hakata Ward, Fukuoka City | 64 | 1,136 | 3.9% | 174k (30.5%) | 500k | 3 | 1.14x |
| Naha City, Okinawa | 57 | 1,089 | 4.2% | 44k (28.6%) | 26k | 12 | 1.12x |
| Taito Ward, Tokyo | 53 | 945 | 3.3% | 95k (21.5%) | 579k | 2 | 1.83x |
| Chuo Ward, Fukuoka City | 34 | 849 | 5.7% | 175k (25.5%) | 420k | 2 | 0.97x |
| Ota Ward, Tokyo | 18 | 840 | 7.5% | 41k (27.8%) | 102k | 3 | 1.04x |
| Chuo Ward, Tokyo | 22 | 781 | 2.7% | 380k (31.2%) | 907k | 1 | 1.89x |
Source: Compiled by HotelBank Editorial Team from MetroEngines Research data; Ministry of Internal Affairs and Communications / Ministry of Economy, Trade and Industry, “Economic Census for Business Activity (2021)”; MLIT National Land Numerical Information, “Passengers by Station” (sum of values by line and operator). Workers and station passengers are within a 1 km radius of the long-stay cluster point. Share of rooms in municipality = ratio to total rooms in the municipality tracked by MetroEngines Research
Side by side, the markets where long-stay accommodation is firmly established fall broadly into four types.
Type 1 is the business district: Shinjuku, Chuo and Minato wards in Tokyo, Kita Ward in Osaka and Hakata Ward in Fukuoka. Workers within 1 km range from 170,000 to 380,000 and station passengers from 450,000 to 3.66 million per day, giving them exceptional weekday business demand and transport-hub depth. The ratio to business hotels varies from 1.1x to 1.9x, but only 0–3 properties offer 7+ night plans; the dominant operating model is daily sales that combine weekday business travel with weekend leisure. Shinjuku holds long-stay properties equivalent to 12.9% of the ward’s rooms on a whole-property room basis, much of it from large hotels with mini-kitchen rooms.
Type 2 is the tourism and inbound hub, typified by Naniwa Ward in Osaka, Taito Ward in Tokyo and Kanazawa. The share of office-type workers is lower at 14–26%, but the ratio to business hotels is high at 1.50–1.83x. Kitchen-equipped rooms that sleep several guests sell to inbound families and groups at prices separate from limited-service hotels. In Naniwa Ward, 11.7% of the ward’s rooms are long-stay, with apartment-style supply clustered around Namba.
Type 3 is the resort stay: Miyakojima and Naha. Properties offering 7+ night plans number 12 in Naha and 5 in Miyakojima — clearly more than in cities — and Okinawa as a whole accounts for 41 of the 162 such properties nationwide. In Miyakojima, long-stay properties reach 16.0% of the city’s rooms. The ratio to business hotels is a moderate 1.1–1.3x, and these markets capture multi-day demand — workations, trial stays before relocating, construction and business-related stays — through long-stay plan design.
Type 4 is business-hotel-adjacent: Chuo Ward in Fukuoka (0.97x) and Ota Ward in Tokyo (1.04x). They offer space and a kitchen at roughly business-hotel prices, capturing medium- to long-term business and airport-related demand. Ota Ward, home to Haneda Airport, has 7.5% of its rooms in long-stay properties.
Translated into investment terms, the conditions for a viable long-stay market can be summarized in three points: (1) at least one of business, tourism or resort demand is deep; (2) the operator can choose between daily-sales and long-stay-plan models to match that demand; and (3) long-stay rooms still account for only a few percent of the municipality’s rooms, leaving room to differentiate on a price gap of 1.0–1.5x against existing business hotels. In Shinjuku, Naniwa and Miyakojima, where the share exceeds 10% on a whole-property room basis, the next wave of supply will compete not on location but on room specification and price tier.
Demand for Living Functions in Guest Reviews — Laundry Mentions About 4x Business Hotels
To see how guests perceive the value of long-stay properties, we checked mentions in reviews. Using guest reviews from the most recent 24 months (October 2024–September 2026) aggregated by the HotelBank Editorial Team, we analyzed each property and compared 960 long-stay properties with 20+ reviews against 1,035 randomly sampled business hotels.
Mention rates in guest reviews (property average)
Source: HotelBank Editorial Team (mention analysis of guest reviews, October 2024–September 2026. Long-stay N=960 properties, business hotels N=1,035 properties)
The mention rate for laundry facilities (laundry rooms and washing machines) averages 5.8% per long-stay property versus 1.5% for business hotels — about four times higher. The share of properties with three or more such mentions is 52.1%, well above the 31.9% for business hotels. Alongside the kitchen, the washing machine is central to the experience of “staying as if living there”, and guests value it. The mention rate for long stays themselves is nearly level — 2.5% for long-stay properties and 2.2% for business hotels — showing that business hotels also absorb a wide range of extended business-trip demand. The source of differentiation for long-stay properties lies less in “being able to stay long” than in the living functions that make a long stay work.
Pipeline — Openings Peaked in 2020; 2025–2026 Running at 60–80 Properties a Year
Arranging the 1,521 properties by opening year, 94–156 properties opened each year in 2018–2021, peaking in 2020 at 156 properties and 3,486 rooms. Openings settled to around 60 a year in 2022–2023, then rose again to 68 in 2024 and 78 properties with 1,945 rooms in 2025. For 2026, listings confirmed through September already total 58 properties with 1,950 rooms, and the average property is getting larger.
Long-stay properties by opening year (properties and total rooms)
Source: MetroEngines Research & Consulting (based on confirmed OTA listings; properties with a known opening year among N=1,521). *Listings appear several months before opening, so 2026 and later may increase as new listings appear
Recent openings follow two currents. One is multi-guest apartment hotels in cities. Cosmos Initia’s MIMARU reached its 28th property and about 1,500 rooms with MIMARU OSAKA SHINSAIBASHI CENTRAL, opened on September 1, 2026, and has announced a target of 3,000 rooms by 2030. Mitsubishi Estate opened the first property of its new long-stay brand WAYPOINT in Tsukiji (52 rooms) on April 1, 2026, with a goal of 10 openings by 2030.
The other is large limited-service hotels in regional and suburban areas, where rooms equipped with a kitchen, washing machine and microwave as standard are opening near industrial parks and airports. Based on our listing confirmations, Tabino Hotel (たびのホテル) has opened in Kakogawa (September 2025, 172 rooms), Ishikari (October 2025, 175 rooms), Aso Kumamoto Airport (April 2026, 213 rooms) and Utsunomiya Yuinomori (August 2026, 201 rooms), and listings have started for Toyokawa (November 2026, 112 rooms) and Sakata (February 2027, 178 rooms). As regional long-stay supply serving construction, training and project-based stays, this could become a development model going forward.
Among international brands, of the 22 hotels Hyatt operates in Japan (9 brands, 5,066 rooms in total), Hyatt House has two: Tokyo Shibuya (opened February 26, 2024, 126 rooms) and Kanazawa (opened August 2020, 92 rooms). Of these, Hyatt House Kanazawa is included in this article’s population through its kitchen-equipped room listings.
Source: Hyatt Japan, press materials (April 2026)
| Category | Count | Notes |
|---|---|---|
| Building plans tracked by us (including hotel use) | 70 | Based on building confirmation applications in MLIT’s “Statistical Survey of Building Construction Starts” |
| Of which: mixed-use developments listing apartments, residences or condominiums as a main use | 9 | All with 100+ planned guest rooms |
| Of which: scheduled completion in 2027–2028 | 6 | Okayama, Yokohama, Osaka, Chuo Ward (Tokyo), Shibuya Ward and others |
Source: Compiled by MetroEngines Research & Consulting from MLIT’s “Statistical Survey of Building Construction Starts”. *Based on confirmation applications at the time of the survey. Counts and room numbers are expected to rise with additional applications; treat as a lower bound of the confirmed pipeline
Mixed-use developments that combine housing and lodging in the same building are another route for increasing long-stay supply. Placing units leased monthly under fixed-term leases and rooms sold nightly under a hotel license in the same building lets operators shift their sales focus with seasonal demand. Such plans are concentrated in urban redevelopment and their completions cluster in 2027–2028.
Implications for Investment and Development — The Gaps Are “Mid-Size × Upper-Mid Price” and Regional Living-Function Hotels
From the macro aggregates above, we organize five points to check when considering long-stay development or acquisition.
| Point | What this article measured | Decision guide |
|---|---|---|
| Area | 67.8% of rooms in six prefectures. Supply exists in all 47, and large limited-service openings continue in regional areas | In cities, choose the model by type of demand source (business, tourism, resort). In regional areas, first confirm project demand from industrial parks, airports or redevelopment |
| Price tier | 61.2% of rooms at ¥10,000–¥25,000. Only 15 properties at ¥25,000–¥50,000 × 50–150 rooms | Mid-size plans targeting the upper-mid price tier face few competitors. Design on a per-person rate assuming multi-guest occupancy |
| Ratio to business hotels | Median 1.32x in the same municipality; 1.28x even after long-stay discounts | Whether a 1.0–1.5x price gap can be sustained as a premium for space, kitchen and washing machine is the baseline for the P&L |
| Long-stay plan design | 7+ night plans are −16.3%; the depth is about the same at 14 and 30 nights | Publicly sold plans need tiering only up to 7 nights. Design 30-night stays separately through direct sales, corporate contracts and fixed-term leases |
| Room specification | Laundry mentions in reviews are about 4x business hotels | Whether kitchens and washing machines are standard in all rooms or only some determines the breadth of demand you can target |
Source: Compiled by HotelBank Editorial Team from MetroEngines Research data
The combination of price tier and size deserves particular attention. The top two tiers at ¥25,000 and above make up a quarter of properties but less than 20% of rooms, and are dominated by small apartments. If a mid-size building can be configured with multi-guest rooms and priced so that the per-person cost is not far from business hotels, there is room to capture both inbound family/group demand and corporate project stays. Meanwhile, in regional areas, limited-service hotels of 100–200 rooms with kitchens and washing machines as standard are being built to serve construction, training and long business trips — a model targeting stable extended-stay demand at around 1x business-hotel pricing that is gaining ground.
The design of housekeeping and linen-change frequency also has a material effect on the P&L; in a separate HotelBank estimate, differences in average length of stay shift housekeeping cost by about ¥187,000 per room per year. Because long-stay properties can reduce cleaning during multi-night stays, they can raise per-room profit margins by more than the room-rate gap alone — a point worth building into development decisions.
Frequently Asked Questions
Q. How many long-stay hotels are there in Japan?
A. Within the scope tracked by MetroEngines Research, properties that list rooms with a kitchen (including simple cooking facilities) and properties that call themselves apartment hotels, condominiums or monthly/weekly stays total 1,521 properties with 46,063 rooms across all 47 prefectures. 67.8% of the rooms are in Tokyo, Osaka, Okinawa, Hokkaido, Fukuoka and Kyoto. The figures cover properties listed on major booking sites and exclude properties operating only on monthly contracts.
Q. What is the typical nightly price range for long-stay hotels?
A. At the lowest-plan level for 2 guests per room (tax included), the property median is about ¥16,100. 61.2% of rooms are in the ¥10,000–¥25,000 band, and 4.5% are at ¥50,000 or more. Compared with business hotels in the same municipality, the median price level is 1.32x.
Q. How much cheaper is it to stay longer?
A. 162 properties offer plans requiring a stay of 7+ nights, and their nightly rate is a median 16.3% lower than the standard plan for the same room on the same date (October 2026 stays, 131 properties). The discount depth barely changes across 7–13, 14–29 and 30+ nights.
Q. Which long-stay hotel brands operate in Japan?
A. Examples include MIMARU, Minn, WAYPOINT, Oakwood, Citadines, Hyatt House, Fraser, Tabino Hotel and Tokyu Stay. Because each company counts its properties differently, this article does not compare brands by size and instead aggregates supply by area, price tier and property size.
Summary
Counted across brands, Japan has 1,521 long-stay properties with 46,063 rooms within the scope tracked by MetroEngines Research. While spread across all 47 prefectures, nearly 70% of rooms are in six, and the market has a two-tier structure in which half of the properties have 9 rooms or fewer while half of the rooms are in properties with 100+ rooms. Prices are concentrated at ¥10,000–¥25,000, around 1.3x business hotels in the same municipality, and that gap holds even after the roughly 16% discount on 7+ night plans.
Viable markets fall into four types — business districts, tourism/inbound hubs, resort stays and business-hotel-adjacent — each with a different operating focus between daily sales and long-stay plan design. On the supply side, two currents continue: multi-guest apartment hotels in cities and large regional limited-service hotels built around living functions. For development and acquisition decisions, the keys are the area’s demand source, per-person price design, and how to capture the relatively open mid-size × upper-mid price segment.
⚠ Note on prices for future dates: The October 2026 stay prices used to compare minimum-stay plans with business hotels are listed prices published on booking sites at the time of the survey (late September 2026) and will change as check-in approaches. Levels may shift with new plans or last-minute price adjustments.
References and Sources
■ Data sources
Listing information from major booking sites collected by MetroEngines Research & Consulting (room names, plan names and listed prices; September 2025–August 2026 and October 2026 stays); mention analysis of guest reviews by the HotelBank Editorial Team (October 2024–September 2026); Ministry of Internal Affairs and Communications / Ministry of Economy, Trade and Industry, “2021 Economic Census for Business Activity”; MLIT National Land Numerical Information, “Passengers by Station”; MLIT, “Statistical Survey of Building Construction Starts”.
■ Calculation assumptions
The population consists of properties with room types whose names include kitchen, self-catering, apartment, condominium or similar terms, and properties whose names include a long-stay format (1,521 properties, 46,063 rooms). Prices are listed prices: the property-level 12-month median of monthly values at the lowest-plan level per room for 2 guests, tax included. The ratio to business hotels is the ratio to the median of 5+ business hotels with listed prices in the same municipality. Long-stay rates are compared with the cheapest standard plan (no long-stay or advance-purchase condition) for the same property, room and stay date. Market indicators are aggregated within a 1 km radius of the room-weighted cluster point.
■ Limitations
This is not a census; it covers properties listed on major booking sites within the scope tracked by MetroEngines Research and excludes properties operating only on monthly contracts as well as direct-sale and corporate-contract prices. Total rooms are whole-property counts, so the actual number of kitchen-equipped rooms is lower. Prices are listed prices, not estimated settled ADR. October 2026 stay prices are those published at the time of the survey (late September 2026) and may change before the stay date. Opening years are based on confirmed listings and may increase for 2026 and later as new listings appear.
■ Market data
- MetroEngines Research & Consulting — Booking-site listing information (room names, plan names and listed prices; September 2025–August 2026 and October 2026 stays), opening years (based on confirmed OTA listings, N=1,521 properties)
- HotelBank Editorial Team — Mention analysis of guest reviews (October 2024–September 2026; 960 long-stay properties and 1,035 business hotels)
■ Government statistics and public data
- Ministry of Internal Affairs and Communications / Ministry of Economy, Trade and Industry, “2021 Economic Census for Business Activity” (令和3年経済センサス-活動調査)
- MLIT National Land Numerical Information, “Passengers by Station” (駅別乗降客数データ) (obtained via the Real Estate Information Library)
- MLIT, “Statistical Survey of Building Construction Starts” (建築物動態統計調査)
- Ministry of Health, Labour and Welfare, “Overview of the Act on Sanitation Business” (including hotel business)
■ Company and brand releases
- Daiwa House Group, “Apartment hotel MIMARU restarts new openings toward 3,000 rooms by 2030; MIMARU OSAKA SHINSAIBASHI CENTRAL opens September 1, 2026” (August 26, 2026)
- Mitsubishi Estate, “Full-scale entry into the apartment hotel business” (February 2, 2026)
- Mitsubishi Estate Hotels & Resorts, “First property of new brand WAYPOINT opens April 1, 2026 in Tsukiji, Tokyo”
- Hyatt Japan, press materials (April 2026)
■ News and industry sources
- Travel Voice, “Mitsubishi Estate enters apartment hotel business; first property opens in Tsukiji in April, targeting 10 hotels by 2030” (February 2, 2026)
- logmi Finance, “Cosmos Initia accelerates expansion of apartment hotel MIMARU, targeting 3,000 rooms by 2030”
Source: Hyatt Japan, press materials (April 2026)