

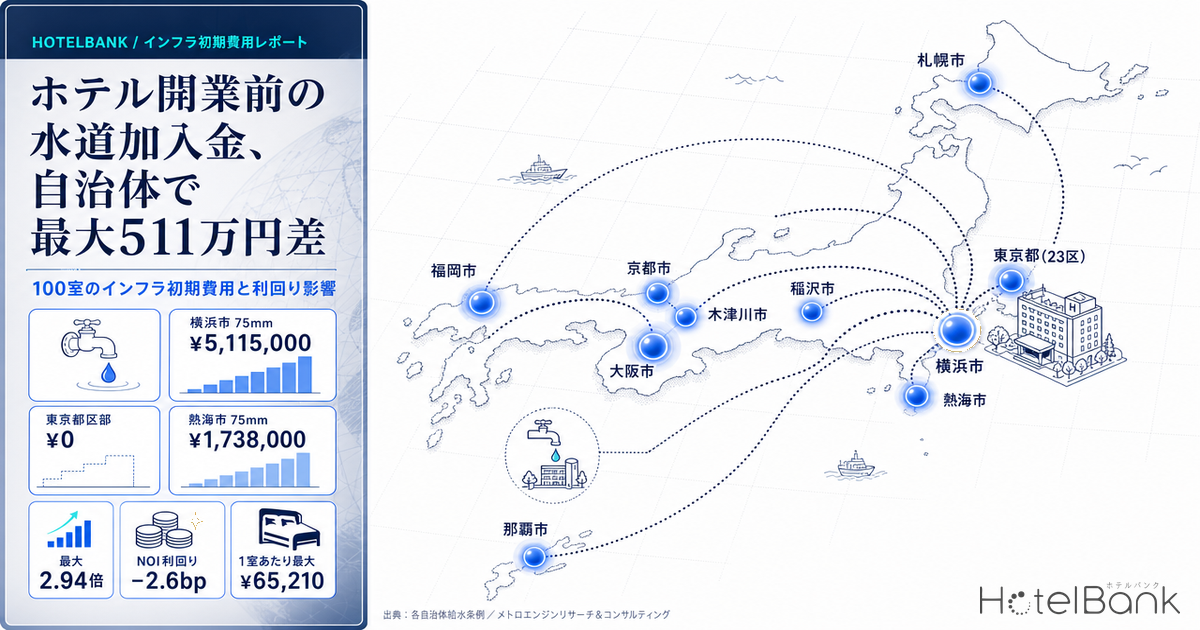
In hotel site acquisition decisions, water is usually filed on the operating-expense side of the business plan as a “monthly variable cost.” But the moment a site is secured, a separate set of line items sends cash out the door in a lump sum, before service even begins: the water supply connection fee (also called the water service connection charge or water supply contribution), the sewerage beneficiary contribution, and the water service installation work cost. This article compares these “initial-side infrastructure costs” in actual yen by municipality, and estimates the total gap for a 100-room hotel together with its impact on acquisition cost, depreciation and yield.
How this differs from the earlier series — this article covers “initial,” not “running,” costs
HotelBank’s cost-structure series has so far dealt with the water bills paid monthly after a property opens. Our earlier piece “Hotel Water & Sewer Costs Vary 2.1x by Municipality: ¥7.85mn NOI Gap,” and a companion analysis of the roughly 630 L of water each guest consumes, both concerned volumetric and fixed tariffs — running costs that erode NOI as operating expenses in every period.
What this article covers is the connection fees, beneficiary contributions and water service installation costs paid as a lump sum “before” service begins. These are not operating expenses; they are capitalized as acquisition cost or as an asset of equivalent character, and are subject to depreciation. They differ in line item, in payment timing and in accounting character, and in a business plan they belong in the up-front cost table, not the operating-expense table. This article is positioned as the “initial-cost edition” of the cost-structure series.
Terms and metric definitions used in this article
- Water supply connection fee (water service connection charge / water supply contribution): a one-time payment made to the water utility, separate from construction costs, when a new water service installation is created or an existing one is upgraded to a larger meter diameter. Amounts are set for each meter diameter under the municipality’s water supply ordinance. Amounts already paid are not refunded. Figures in this article are the tax-inclusive amounts (10% consumption tax) published in each municipality’s ordinance or fee schedule.
- Sewerage beneficiary contribution: a one-time payment under which owners of land that benefits from public sewer construction bear part of the construction cost. Most municipalities calculate it by multiplying the site area (m²) by a unit rate.
- ADR (average daily rate): an estimated settled rate (tax-exclusive equivalent) derived by applying a segment-specific adjustment coefficient to the lowest published plan level each property lists on OTAs (double occupancy, per-room rate, tax-included). Cross-checked against property-level results disclosed by listed hotel REITs (91 properties, most recent three months), the median error is approximately 7%. These are estimates and differ from each property’s actual transacted rates and accounting figures. Area-level ADR is the median of the properties covered (the level of a typical property in that area).
- Data sources: water supply ordinances and fee schedules published by each municipality, National Tax Agency Tax Answer, MetroEngines Research & Consulting
- — The connection fee for a 75 mm meter is ¥0 in Tokyo’s 23 wards and ¥5,115,000 in Yokohama. Under identical conditions, a gap of up to ¥5.11 million is fixed by ordinance alone.
- — Sewerage beneficiary contribution rates range from ¥144 to ¥700 per m², a 4.9x spread. On a 2,000 m² site that is a gap of ¥288,000 to ¥1.40 million.
- — For the base case of a 100-room limited-service hotel, 75 mm meter and a 2,000 m² site, total initial infrastructure cost is ¥0 to ¥6.52 million (¥0 to ¥65,210 per room).
- — Against a total project cost of ¥2.2 billion, the impact on NOI yield is 0.7 to 2.6 bp. Flexing ADR and occupancy in the same model moves it by 290 bp — two orders of magnitude apart.
- — Connection fees are not operating expenses but intangible depreciable assets (NTA Tax Answer No.5463, 15-year depreciation). Burying them in the land account means the depreciation benefit never makes it into the business plan.
Connection fees are not “operating expenses” — they are intangible depreciable assets amortized over 15 years
The main reason connection fees get overlooked in site acquisition decisions is that where they land in the accounts is not intuitive. The National Tax Agency’s Tax Answer No.5463, “Tax treatment of development contributions paid in connection with residential land development,” divides development contributions into three categories according to their character.
| Character of the contribution | Accounting treatment | Depreciation |
|---|---|---|
| Contributions for facilities that directly create the utility of the land itself — estate roads, parks, stormwater retention ponds | Included in the acquisition cost of the land | Not depreciable |
| Contributions for water supply, sewerage and industrial water | Intangible depreciable asset | 15 years |
| Contributions for facilities that manage relations with nearby residents — buffer green space, educational and welfare facilities | Deferred asset | 8 years |
| Contributions for facilities with independent utility, such as roads near the estate | Deferred asset | Seven-tenths of the useful life |
Source: prepared by MetroEngines Research & Consulting from National Tax Agency Tax Answer No.5463, “Tax treatment of development contributions paid in connection with residential land development”
What matters in hotel development practice is that water and sewer contributions are not capitalized into land, but treated as intangible depreciable assets that can be amortized over 15 years. Once folded into the acquisition cost of land, an amount can never be depreciated; as an intangible depreciable asset it is expensed against taxable income period by period. Even among “lump sums paid at the development stage,” a water connection fee and an estate-road contribution work on cash flow in completely different ways. It is worth sorting each contribution into the right category at the point where the up-front cost table of the business plan is built.
In addition, many municipalities state explicitly in their ordinances that amounts already paid are not refunded. Article 29 of Naha City’s water supply ordinance, for example, provides both for payment at the time of application and for non-refund of amounts already paid. If a design change reduces the meter diameter, the fee already paid does not come back. This irreversibility is a practical constraint on when to freeze the design.
Up to ¥5.11 million at a 75 mm meter — zero in Tokyo’s 23 wards, ¥5.11 million in neighbouring Yokohama
Using the water supply ordinances and fee schedules published by each municipality, we compiled the connection fee by meter diameter for 10 major municipalities in actual yen. The comparison covers the 40 mm and above range that a hotel-scale water supply implies.
| Municipality | 25mm | 40mm | 50mm | 75mm | 100mm |
|---|---|---|---|---|---|
| Yokohama | ¥82,500 | ¥1,402,500 | ¥2,145,000 | ¥5,115,000 | ¥8,745,000 |
| Sapporo | ¥313,500 | ¥990,000 | ¥1,782,000 | ¥4,950,000 | ¥10,120,000 |
| Kizugawa | ¥352,000 | ¥1,045,000 | ¥1,903,000 | ¥4,752,000 | ¥9,504,000 |
| Kyoto City | ¥148,500 | ¥506,000 | ¥902,000 | ¥3,278,000 | ¥10,076,000 |
| Fukuoka City | ¥165,000 | ¥583,000 | ¥1,067,000 | ¥3,135,000 | ¥6,710,000 |
| Inazawa | ¥308,000 | ¥770,000 | ¥1,155,000 | ¥2,695,000 | ¥4,620,000 |
| Osaka City | — | — | — | ¥2,530,000 | ¥5,500,000 |
| Naha | ¥105,600 | ¥359,700 | ¥746,900 | ¥1,796,300 | ¥4,675,000 |
| Atami | ¥121,000 | ¥374,000 | ¥638,000 | ¥1,738,000 | ¥3,542,000 |
| Tokyo (23 wards) | — | — | — | — | — |
Amounts include 10% consumption tax. “—” indicates that no connection fee or contribution is levied. Osaka City levies a contribution only at 75 mm and above (Article 33-2 of the city’s water supply ordinance; the figures shown are the tax-inclusive equivalent, i.e. the ordinance amount multiplied by 110/100). Yokohama’s 13–25 mm rates are preferential amounts limited to detached and multi-unit housing for ordinary residential use.
Source: prepared by MetroEngines Research & Consulting from the water supply ordinances and fee schedules published by each municipality (N=10 municipalities)
Source: prepared by MetroEngines Research & Consulting from the water supply ordinances and fee schedules of each municipality
The results split sharply. Tokyo’s 23 wards have no water supply connection fee scheme at all. The Tokyo Metropolitan Waterworks Bureau laid its mains publicly from the outset, and within the 23 wards no connection fee is payable regardless of meter diameter (service-line construction costs are still charged separately). By contrast, Yokohama charges ¥5,115,000 at a 75 mm meter and ¥8,745,000 at 100 mm, collected as a lump sum on installation — for a city within 30 km of central Tokyo serving the same metropolitan market. For sites targeting the same catchment, simply crossing an administrative boundary determines whether more than ¥5 million of up-front cash goes out.
Even among municipalities that do levy a fee, the spread is wide. At 75 mm, Yokohama’s ¥5,115,000 against Atami’s ¥1,738,000 is 2.94x; at 50 mm, Yokohama’s ¥2,145,000 against Atami’s ¥638,000 is 3.36x; and at 100 mm, Sapporo’s ¥10,120,000 against Atami’s ¥3,542,000 is 2.86x. Against the 2.1x inter-municipal gap in running water and sewer tariffs covered in our earlier article, the initial-cost side shows an even wider dispersion.
One step up in meter diameter costs millions of yen — and the shape of the escalation curve differs by municipality
Connection fees do not scale linearly with meter diameter; they escalate steeply. Because the gradient of that escalation differs by municipality, the design decision of “which diameter to plan for” carries different weight depending on where the site is.
Source: prepared by MetroEngines Research & Consulting from the water supply ordinances and fee schedules of each municipality
Take Yokohama: stepping up from 25 mm to 40 mm alone jumps the fee from ¥82,500 to ¥1,402,500. From 40 mm to 50 mm adds another ¥742,500, and from 50 mm to 75 mm adds ¥2,970,000. In Fukuoka City, the single step from 50 mm to 75 mm adds ¥2,068,000; in Kyoto City, the step from 75 mm to 100 mm adds ¥6,798,000. Kyoto City’s 100 mm fee (¥10,076,000) is 11.2 times its own 50 mm fee (¥902,000).
The practical implication is straightforward. The choice of supply method (receiving-tank system versus direct booster connection) and the sizing of the required meter diameter are, simultaneously, an engineering decision and an investment decision worth millions of yen. The steeper a municipality’s escalation, the greater the economic value of engineering the diameter down one step at the schematic design stage. Conversely, in zones where the fee is zero — Tokyo’s 23 wards, or Osaka City at 50 mm and below — there is almost no financial incentive to do that work at all. The same engineer running the same exercise recovers a completely different amount depending on location.
Connection fee map for 10 major municipalities (75 mm meter)
Circle size corresponds to the 75 mm connection fee. Source: prepared by MetroEngines Research & Consulting from the water supply ordinances and fee schedules of each municipality
Plotted on a map, it becomes clear that fee levels cannot be explained by regional bloc. Sapporo in Hokkaido (¥4,950,000) and Yokohama in the Tokyo metropolitan area (¥5,115,000) sit close together, while Tokyo’s 23 wards — in that same metropolitan area — are at zero; and within the Kyoto–Osaka–Kobe region, Kyoto City (¥3,278,000), Osaka City (¥2,530,000) and Kizugawa (¥4,752,000) all diverge. Connection fees are not a regional market rate but the outcome of a financial judgment each water utility sets individually by ordinance, and they are not continuous even between adjacent municipalities. When comparing sites, prefecture-level or region-level estimates will not do; the ordinance of the specific municipality must be checked case by case.
Sewerage beneficiary contributions scale with site area — a 4.9x spread in unit rates
The other initial-cost line item alongside the connection fee is the sewerage beneficiary contribution. Rather than meter diameter, it is calculated by multiplying the area of the subject land by a unit rate in most cases, so it bites harder the larger the hotel site. Unit rates for major municipalities, and the resulting charge on an assumed 2,000 m² site, are as follows.
Source: prepared by MetroEngines Research & Consulting from materials published by each municipality (2,000 m² site assumed)
| Municipality / contribution district | Unit rate | Charge on a 2,000 m² site |
|---|---|---|
| Matsudo | ¥700/m² | ¥1,400,000 |
| Odate (Odate district) | ¥420/m² | ¥840,000 |
| Odawara | ¥280/m² | ¥560,000 |
| Sapporo (Barato district) | ¥245/m² | ¥490,000 |
| Kumamoto | ¥200/m² | ¥400,000 |
| Sapporo (Chubu district) | ¥144/m² | ¥288,000 |
Sapporo divides the city into five contribution districts with different unit rates (Chubu ¥144 / Jozankei ¥169 / Teine ¥171 / Atsubetsu ¥195 / Barato ¥245). Odate also varies by district (Odate ¥420 / Hinai ¥390 / Tashiro ¥350).
Source: prepared by MetroEngines Research & Consulting from materials published by Matsudo, Odate, Odawara, Kumamoto and Sapporo
Unit rates run from ¥200/m² in Kumamoto to ¥700/m² in Matsudo, a spread of 3.5x; including Sapporo’s Chubu contribution district at ¥144/m², the spread widens to 4.9x. On a 2,000 m² hotel site that is a range of ¥288,000 to ¥1,400,000 — smaller in absolute terms than the connection fee, but because it scales with site area, it works very differently on large resort developments. A 10,000 m² resort project at Matsudo’s rate comes to ¥7 million, putting it on par with the connection fee.
Note too that some municipalities levy an area-proportional lump sum on the water side as well. Atami charges a water development contribution of ¥200 per m² (tax-inclusive) for residential land development and ¥600 per m² (tax-inclusive) for multi-unit residential construction, separate from both the connection fee and the sewerage beneficiary contribution. Because line-item names differ from one municipality to the next, checking only for a “connection fee” will miss charges. In site due diligence, the reliable approach is to ask both the water utility and the sewerage authority for every lump-sum charge triggered by a new installation. Municipal ordinances drive project costs through more line items than these: our analysis of hotel parking ordinance requirements, which vary 2.5x across cities, covers the same structure, in which city-by-city additional regulation feeds through to the business plan.
Assumed meter diameter for a 100-room hotel, and the total initial infrastructure cost
Which meter diameter a 100-room hotel needs depends on the supply method, whether it has a large communal bath, and the scale of its kitchens. As covered in our earlier article, water use runs at roughly 630 L per guest; at 100 rooms, double occupancy and 80% occupancy (a modelling assumption as of August 2026, full-year average basis, not an actual result), daily demand comes to around 100 m³. A limited-service hotel on a receiving-tank system typically falls in the 50–75 mm range, while a full-service property with a large communal bath or major banquet kitchens falls in the 75–100 mm range. Here we take a 100-room limited-service hotel, a 75 mm meter and a 2,000 m² site as the base case for the total.
| Case | Water connection fee (75mm) |
Sewerage beneficiary contribution (2,000 m²) |
Water service installation work fee |
Total | Per room |
|---|---|---|---|---|---|
| High case (Yokohama-level connection fee + ¥700/m²) | ¥5,115,000 | ¥1,400,000 | ¥6,000 | ¥6,521,000 | ¥65,210 |
| Mid case (Fukuoka-level connection fee + ¥280/m²) | ¥3,135,000 | ¥560,000 | ¥6,000 | ¥3,701,000 | ¥37,010 |
| Low case (Atami-level connection fee + ¥144/m²) | ¥1,738,000 | ¥288,000 | ¥6,000 | ¥2,032,000 | ¥20,320 |
| Zero case (Tokyo 23 wards — no connection fee scheme) | ¥0 | — | — | ¥0 | ¥0 |
Each case is a modelled figure combining published rates from real municipalities and does not represent the actual total for any single municipality. The water service installation work fee applies Atami’s 75 mm fee (¥6,000, tax-exempt) across all cases. Actual service-line construction costs and in-building piping costs are additional.
Source: prepared by MetroEngines Research & Consulting from rates published by each municipality
Even under identical conditions — 100 rooms and a 75 mm meter — total initial infrastructure cost is distributed across a range from ¥0 to roughly ¥6.52 million. Restated per room, that is ¥0 to ¥65,210 — comparable to the FF&E cost of a single guest room. How the per-room investment figure itself should be set is reverse-calculated from planning data in our reverse-calculation of per-room construction cost at ¥20.67 million, derived from a 35.0 m² per-room floor area across 31 planned projects,. Substitute a 100 mm design on a large site and a Sapporo-level connection fee of ¥10,120,000 plus the beneficiary contribution puts the lump sum for a single property in the ¥10 million range.
The yield impact is 1–3 bp — but three reasons not to leave it at “small”
The NOI yield used here is annual net operating income (NOI, i.e. operating profit before depreciation) divided by total project cost. The unit of change, bp (basis point), is 0.01 points, so 100 bp equals 1.00 point. To gauge how this initial-cost gap feeds into investment yield, we model it on the actual results of a listed hotel REIT. As a limited-service benchmark, Ichigo Hotel REIT (いちごホテルリート投資法人) reported July 2026 full-portfolio results of 84.4% occupancy (as of July 2026, full portfolio, N=27 properties), ADR of ¥9,684 and RevPAR of ¥8,175 (RevPAR −1.6% year on year, 27 properties). Applying that level to 100 rooms and assuming a new development with a total project cost of ¥2.2 billion, the sensitivity is as follows.
| Level of initial infrastructure cost | Total project cost | NOI yield | vs. zero case |
|---|---|---|---|
| No connection fee (Tokyo 23 wards) | ¥2,200,000,000 | 5.744% | — |
| Osaka City, 75 mm (¥2,530,000) | ¥2,202,530,000 | 5.738% | −0.7bp |
| Fukuoka City, 75 mm (¥3,135,000) | ¥2,203,135,000 | 5.736% | −0.8bp |
| Yokohama, 75 mm (¥5,115,000) | ¥2,205,115,000 | 5.731% | −1.3bp |
| Sapporo, 100 mm (¥10,120,000) | ¥2,210,120,000 | 5.718% | −2.6bp |
Assumptions: 100 rooms; RevPAR ¥8,175 (Ichigo Hotel REIT, July 2026 full-portfolio result); rooms revenue at 85% of total revenue; GOP margin 40%; NOI at 90% of GOP; total project cost ¥2.2 billion. This is a simplified estimate; an actual investment decision requires a detailed feasibility study.
Sources: Ichigo Hotel REIT, “Monthly Operating Results (July 2026)”; MetroEngines Research & Consulting
Source: MetroEngines Research & Consulting (modelled figures)
For a single property, the impact on NOI yield stays within 0.7 to 2.6 bp. That is the natural result of a few million yen set against a ¥2.2 billion project cost. Looking at that number alone, it is tempting to conclude it is within the margin of error. In the practice of site acquisition, however, three points make it impossible to ignore.
First, as pre-opening cash it bites in absolute terms. A Yokohama-level 75 mm connection fee of ¥5,115,000 plus a sewerage beneficiary contribution of ¥1,400,000 is cash leaving the business before completion, with zero revenue coming in. As a ratio it is 1.3 bp; on the cash-flow schedule during the development period it stands as a ¥6.52 million line in actual yen. That is large enough to affect additional equity contributions or the sizing of a credit facility.
Second, across a multi-property rollout the order of magnitude changes. Stack a Yokohama-level fee of ¥5.11 million across ten properties and it becomes ¥51.15 million. For a regionally expanding chain comparing dozens of candidate sites, simply prioritising municipalities with lower fees moves initial investment by tens of millions of yen. What is noise for one property is decision-grade information across the pipeline.
Third, it flows through the P&L for 15 years via depreciation. Booking water and sewer contributions as intangible depreciable assets amortized over 15 years, per the National Tax Agency’s treatment, a ¥5.11 million connection fee is recognised as roughly ¥340,000 of depreciation expense each year for 15 years. Unlike other development contributions that get capitalized into land, it is expensed against taxable income — which, on a cash-flow basis, works in the project’s favour. Bury the connection fee in the land account of the up-front cost table and that depreciation benefit never makes it into the business plan.
Against market ADR — the initial-cost gap is absorbed by a few nights of revenue
Estimated settled ADR compiled by MetroEngines Research as of July 2026 stands at ¥12,784 in Kanagawa, ¥12,642 in Tokyo, ¥10,873 in Fukuoka and ¥8,761 in Osaka. On a most-recent-13-month median basis (July 2025 to July 2026), the figures are ¥14,164 in Kanagawa, ¥13,855 in Tokyo, ¥14,305 in Kyoto, ¥11,708 in Fukuoka and ¥10,252 in Osaka.
| Prefecture | Estimated settled ADR (July 2026) | Properties covered (July 2026) |
Median, most recent 13 months July 2025 – July 2026 |
75 mm connection fee, main city |
|---|---|---|---|---|
| Tokyo | ¥12,642 | N=1136 | ¥13,855 | 23 wards: ¥0 |
| Kanagawa | ¥12,784 | N=576 | ¥14,164 | Yokohama: ¥5,115,000 |
| Kyoto | ¥12,161 | N=604 | ¥14,305 | Kyoto City: ¥3,278,000 |
| Osaka | ¥8,761 | N=647 | ¥10,252 | Osaka City: ¥2,530,000 |
| Fukuoka | ¥10,873 | N=473 | ¥11,708 | Fukuoka City: ¥3,135,000 |
| Hokkaido | ¥12,156 | N=952 | ¥10,334 | Sapporo: ¥4,950,000 |
| Okinawa | ¥13,722 | N=508 | ¥11,284 | Naha: ¥1,796,300 |
| Shizuoka | ¥12,687 | N=861 | ¥13,462 | Atami: ¥1,738,000 |
ADR is estimated settled ADR (tax-exclusive equivalent). N = Tokyo 1,136 properties, Osaka 647, Kyoto 604, Hokkaido 952, Okinawa 508, Fukuoka 473, Kanagawa 576, Shizuoka 861 (as of July 2026).
Source: MetroEngines Research & Consulting
Divide Yokohama’s 75 mm connection fee of ¥5,115,000 by Kanagawa’s estimated settled ADR of ¥12,784 and it comes to 400 room-nights. For a 100-room hotel running at 80% occupancy (a modelling assumption as of August 2026, full-year average basis), that is five days of rooms revenue. Once the property is in its operating phase the amount is absorbable, which is a further reason it is not a “factor that determines yield.” What matters is the timing — it goes out as a non-refundable lump sum before opening, when revenue is zero.
Sensitivity compared — against 3 bp from connection fees, ADR and occupancy move 290 bp
The previous section concluded that differences in initial infrastructure cost move NOI yield by only 0.7 to 2.6 bp. That figure only means something once set against a comparison. Using the same 100-room, ¥2.2 billion model, we lay out on two axes how yield swings when the numerator variables — ADR and occupancy — are flexed. The blue-outlined cell is the same base case as the previous section (ADR ¥9,684; occupancy 84.4%, as of July 2026, full portfolio, N=27 properties).
| ADR | Occupancy | ||||
|---|---|---|---|---|---|
| 76.0% | 80.0% | 84.4% | 88.0% | 92.0% | |
| ¥8,500 | 4.54% | 4.78% | 5.04% | 5.26% | 5.49% |
| ¥9,000 | 4.81% | 5.06% | 5.34% | 5.57% | 5.82% |
| ¥9,684 | 5.17% | 5.44% | 5.74% | 5.99% | 6.26% |
| ¥10,500 | 5.61% | 5.90% | 6.23% | 6.49% | 6.79% |
| ¥11,500 | 6.14% | 6.46% | 6.82% | 7.11% | 7.43% |
Assumptions are identical to the previous section: 100 rooms; rooms revenue at 85% of total revenue; GOP margin 40%; NOI at 90% of GOP; total project cost ¥2.2 billion (the zero-connection-fee Tokyo 23 wards case). Both ADR and occupancy are modelling ranges, not a forecast for any specific property. The base case is Ichigo Hotel REIT’s July 2026 full-portfolio result: occupancy 84.4% (as of July 2026, full portfolio, N=27 properties), ADR ¥9,684.
Sources: Ichigo Hotel REIT, “Monthly Operating Results (July 2026)”; MetroEngines Research & Consulting
The bottom-left of the grid (ADR ¥8,500, occupancy 76.0% — the lower bound of the modelling range as of August 2026, full-year average basis) gives 4.54%; the top-right (ADR ¥11,500, occupancy 92.0% — the upper bound of the modelling range as of August 2026, full-year average basis) gives 7.43%. The swing reaches 290 bp. Since the connection fee effect seen in the previous section was at most about 3 bp, market-side variation moves yield by roughly two orders of magnitude more.
What this contrast shows is not that connection fees can be ignored. It shows that connection fees belong to a different decision layer. ADR and occupancy are variables moved by operations after opening, and in advance they can only be set as ranges. Connection fees and beneficiary contributions, by contrast, are among the few up-front line items whose amount is fixed by ordinance the moment a site is chosen, readable to the yen at the comparison stage. Debating only the wide-range variables while leaving the readable ones unread inverts the proper order of a feasibility study.
There are two practical implications. First, ranking sites by the size of the connection fee is poor practice. The demand-generating power of a location that moves yield by 290 bp is not offset by an initial cost worth 3 bp. Second, when candidates are level on locational merit, the connection fee is a clear tiebreaker. Across a multi-property pipeline in particular, as seen above, it accumulates into a gap of some ¥50 million over ten properties.
Building this into site acquisition decisions and credit review
On that basis, here are the practical points to observe when treating initial infrastructure cost as a location evaluation axis.
| Role | Issues to check |
|---|---|
| Developer (site acquisition decision) | For each candidate site, check the connection fee by meter diameter in that municipality’s water supply ordinance. Estimating from a regional market rate does not work. Show alongside it the fee difference from moving the schematic-design diameter one step, so the choice of supply method rests on a monetary basis. On large sites, also check the sewerage beneficiary contribution rate and contribution district. |
| Fund (up-front cost review) | Place connection fees and beneficiary contributions in the up-front cost table, not the operating-expense table. Because water and sewer contributions can be treated as intangible depreciable assets amortized over 15 years, keep them separate from amounts capitalized into land. Given that ordinances make paid amounts non-refundable, mark the payment timing explicitly on the schedule for projects carrying design-change risk. |
| Regional bank (review of regional projects) | Check that the business plan’s up-front costs include connection fees and beneficiary contributions. An omission surfaces as an additional funding requirement before completion. Because high-fee municipalities exist outside the designated cities and major metros — Kizugawa (75 mm: ¥4,752,000) and Sapporo (¥4,950,000 at the same diameter) — the assumption that “regional means cheap” does not hold. |
Source: MetroEngines Research & Consulting
Conclusion
The water supply connection fee, payable as a lump sum before a hotel opens, ranges at a 75 mm meter from ¥0 in Tokyo’s 23 wards to ¥5,115,000 in Yokohama, with a 2.94x spread even among the municipalities that levy it. At 100 mm, Sapporo’s ¥10,120,000 against Atami’s ¥3,542,000 is a 2.86x spread. Sewerage beneficiary contribution rates likewise span 4.9x, from ¥144/m² to ¥700/m². Total initial infrastructure cost for a 100-room hotel with a 75 mm meter on a 2,000 m² site ranges from ¥0 to roughly ¥6.52 million, or ¥0 to ¥65,210 per room.
For a single property the impact on NOI yield stays within 0.7 to 2.6 bp, and on its own it rarely overturns an investment decision. But on three counts — it leaves as non-refundable cash before opening with zero revenue; it accumulates into tens of millions of yen across a multi-property rollout; and under the National Tax Agency’s treatment it is expensed against taxable income as an intangible depreciable asset over 15 years — it is a line item that belongs, correctly placed, in the up-front cost table of the business plan.
The most practical implication is that the level of a connection fee cannot be estimated from a regional market rate. Within the same Tokyo metropolitan area, the 23 wards are at zero and Yokohama at ¥5.11 million. Within the same Kyoto–Osaka–Kobe region, Osaka City is ¥2.53 million, Kyoto City ¥3.28 million and Kizugawa ¥4.75 million. The moment an administrative boundary is crossed, the figure changes discontinuously. When comparing candidate sites, go to the ordinance of the specific municipality. That is the only reliable method.
Related reading
References and sources
■ Data sources
Water supply connection fees and contributions were recorded as of August 2026 from the actual amounts by meter diameter (tax-inclusive) published in the water supply ordinances and fee schedules of 10 major municipalities: Yokohama, Sapporo, Kyoto City, Fukuoka City, Osaka City, Naha, Atami, Inazawa, Kizugawa and Tokyo. Sewerage beneficiary contributions use the published unit rates (¥/m²) of Matsudo, Sapporo, Odawara, Kumamoto and Odate. Accounting and tax treatment follows National Tax Agency Tax Answer No.5463. Market ADR is the estimated settled ADR compiled by MetroEngines Research & Consulting (by prefecture, July 2025 to July 2026; the number of properties covered is shown on each row). Operating metrics are from the monthly operating results published by Ichigo Hotel REIT (July 2026).
■ Modelling assumptions
The base case is a 100-room limited-service hotel with a 75 mm meter on a 2,000 m² site. The water service installation work fee applies Atami’s 75 mm fee (¥6,000, tax-exempt) across all cases. Yield estimates assume rooms revenue at 85% of total revenue, a GOP margin of 40%, NOI at 90% of GOP and total project cost of ¥2.2 billion. The base case ADR of ¥9,684 and occupancy of 84.4% (as of July 2026, full portfolio, N=27 properties) are Ichigo Hotel REIT’s published results. The two-axis sensitivity spans ADR ¥8,500–11,500 × occupancy 76.0–92.0% (modelling range as of August 2026, full-year average basis), calculated against the same ¥2.2 billion total project cost. The 80% occupancy used to size water demand (a modelling assumption as of August 2026, full-year average basis) is not an actual result for any specific period.
■ Limitations and caveats
Connection fee amounts vary not only with meter diameter but with supply method, use classification and whether an existing service line is present; the amounts by diameter given here are the ordinance levels assuming a standard new application. The actual charge is settled in prior consultation with the utility. The total-cost estimates are synthetic cases combining published rates from real municipalities and do not represent the actual total for any single municipality. They exclude actual service-line construction costs, in-building piping costs and receiving-tank equipment costs. The yield estimates use a simplified single-property model that does not incorporate interest during the development period, taxes, or repair and replacement costs; an investment decision requires a project-specific feasibility study. Estimated settled ADR is derived from publicly available OTA information and does not match actual transacted rates.
■ Municipal connection fee and rate schedules
- Yokohama City Waterworks Bureau, “Water service connection fees and fees relating to water service installation work”
- Sapporo City Waterworks Bureau, “Payments relating to water service installation work”
- Kyoto City Waterworks Bureau, “About connection fees” (Article 24-2, Kyoto City Water Supply Ordinance)
- Fukuoka City Waterworks Bureau, “About the connection fee scheme”
- Osaka City Water Supply Ordinance (Article 33-2, contributions)
- Osaka City Waterworks Bureau, “FAQ — contributions”
- Naha City Water Supply Ordinance (Article 29, connection fees)
- Atami City, “Connection fees, water service installation work fees and development contributions”
- Inazawa City, “How water charges are calculated (new supply contribution)”
- Kizugawa City, “How to apply for water service installation work (connection fees)”
- Tokyo Metropolitan Waterworks Bureau, “Procedures and charges”
■ Sewerage beneficiary contributions
- Matsudo City, “The sewerage beneficiary contribution scheme”
- Sapporo City, “Sewerage beneficiary contributions” (unit rates by contribution district)
- Odawara City, “What is the sewerage beneficiary contribution?”
- Kumamoto City Waterworks and Sewerage Bureau, “Sewerage beneficiary contributions”
- Odate City, “Sewerage beneficiary contributions”
■ Tax and accounting
■ REIT and market data
- Ichigo Hotel REIT (いちごホテルリート投資法人), “Monthly Operating Results (July 2026)”
- MetroEngines Research & Consulting — estimated settled ADR (by prefecture, as of July 2026); REIT ownership master (302 properties)