

Break down the cost structure of a hotel investment and a handful of line items remain that the operator has no discretion over. Property tax, fire insurance, water and sewer, waste disposal — HotelBank has worked through these one by one in its cost-structure series. But one item has not yet been addressed head-on: the capital spending on statutory equipment that the Fire Service Act generates.
Sprinkler systems, automatic fire alarm systems, indoor fire hydrants, evacuation equipment, exit and guide lights. None of these are things an investor decides whether to install. The moment a building crosses certain thresholds of size and floor count, the obligation arises automatically under the Order for Enforcement of the Fire Service Act. And because ryokan and hotels are classified as specified fire-prevention properties (特定防火対象物), any tightening of the standards applies retroactively to existing buildings as well. Structurally, there is almost no escape route of leaving a building in place as grandfathered non-conforming stock.
This article quantifies, from the statutory text and actual measurements from our facility master, at what size this non-discretionary capex kicks in, how much of the national stock falls into the affected band, and how far it moves NOI yield.
How this article differs from earlier pieces
- Our earlier piece “Hotel Capex: ¥130,000–¥620,000 per Room a Year” covered total capital expenditure. This article isolates only the non-discretionary portion that the law itself generates.
- Our earlier piece “Japan’s Pre-1981 Hotel Stock: 236k Rooms” was about structure. This article is about building equipment.
- Our earlier piece on the ¥1.01 million annual gap between flood-risk zones in hotel fire insurance covered insurance premiums. This article covers the equipment investment itself.
- Change-of-use and building-permit issues under the Building Standards Act have been covered in earlier pieces on office-to-hotel conversion. This article stands on the Fire Service Act alone.
Metric Definitions Used in This Article
- ADR (average daily rate): an estimated transaction rate (tax-exclusive equivalent), calculated by applying a segment-specific adjustment factor to the lowest-plan price each property publishes on OTAs (per room, two guests, tax-inclusive). Checked against property-level results disclosed by listed hotel REITs (91 properties, most recent 3 months), the median error is about 7%. These are estimates and differ from each property’s actual transaction prices and accounting figures. Area-level ADR is the median of the properties covered (the level of a typical property in the area).
- OCC (occupancy rate): the share of rooms sold out of total rooms in the area (an estimate based on OTA sales inventory; consistency checks against REIT monthly disclosures confirm accuracy of roughly a few points).
- Non-discretionary capex: in this article, capital expenditure that arises from a statutory installation obligation and that the operator or owner cannot choose to defer. Spending that leaves room for an investment decision, such as interior refreshes or brand conversions, is excluded.
- Population analyzed: of the approximately 168,000 domestic properties tracked by MetroEngines Research, the 27,161 properties and 1,266,578 rooms confirmed as operating (as of September 2026; domestic, open, with a registered room count).
- Where listed prices are mentioned, they are per-room rates for two guests (tax-inclusive).
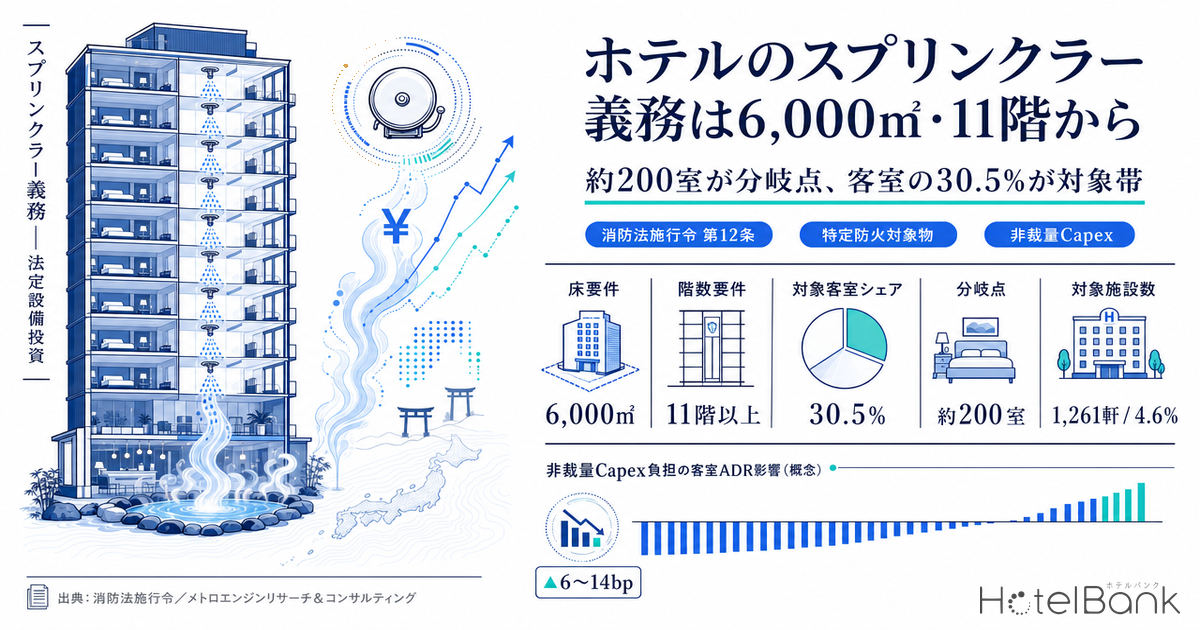
- — The sprinkler obligation arises at 6,000m² or more of total floor area or 11 or more floors excluding basements (Enforcement Order Art. 12(1)(iii) and (iv)). Back-calculated from a median 29.9m² per room, the threshold sits at roughly 200 rooms.
- — Properties with 200+ rooms number just 1,261 (4.6% of the total), yet hold 386,198 rooms, or 30.5% of room stock (N=27,161 properties, 1,266,578 rooms, as of September 2026). The assets traded as investment properties are concentrated in this band.
- — Because ryokan and hotels are specified fire-prevention properties, grandfathering does not apply. Extensions or rebuilds of 1,000m² or half the total floor area, repairs to more than half of the load-bearing walls, and changes of use all trigger retroactive application.
- — Non-discretionary capex over the holding period runs ¥10,000–¥25,000 per room per year (affected band). The impact on NOI yield is 14bp at most — an order of magnitude smaller than property tax at 70bp.
- — What matters is the one-off cost at change of use or major renovation (¥440,000–¥610,000 per room, about ¥105 million for 200 rooms) and the NOI burden, which grows heavier the lower the ADR. The floor-count trigger bites hardest in Aichi, Osaka and Tokyo; the floor-area trigger in Okinawa.
Three Lines Drawn by the Enforcement Order — Floor Area, Floor Count and Per-Floor Area
First, pin down the statutory text. Ryokan and hotels fall under Item (5)(a) of Appended Table 1 of the Order for Enforcement of the Fire Service Act: “ryokan, hotels, lodging houses and similar facilities”. This classification is the gateway to every installation obligation discussed below.
The installation standards for sprinkler systems are in Article 12(1) of the same Order. Three items apply to Item (5)(a), and each draws a different line.
| Provision | Requirement | Scope |
|---|---|---|
| Art. 12(1)(iii) | 11 or more floors excluding basements | Entire building (excluding parts specified by MIC ordinance) |
| Art. 12(1)(iv) | Buildings other than single-storey, where the total floor area of parts other than those specified by MIC ordinance is 6,000m² or more | Entire building |
| Art. 12(1)(xi)(a) | Any floor from the 4th to the 10th with floor area of 1,500m² or more / basement or windowless floors of 1,000m² or more | That floor only |
There are three key points in reading this. First, a building of 11 or more floors is covered in its entirety regardless of floor area (item iii). Second, even at 10 floors or fewer, exceeding 6,000m² brings the whole building into scope (item iv). Third, even if neither applies, any individual floor between the 4th and 10th that exceeds 1,500m² is covered on that floor alone (item xi(a)). In other words, three kinds of lines — vertical, floor area and per-floor — run simultaneously, and crossing any one of them triggers the obligation.
Strictly speaking, the item (iv) requirement is not “total floor area” but “the total floor area of parts other than those specified by MIC (Ministry of Internal Affairs and Communications) ordinance”. In practice the figure is close to total floor area, but some parts, such as machine rooms, are excluded by ordinance and need to be checked case by case.
Automatic fire alarm systems have no floor-area threshold
Whereas sprinklers are triggered by size, automatic fire alarm systems have no floor-area line at all. Article 21(1)(i)(a) of the Order lists Item (5)(a) outright, so every such property must install one regardless of total floor area.
This stems from an amendment that took effect on April 1, 2015. Before then the requirement applied from 300m² of total floor area, but standards for properties used for sleeping were tightened and the floor-area threshold was removed. Existing properties were given a transitional period until March 31, 2018, which has now expired. However, a relaxation coexists: properties under 300m² of total floor area may install a specified small-facility automatic fire alarm system (including wireless interlinked types) in place of a standard system. This relaxed band makes a large difference to the cost level of small properties, discussed below.
The other main installation obligations relevant to Item (5)(a) are summarized below.
| Equipment | Provision | Requirement for Item (5)(a) |
|---|---|---|
| Automatic fire alarm system | Art. 21(1)(i)(a) | No floor-area threshold (all properties). Under 300m², a specified small-facility system is permitted |
| Indoor fire hydrant system | Art. 11(1)(ii) | 700m² or more of total floor area. Tripled to 2,100m² or more where load-bearing elements are fire-resistant and interiors use flame-retardant materials (Art. 11(2)) |
| Evacuation equipment | Art. 25(1)(ii) | Floors at the 2nd storey or above, or basements, with a capacity of 30 or more persons (10 or more depending on the use of the floor below) |
| Exit lights and corridor guide lights | Art. 26(1)(i) and (ii) | Entire building (excluding those specified by MIC ordinance as easy to evacuate) |
Specified Fire-Prevention Properties — Why Grandfathering Does Not Apply
From a capex standpoint, the decisive point is that ryokan and hotels are specified fire-prevention properties.
Article 17-2-5(1) of the Fire Service Act provides that when standards are revised, the new standards are not applied to existing buildings. This is what is generally called grandfathering (existing non-conforming status). However, paragraph 2, item iv of the same article lists exceptions to this principle, explicitly naming “department stores, ryokan, hospitals, underground shopping centers, mixed-use properties (limited to those specified by Cabinet Order) and other … properties specified by Cabinet Order as being entered and exited by large numbers of people (hereinafter ‘specified fire-prevention properties’)”.
In other words, for hotels and ryokan, when fire protection equipment standards are revised, they apply retroactively to existing buildings too. A revision that offices or apartment buildings could leave unaddressed cannot be left unaddressed at a lodging property. This is the legal basis for calling the spending “non-discretionary”.
Four triggers for retroactive application
Beyond the revision of standards itself, Cabinet Order specifies other events that trigger retroactive application. In practice, the following four are the ones to know.
| Trigger | Basis | Details |
|---|---|---|
| Revision of standards | Act Art. 17-2-5(2)(iv) | Because hotels and ryokan are specified fire-prevention properties, revised standards also apply to existing buildings |
| Extensions or rebuilds above a certain size | Order Art. 34-2 | Where the combined floor area of extensions or rebuilds after the reference date reaches 1,000m² or more, or half or more of the total floor area at the reference date |
| Major repairs or remodeling | Order Art. 34-3 | Repairs or remodeling of more than half of the walls that are load-bearing elements |
| Change of use | Act Art. 17-3(2)(iv) | Where the new use is a specified fire-prevention property (conversion from offices etc. to a hotel qualifies) |
Of these, the one with the greatest bearing on investment decisions is Order Article 34-2. When planning a major renovation, once the floor area of extensions or rebuilds reaches 1,000m² or half of the existing total floor area, the fire protection equipment must be brought up to current standards at that point. It tends to bite in this sequence: as value-add capex accumulates, the project unintentionally crosses this line and additional equipment investment follows. There is real practical value in checking these two figures at the earliest stage of a renovation plan.
Change of use (Act Art. 17-3(2)(iv)) works the same way. When converting an office or warehouse to a hotel, the new use is a specified fire-prevention property, so the fire protection equipment must be brought to current standards without exception. This operates independently, as a separate decision axis from whether a building permit application is required under the Building Standards Act.
Not Uniform Nationwide — Municipal Fire Prevention Ordinances Add Requirements
So far these are the Cabinet Order standards. However, Article 17(2) of the Fire Service Act provides: “Where a municipality finds that, owing to the particular climate or natural features of the locality, the purpose of fire prevention cannot be adequately achieved solely by the provisions of the Cabinet Order on technical standards for fire protection equipment under the preceding paragraph or orders based on it, it may, by ordinance, establish provisions on such technical standards that differ from those provisions.”
In practice, local governments do set such additional provisions in their fire prevention ordinances. In the Tokyo Metropolitan Fire Prevention Ordinance, Chapter 5 (Articles 35–47) is devoted to “additions to technical standards for fire protection equipment”, with Article 39 setting additional standards for sprinkler systems and Article 41 for automatic fire alarm systems. For example, Article 39(1)(iv) adds a floor-area requirement not found in the Cabinet Order for basement and windowless floors of mixed-use properties, and Article 41(4) extends the areas where detectors must be installed in some small mixed-use properties with specified uses. The pattern of local add-ons feeding directly into investment cost is not unique to fire protection; the same structure appears in hotel parking requirements, where the number of spaces required varies by up to 2.5x between cities.
Implications for investment decisions: the figures in this article are the nationwide baseline set by Cabinet Order. Actual equipment spending can come in higher depending on the fire prevention ordinance (supplementary ordinance) of the municipality where the property is located. In a portfolio spanning multiple areas, hotels of the same size and floor count may require different equipment depending on their municipality. Confirmation with the local fire department should be built into the due diligence stage.
How Many Rooms Is 6,000m²? — Working Back from Floor Area per Room
The statute is written in floor area, but hotel investors work in room counts. So we back-calculate roughly how many rooms 6,000m² corresponds to, using floor area per room.
From building-plan data derived from the Ministry of Land, Infrastructure, Transport and Tourism (MLIT) Building Construction Statistics, we extracted plans whose sole principal use is hotel or ryokan (excluding mixed use) and calculated total floor area ÷ number of rooms. The median across N=1,358 plans is 29.9m² per room (first quartile 21.3m², third quartile 42.5m²). Narrowing by completion year, the 730 plans completed in 2020 or later have a median of 32.0m² per room, and the 83 completed in 2023 or later 37.6m² — a clear trend toward larger floor area per room in recent years. The 35.0m² used in our earlier piece on hotel construction cost of ¥20.67 million per room is consistent with this more recent level.
Dividing 6,000m² by these figures puts the threshold at about 170 rooms (35.0m² per room) to about 200 rooms (29.9m² per room).
Because back-calculation depends on its assumptions, however, it is worth confirming with direct measurement. Counting, for the same plan data, the share of plans in each room-count band that had 6,000m² or more of total floor area gives the following.
At 150–199 rooms the share is just 29% (N=272), whereas at 200–299 rooms it passes the majority at 59% (N=308). At 300 rooms or more it reaches 91% (N=149). The 50% line is crossed at around 200 rooms, matching the back-calculation from floor area per room (about 200 rooms).
This article therefore sets the band that may fall under the sprinkler floor-area requirement at “roughly 170–200 rooms and above”, using 200 rooms as the central value. That said, this is only a median-based guide. Full-service properties with generous common areas or banquet halls can exceed 6,000m² with just over 100 rooms, while limited-service properties with minimal common areas can stay below it even at 250 rooms. Individual properties must always be assessed on their actual floor area.
Stock Above and Below the Threshold — 4.6% of Properties Hold 30.5% of Rooms
How, then, is the national stock distributed above and below this threshold? Of the approximately 168,000 domestic properties tracked by MetroEngines Research, we broke down the 27,161 properties and 1,266,578 rooms confirmed as operating and with known room counts by room-count band.
| Room-count band | Properties | Property share | Rooms | Room share | Sprinkler floor-area requirement |
|---|---|---|---|---|---|
| 1–19 rooms | 14,791 | 54.5% | 122,052 | 9.6% | Almost never applies |
| 20–49 rooms | 5,404 | 19.9% | 168,102 | 13.3% | Almost never applies |
| 50–99 rooms | 3,032 | 11.2% | 216,058 | 17.1% | Applies to some |
| 100–149 rooms | 1,660 | 6.1% | 201,302 | 15.9% | Applies to some |
| 150–199 rooms | 1,013 | 3.7% | 172,866 | 13.6% | Borderline band |
| 200–299 rooms | 859 | 3.2% | 202,092 | 16.0% | Likely applies |
| 300–499 rooms | 295 | 1.1% | 108,534 | 8.6% | Almost always applies |
| 500+ rooms | 107 | 0.4% | 75,572 | 6.0% | Almost always applies |
The structure is clear. Properties with 200+ rooms number 1,261, just 4.6% of the total, yet hold 386,198 rooms, or 30.5%. Widening to 170+ rooms gives 1,747 properties (6.4%) and 475,780 rooms (37.6%). A band that is a small minority by property count controls 30–40% of the market by room count — that is the asymmetry.
For investors this asymmetry matters. Hotels traded as investment assets skew toward larger properties, so on a portfolio basis the share in the sprinkler-affected band is far higher than the 4.6% seen on a property-count basis. It is safe to assume that the larger the investment per building, the more certain it is that this non-discretionary capex arises.
The other end of the spectrum is also worth a look. There are 9,055 properties (33.3%) and 44,709 rooms with fewer than 10 rooms. At around 30m² per room, many of them fit under 300m² of total floor area and may qualify for the relaxed band for automatic fire alarms (specified small-facility systems, including wireless interlinked types). In this band the equipment unit cost itself is a notch lower. When considering the acquisition of small ryokan or guesthouses, it is worth recognizing that the statutory equipment burden is qualitatively different from that of large hotels.
Where the Floor-Count Trigger Bites — Structure by Area
So far we have looked at the floor-area line. The other line, the vertical requirement of “11 or more floors excluding basements”, bites in concentrated fashion in urban areas where land prices are high and permitted floor area is used up vertically. Because floor-count data are not available for the existing stock, we check the structure using building-plan data (3,104 plans for which both floor count and total floor area are known).
Nationwide, 1,238 plans (39.9%) have 11 or more above-ground floors, 595 (19.2%) have 6,000m² or more of total floor area, and 1,476 (47.6%) meet at least one of the two. In other words, on a plan basis about half are subject to the sprinkler obligation.
The vertical requirement bites hardest in Aichi (65.3%, N=75), Osaka (60.6%, N=444), Ishikawa (55.8%, N=43), Chiba (51.6%, N=64) and Tokyo (50.5%, N=1,165). In areas where the norm is development that uses high permitted floor-area ratios vertically on narrow sites near stations, whole-building sprinklers become mandatory on floor count alone, even if floor area does not reach 6,000m².
The contrast is Kyoto, where just 1.1% of plans (N=562) have 11 or more above-ground floors. Height limits under the city’s landscape policy are in effect, so the vertical requirement is almost never triggered. On the other hand, 21.2% have 6,000m² or more of floor area, so in Kyoto only the floor-area requirement bites.
Okinawa is an even sharper contrast: only 21.6% have 11 or more floors, yet 68.6% (N=51) have 6,000m² or more of floor area — the highest in the country. Development centers on low-rise resorts that spread horizontally, so projects escape on floor count but are reliably caught on floor area. “Markets where the vertical trigger bites” and “markets where the floor-area trigger bites” are clearly distinct.
Markets where the vertical trigger bites
Aichi, Osaka, Tokyo, Chiba. Station-front development using high floor-area ratios vertically is the norm, and the 11-floor requirement triggers on its own. Covered even with small floor area.
Markets where the floor-area trigger bites
Okinawa (11+ floors 21.6% / 6,000m²+ 68.6%). Low-rise, horizontal resort development. Avoidable on floor count, but reliably covered on floor area.
Markets where only floor area bites
Kyoto (11+ floors 1.1% / 6,000m²+ 21.2%). Height limits mean the vertical requirement almost never triggers; only larger projects are covered.
Where the existing stock is concentrated
On the existing-stock side too, the share of each prefecture’s rooms held by properties with 200+ rooms — our proxy for the floor-area requirement — shows similar regional differences.
The top prefectures are Chiba 51.7%, Osaka 50.7%, Tokyo 47.3% and Fukuoka 41.3%. Chiba ranks first largely because of its cluster of large resort hotels. At the bottom are Yamanashi 6.6%, Nagano 7.0%, Wakayama 7.3% and Fukui 9.2%, where small ryokan and pensions account for most rooms. The gap between top and bottom is 7.8x.
This means that a fund whose main arena is regional hot-spring towns and highland resorts and a fund assembling urban limited-service hotels face structurally different non-discretionary capex burdens across their portfolios as a whole. This difference is worth factoring in when setting area strategy.
Assumptions — Full Disclosure of Unit Costs, Floor Area per Room and Replacement Cycles
From here we estimate capex levels per room. However, construction unit costs for fire protection equipment vary widely with building structure, the condition of existing piping and construction difficulty, and no published statistics exist for the hotel industry. Below, we therefore clearly distinguish sourced figures from assumed figures and present everything as ranges. We do not assert single-point unit costs.
| Item | Value used | Classification | Basis / notes |
|---|---|---|---|
| Floor area per room | 30m² per room (range 25–35m²) | Measured | Median 29.9m² across N=1,358 building plans. 32.0m² for completions in 2020 or later, 37.6m² for 2023 or later |
| Sprinkler installation unit cost | ¥17,500/m² | Public benchmark unit cost | Subsidy benchmark unit cost for the sprinkler installation program for clinics with inpatient beds, under the grant guidelines for medical facility improvement subsidies (¥17,500 from FY2015 onward; ¥17,000 in FY2014). This is a benchmark for medical facilities, not a hotel-specific unit cost. Used as an analogous reference value |
| Sprinkler replacement cycle | Heads 15–20 years / piping 20–30 years | Industry material | Replacement guidelines published by equipment manufacturers and maintenance providers, assuming proper periodic inspection |
| Fire alarm replacement cycle | Control panel 20 years / heat detectors 15 years / smoke detectors 10 years | Industry material | Replacement guidelines published by equipment manufacturers |
| Sprinkler replacement cost vs. new installation | 30–60% of new-installation equivalent | Assumption | Assumes a combination of head replacement, pump replacement and partial pipe replacement. No published statistics exist, so a wide range is assumed |
| Fire alarm replacement cost | ¥30,000–¥80,000 per room | Assumption | Assumed range including an allocation of detectors, wiring and control panel. No published statistics exist |
| NOI margin | 30% of room revenue | Assumption | A single value chosen for comparability. In reality it varies widely by segment and operating structure |
| Assumed cap rate | 5.0% | Assumption | Calculation premise to visualize the yield impact |
One-off cost of new or retroactive installation
First, the one-off cost of installing sprinklers from scratch. Multiplying the ¥17,500/m² benchmark by floor area per room gives ¥440,000 (25m²) to ¥610,000 (35m²) per room, or about ¥530,000 at the central 30m². For a 200-room property that implies a total of about ¥105 million.
In a new-build hotel this cost is embedded in construction cost and does not appear as a separate investment decision. It emerges as an independent decision in the case of a change of use of an existing building (Act Art. 17-3(2)(iv)) or a major renovation that touches the extension/rebuild requirements of Order Art. 34-2. If you are converting an office building in the 6,000m² class, you should assess feasibility on the premise that roughly ¥100 million is added to the conversion budget. For the full picture including the transaction costs that accumulate at acquisition, see “Hotel Acquisition Costs 7.1%: A 6.5% Gross Yield Becomes 4.65% Net”.
Replacement cost during the holding period (per room per year)
Next, the annualized replacement cost of continuing to hold a property that already has the equipment installed. Building up from the assumption ranges above gives the following levels.
| Band | Annual cost per room | How it is built up |
|---|---|---|
| Sprinkler-affected band (roughly 170–200+ rooms, or 11+ floors) | ¥10,000–¥25,000 | Sprinkler replacement (30–60% of new-installation equivalent, annualized over a 25-year cycle) + fire alarms + guide lights, evacuation equipment and hydrants |
| Non-sprinkler band | ¥3,000–¥9,000 | Fire alarms + guide lights, evacuation equipment and indoor hydrants (where 700m² or more) |
Set against the total capital expenditure shown in our earlier piece on hotel capex of ¥130,000–¥620,000 per room a year, the non-discretionary statutory equipment portion amounts to only a few percent of total capex. In monetary terms it is not large. How far capex across the lodging industry has built up relative to depreciation was covered in our earlier analysis of corporate statistics, which puts it at 1.51x depreciation.
But the nature of this item differs from the others. Interior refreshes and guestroom renovations can be postponed when the market is weak, but statutory equipment replacement and compliance with legal revisions cannot. Even when total capex is being squeezed, this portion remains. It is, so to speak, the item that sets the floor of the budget.
Impact on NOI Yield — Sensitivity Across Three Scenarios
Finally, we estimate how far this non-discretionary capex moves investment returns. For rate levels we use the July 2026 monthly operating results published by listed hotel REITs. Using figures that were actually published as representative values for each segment removes one layer of assumptions.
| Segment | Published results referenced | OCC | ADR | RevPAR |
|---|---|---|---|---|
| Limited-service | Ichigo Hotel REIT (いちごホテルリート投資法人) (entire portfolio, July 2026) | 84.4% | ¥9,684 | ¥8,175 |
| Midscale | Invincible Investment Corporation (インヴィンシブル投資法人) (101 domestic hotels, July 2026) | 86.3% | ¥15,100 | ¥13,039 |
| Upper midscale | Japan Hotel REIT Investment Corporation (ジャパン・ホテル・リート投資法人) (29 hotels with variable rent etc., July 2026) | 83.1% | ¥21,806 | ¥18,119 |
Applying the non-discretionary capex ranges above to annual room revenue for each segment (RevPAR × 365 days) gives the following results.
| Segment | Annual room revenue / room | Assumed NOI / room | Band | % of revenue | % of NOI | Yield impact |
|---|---|---|---|---|---|---|
| Limited-service | ¥2,983,875 | ¥895,162 | Sprinkler band | 0.34–0.84% | 1.1–2.8% | -6 to -14bp |
| Non-affected | 0.10–0.30% | 0.3–1.0% | -2 to -5bp | |||
| Midscale | ¥4,759,235 | ¥1,427,770 | Sprinkler band | 0.21–0.53% | 0.7–1.8% | -4 to -9bp |
| Non-affected | 0.06–0.19% | 0.2–0.6% | -1 to -3bp | |||
| Upper midscale | ¥6,613,435 | ¥1,984,030 | Sprinkler band | 0.15–0.38% | 0.5–1.3% | -3 to -6bp |
| Non-affected | 0.05–0.14% | 0.2–0.5% | -1 to -2bp |
The result is clear. The yield impact is at most 14bp, and it shrinks as the rate tier rises. In the upper midscale segment it stays at 3–6bp even in the affected band. Compared with the 0.7pt (70bp) drag from property tax on holdings — ¥160,000–¥240,000 per room a year, as shown in an earlier HotelBank analysis — it is an order of magnitude smaller.
In short, replacement costs for statutory fire protection equipment are not, on their own, large enough to overturn an investment decision. This should be understood precisely. There is no need to overestimate them.
The impact shows up in other situations. First, the one-off cost that arises at a change of use or major renovation. At ¥440,000–¥610,000 per room, or around ¥100 million for 200 rooms, it can make or break the economics of a conversion project. Second, the lower the rate, the heavier the burden relative to NOI for limited-service hotels. The same absolute amount is 1.1–2.8% of NOI for limited-service versus 0.5–1.3% for upper midscale — about twice as heavy for the lower tier. The lower a market’s ADR, the more carefully statutory equipment replacement should be factored in.
What happens when the assumptions move — sensitivity of cap rate × annual capex
The table above rests on single assumptions of a 5.0% cap rate and a 30% NOI margin. Both are assumed values and in practice vary by deal. So, for limited-service hotels (assumed NOI ¥895,162 per room), where the impact is largest, we lay out the yield impact (bp) on two axes: cap rate and annual capex.
| Annual capex (per room) | cap 4.0% | cap 4.5% | cap 5.0% | cap 5.5% | cap 6.0% |
|---|---|---|---|---|---|
| ¥10,000 | 4.5 | 5.0 | 5.6 | 6.1 | 6.7 |
| ¥17,500 | 7.8 | 8.8 | 9.8 | 10.8 | 11.7 |
| ¥25,000 | 11.2 | 12.6 | 14.0 | 15.4 | 16.8 |
Two things can be read from this. First, even as the cap rate moves from 4.0% to 6.0%, the impact widens by only 1.5x at the same capex level. At the mid-level ¥17,500 per room it stays within 7.8–11.7bp, and the order of magnitude does not change. Second, what matters more than the cap rate is the capex level itself: between ¥10,000 and ¥25,000 the impact differs by 2.5x. If you want to sharpen the assumptions, it is more efficient to invest effort in understanding replacement unit costs and cycles than in the cap rate assumption.
The same holds when moving up the rate tiers. Holding annual capex at the mid-level ¥17,500, the impact across cap rates of 4.0–6.0% is 4.9–7.4bp for midscale and 3.5–5.3bp for upper midscale. Changing the 30% NOI margin assumption has an inversely proportional effect, so at a 25% NOI margin the values in the table rise 1.2x, and at 35% they fall to 0.86x.
How to Build Non-Discretionary Capex into the Model
The key points of this article are summarized below.
| Issue | Conclusion |
|---|---|
| Sprinkler threshold | 6,000m² of total floor area (Order Art. 12(1)(iv)) or 11 or more floors excluding basements (item iii). Roughly 170–200 rooms as a guide. In actual data, 59% of 200–299 room plans exceed 6,000m² |
| Size of the affected stock | Properties with 200+ rooms number just 1,261 (4.6%), but hold 386,198 rooms, or 30.5%. Properties traded as investment assets skew toward this band |
| Automatic fire alarm systems | No floor-area threshold (Order Art. 21(1)(i)(a)). All 27,161 properties are covered. Under 300m², a specified small-facility system suffices |
| Retroactive application | Because hotels and ryokan are specified fire-prevention properties, grandfathering does not apply (Act Art. 17-2-5(2)(iv)). Extensions or rebuilds of 1,000m² or half the total floor area, repairs to more than half of the load-bearing walls, and changes of use are additional triggers |
| Regional differences | The vertical requirement bites hard in Aichi, Osaka and Tokyo, and almost never triggers in Kyoto because of height limits. In Okinawa, 68.6% are caught by the floor-area requirement. Municipal fire prevention ordinances add further requirements |
| Yield impact | At most 14bp on an annual basis. Not large enough on its own to sway an investment decision. What matters is the one-off cost at change of use or major renovation and the NOI burden in lower rate tiers |
Translated into practice, there are three points.
At acquisition: check floor area and floor count first
Assess on actual total floor area and floor count excluding basements, not room count. If either the 6,000m² or 11-floor line is touched, add the current state and replacement history of the sprinklers to the due diligence scope. Also check the supplementary ordinances of the local fire department.
When planning renovations: watch 1,000m² and one-half
Once extensions or rebuilds reach 1,000m² or half of the existing total floor area, fire protection equipment must be brought up to current standards. The same applies to repairs of more than half of the load-bearing walls. It pays to check this at the earliest stage of building a value-add budget.
Budgeting: set an annual floor
Put ¥10,000–¥25,000 per room per year (affected band) into the capex plan as a floor that is not subject to cuts. Even when other capex is squeezed in a weakening market, this portion remains.
Statutory equipment is less an object of investment decisions than a precondition for them. The amounts are not large, but the timing is set by law, and for hotels and ryokan it applies retroactively. That is exactly why it makes sense to give it an explicit line in the model. Adding this “statutory equipment” line to the cost items covered in earlier pieces — water and sewer, electricity and gas, property tax, outsourced cleaning, insurance, waste and capital expenditure — completes the overall picture of the cost structure.
Limitations of this article: (1) Interpretation of the provisions and their applicability to individual properties are determined by the local fire department. This article summarizes general standards and does not assess the legal compliance of any individual property. (2) Because no published statistics on construction unit costs exist for the hotel industry, the estimates rely on an analogy to a public subsidy benchmark unit cost and on assumptions with wide ranges. They differ from actual quotations. (3) Floor area per room is the median of building-plan data and varies widely by property depending on the configuration of common areas. (4) Floor-count data for the existing stock are not available, so the analysis of the vertical requirement is an estimate based on building-plan data. (5) The number of building plans in the most recent years will rise as further permit applications are added, so please treat current figures as lower bounds.
Related Articles
- Japan’s Pre-1981 Hotel Stock: 236k Rooms, 19.1% — Retrofit or Rebuild
- Hotel Water & Sewer Costs Vary 2.1x by Municipality: ¥7.85mn NOI Gap
- Hotel Acquisition Costs 7.1%: A 6.5% Gross Yield Becomes 4.65% Net
References and Sources
■ Laws and regulations (primary sources; statutory text verified)
- Order for Enforcement of the Fire Service Act (Cabinet Order No. 37 of 1961) (in Japanese) — Art. 11 (indoor fire hydrant systems), Art. 12 (sprinkler systems), Art. 21 (automatic fire alarm systems), Art. 25 (evacuation equipment), Art. 26 (guide lights and guide signs), Art. 34-2 (scope of extensions and rebuilds), Art. 34-3 (scope of major repairs and remodeling), Appended Table 1
- Fire Service Act (Act No. 186 of 1948) (in Japanese) — Art. 17 (obligation to install and maintain, and additions by municipal ordinance), Art. 17-2-5 (exemptions = special provisions for existing non-conforming buildings), Art. 17-3 (special provisions for changes of use)
- Tokyo Metropolitan Fire Prevention Ordinance (in Japanese) — Chapter 5 “Additions to technical standards for fire protection equipment” (Arts. 35–47), Art. 39 (sprinkler systems), Art. 41 (automatic fire alarm systems)
■ Government statistics and public materials
- Board of Audit of Japan, “FY2018 Audit Report” (in Japanese) — subsidy benchmark unit cost for the sprinkler installation program for clinics with inpatient beds (¥17,500 per m²; ¥17,000 in FY2014) / grant guidelines for medical facility improvement subsidies
- Ministry of Land, Infrastructure, Transport and Tourism, “Building Construction Statistics” — hotel and ryokan building plans (total floor area, floor count, room count)
- Yokosuka City Fire Department, “Installation standards for fire protection equipment revised from April 1, 2015” (in Japanese) — removal of the floor-area requirement for automatic fire alarm systems, specified small-facility automatic fire alarm systems, transitional measures (until March 31, 2018)
- Fire and Disaster Management Agency, Fire Prevention Division, “Revision of installation standards for specified small-facility automatic fire alarm systems” (August 2023) (in Japanese)
■ REIT and industry materials
- Ichigo Hotel REIT, “Monthly Operating Results” (July 2026) (in Japanese)
- Invincible Investment Corporation, “Monthly Operating Results” (July 2026, 101 domestic hotels) (in Japanese)
- Japan Hotel REIT Investment Corporation, “Monthly Operating Results” (July 2026, 29 hotels with variable rent etc.)
- Panasonic, “Replacement guidelines for automatic fire alarm systems” (in Japanese) — control panels, manual call points and area sounders 20 years; heat detectors 15 years; smoke detectors 10 years
■ Data sources
The provisions were verified directly against the text of the Fire Service Act and its Enforcement Order as primary sources; secondary summaries were not used. The stock analysis breaks down the domestic facility master (27,161 properties and 1,266,578 rooms as of September 2026; domestic properties that are open and have a registered room count) by room-count band and by prefecture. For floor count and total floor area on the new-supply side, building-plan data were used (floor area per room N=1,358 plans; plans with both floor count and total floor area known N=3,104). Representative values by rate tier are quoted directly from the July 2026 monthly operating results published by three listed hotel REITs.
■ Estimation assumptions
Floor area per room 30m² (range 25–35m², measured median 29.9m²); sprinkler installation unit cost ¥17,500/m² (by analogy to the subsidy benchmark unit cost of the sprinkler installation program for clinics with inpatient beds); sprinkler replacement cost at 30–60% of new-installation equivalent, annualized over a 25-year cycle; automatic fire alarm replacement cost ¥30,000–¥80,000 per room; NOI margin 30% of room revenue; cap rate 5.0%. Yield impact (bp) is calculated as “annual capex ÷ (assumed NOI ÷ cap rate)”, with sensitivity shown on two axes: cap rates of 4.0–6.0% and annual capex of ¥10,000–¥25,000. The four classifications — measured values, public benchmark unit costs, industry materials and assumptions — are stated explicitly in the assumptions table in the body.
■ Limitations and caveats
Interpretation of the provisions and their applicability to individual properties are determined by the local fire department. This article summarizes general standards and does not assess the legal compliance of any individual property. No published statistics on construction unit costs for fire protection equipment exist for the hotel industry, so the estimates rely on an analogy to a public subsidy benchmark unit cost and on assumptions with wide ranges. Floor count and total floor area of the existing stock are not available, so the analysis of the vertical requirement is an estimate based on building-plan data. The number of building plans in the most recent years will rise as further permit applications are added, so please treat them as lower bounds. The NOI margin and cap rate are single assumptions chosen for comparability and do not guarantee actual investment returns.
■ Market data
- MetroEngines Research & Consulting — domestic facility master (OTA-listing basis, N=27,161 properties, 1,266,578 rooms, as of September 2026), tabulations by room-count band and by prefecture