

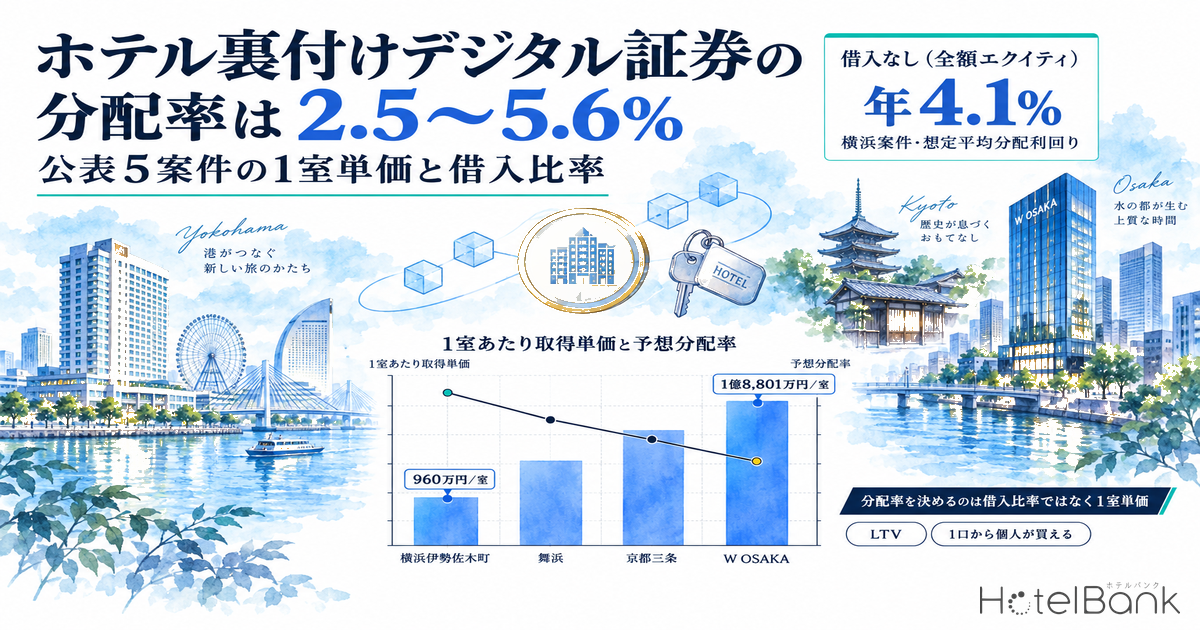
Real estate digital securities backed by hotels (security tokens, hereafter “ST”) are starting to look very different from one deal to the next. A 399-room hotel deal in Yokohama offered in August 2026 was priced at ¥500,000 per unit with an expected average distribution yield of 4.1% per year, and it was structured as an all-equity vehicle that uses no bank borrowing at all. Yet other hotel-backed deals carry forecast distribution rates of 2.5% and of 5.6%.
The asset class is the same, and so is the pitch that individuals can buy in from a few hundred thousand yen per unit. So why do distribution rates vary by more than a factor of two? This article lines up the publicly disclosed hotel-backed ST deals and breaks them down along two axes: capital structure (loan-to-value) and acquisition price per room. Finally, we compare them with the acquisition price per room of the 300 domestic properties held by Japan’s seven listed hotel REITs, to see which price bands of hotel assets STs are actually channeling to individual investors.
Metric Definitions Used in This Article
- Forecast distribution rate / expected average distribution yield: the pre-tax annual distribution as a share of the issue price, as published by each deal’s issuer. The calculation period and method differ by deal, and these figures do not guarantee future distributions. This article is not a recommendation of any individual product.
- LTV (loan-to-value): interest-bearing debt as a share of total assets. We use each deal’s disclosed “interest-bearing debt to total assets” ratio where available. Where no ratio is disclosed, we calculate a reference value from the loan amount and the total issue amount or appraisal value, and say so each time.
- Acquisition price per room: the acquisition price (or appraisal value / asset size) divided by the number of rooms. For deals structured as quasi-co-ownership interests, rooms are converted in proportion to the ownership share.
- ADR (average daily rate): an estimated settled rate (tax-exclusive equivalent), derived by applying a property-type adjustment factor to the lowest published plan level on OTAs and similar channels (2 guests per room, price per room, tax-inclusive). Checked against property-level results disclosed by listed hotel REITs (91 properties, most recent 3 months), the median error is about 7%. These are estimates and differ from each property’s actual transaction prices and accounting figures. Area-level ADR is the median of the properties covered (the level of a typical property in the area).
- Data sources: MetroEngines Research & Consulting; each deal’s public materials and prospectuses; Japan Real Estate Institute
- — Capital structure does not explain the spread in distribution rates — The debt-free Yokohama deal targets 4.1% a year, the Maihama deal at 51.7% LTV pays 5.5%, and the W OSAKA deal at about 56% LTV pays 2.5%. Whether a deal uses leverage does not line up with whether its distribution rate is high or low.
- — What matters is the acquisition price per room — ¥9.6 million per room for Yokohama, ¥72.78 million for Maihama, ¥120.29 million for Kyoto and ¥188.01 million for W OSAKA. The lower the price per room, the higher the gross yield, and the easier it is to support a distribution without leverage.
- — All-equity buys “insulation from interest-rate risk” — Assuming a 4.5% NOI yield and a 2.0% interest rate, equity distribution yield at 60% LTV is 8.25%, far above 4.50% at 0% LTV. But if NOI falls 20% and the refinancing rate rises to 3.5%, the gap narrows to 3.60% vs 3.75%.
- — Retail money is reaching price bands that REITs don’t buy — The median acquisition price per room across the 300 domestic properties of the seven listed hotel REITs is ¥24.41 million. The Yokohama deal’s ¥9.6 million per room sits in the bottom 17.3% (52 properties).
Five Disclosed Deals Side by Side — ¥100,000 to ¥1 Million per Unit, 2.5–5.6% Distribution Rates
First, we list the ST deals that are backed by hotels and were publicly offered in a form ordinary individuals could apply for. The platforms differ, but all use a beneficiary-certificate-issuing trust structure, with beneficial interests managed on a blockchain platform.
| Deal | Underlying hotel (rooms) | Per unit | Forecast distribution | Term | Borrowing / LTV |
|---|---|---|---|---|---|
| Loadstar Group Digital Securities: Yokohama Isezakicho Hotel (ロードスターグループのデジタル証券 横浜伊勢佐木町ホテル) | Chisun Hotel Yokohama Isezakicho (チサン ホテル 横浜伊勢佐木町) (399 rooms) | ¥500,000 | 4.1%/yr (expected average) | Aug 28, 2026 – Aug 31, 2036 (about 10 years; up to about 20 years if extended) | No borrowing (all equity) |
| Hotel Token Yuraku Kyoto Sanjo (transfer-restricted) (ホテルトークン 悠洛・京都三条) | Dhawa Yuraku Kyoto (ダーワ・悠洛 京都) (138 rooms) | ¥1,000,000 | 3.5% | Operations began Mar 12, 2024 | Senior loan ¥7.0 billion + consumption tax loan ¥320 million (floating rate based on JPY TIBOR) |
| Kenedix Realty Token Grand Nikko Tokyo Bay Maihama (transfer-restricted) | Grand Nikko Tokyo Bay Maihama (グランドニッコー東京ベイ 舞浜) (709 rooms; 25% quasi-co-ownership) | ¥1,000,000 | 5.5% | Jun 16, 2023 – Apr 30, 2030 | ¥7.15 billion / LTV 51.7% (period ended Apr 2026) |
| Kenedix Realty Token Grand Nikko Tokyo Bay Maihama-2 (digital registration transfer method) | Same as above | ¥1,000,000 | 5.6% | Feb 26, 2024 – Apr 30, 2030 | ¥6.87 billion / LTV 51.7% (period ended Apr 2026) |
| Kenedix Realty Token W OSAKA (digital registration transfer method) | W OSAKA (337 rooms; 99% quasi-co-ownership) | ¥100,000 | 2.5% | Aug 25, 2025 – Jul 31, 2030 | ¥37.0 billion / LTV approx. 56% (our calculation) |
The spread is not small. The lowest, W OSAKA at 2.5%, and the highest, Maihama-2 at 5.6%, differ by a factor of 2.2. The minimum investment per unit also varies tenfold, from ¥100,000 to ¥1 million, so the early generalization that “an ST means ¥100,000 per unit” no longer holds.
The counterintuitive part is that the Yokohama deal, with no borrowing at all, targets 4.1% a year, which beats both the leveraged Kyoto deal (3.5%) and the W OSAKA deal (2.5%). In textbook terms, when leverage is positive, borrowing should raise the equity yield. The fact that it does not here means the main driver of distribution rates lies outside capital structure.
Acquisition Price per Room Drives Distribution Rates — ¥9.6 Million vs ¥188 Million
Dividing each deal’s acquisition price (or appraisal value / asset size) by its room count separates the deals clearly. For quasi-co-ownership deals, we converted rooms in proportion to the ownership share.
| Underlying hotel | Rooms | Price basis | Per room | Forecast distribution | LTV |
|---|---|---|---|---|---|
| Chisun Hotel Yokohama Isezakicho | 399 | Total offering ¥3.83 billion | ¥9.6M | 4.1% | 0% |
| Grand Nikko Tokyo Bay Maihama | 709 (25% interest = 177 rooms equiv.) | Asset size ¥12.9 billion (25% quasi-co-ownership basis) | ¥72.78M | 5.5–5.6% | 51.7% |
| Dhawa Yuraku Kyoto | 138 | Appraisal value ¥16.6 billion (as of Jan 10, 2024) | ¥120.29M | 3.5% | approx. 42% (our calc.) |
| W OSAKA | 337 | Appraisal value ¥63.36 billion (99% quasi-co-ownership; as of May 1, 2025) | ¥188.01M | 2.5% | approx. 56% (our calc.) |
Ranked by price per room, the Yokohama deal is ¥9.6 million per room while W OSAKA is ¥188.01 million, a 19.6x gap. Distribution rates line up roughly in the reverse order. Because gross yield is “annual rental income ÷ acquisition price,” deals with a lighter cost per room have more room to fund distributions even without leverage.
The Yokohama deal’s underlying asset, Chisun Hotel Yokohama Isezakicho, is a large hotel completed in October 1990, with a gross floor area of 15,674.50㎡ and 18 floors above ground plus 2 below. According to the IR of originator Loadstar Capital, the company raised its ownership stake in stages from 2016, changed the operator, carried out large-scale repairs and renovated guest rooms to add value before structuring this deal. It reads as a deal that fractionalizes existing stock whose upgrade work is already done, while keeping its low acquisition cost.
By contrast, the W OSAKA and Kyoto deals are both newer luxury / lifestyle properties. W OSAKA is a 30-story building completed in October 2020 with 33,369.54㎡ of gross floor area; Dhawa Yuraku Kyoto was completed in January 2019 with 6,271.73㎡. Their asset values are high, so their gross yields are thinner. Investors receive lower distribution rates, but put the other way, these are deals whose prices already reflect expectations of capital gains.
What Does “All Equity” Buy? — Sensitivity at 0%, 50% and 60% LTV
The Yokohama deal’s press release states plainly why it uses no borrowing: “In light of recent interest-rate trends, we did not borrow from financial institutions at the structuring stage and adopted a scheme that acquires the real estate trust beneficial interest solely with funds raised from investors (all equity). This makes cash flow less susceptible to changes in borrowing rates even in a rising-rate environment” (Loadstar Capital release, July 16, 2026; our translation).
So how much yield is traded away for that “less susceptible”? Holding the property price constant, we estimate how equity distribution yield changes as NOI yield and borrowing rate move.
■ Model Assumptions
- Property price fixed at 100. Equity distribution yield = (NOI yield − LTV × borrowing rate) ÷ (1 − LTV)
- Base NOI yield 4.5%: set to the expected yield for limited-service hotels (Kyoto 4.5%, Osaka 4.5%) in the Japan Real Estate Institute’s “54th Japanese Real Estate Investor Survey” (as of April 2026). For reference, the same survey’s limited-service hotel yields are Tokyo 4.1%, Sapporo 5.0%, Sendai 5.3%, Nagoya 4.9%, Fukuoka 4.7% and Naha 5.0%; Yokohama is not among the surveyed areas
- Borrowing rate 2.0% as the base case; 3.5% in the refinancing scenario
- A simplified model that ignores principal repayment, management fees, taxes and distributions in excess of earnings arising from depreciation
| Scenario | LTV 0% (all equity) | LTV 50% | LTV 60% | LTV 60% − LTV 0% |
|---|---|---|---|---|
| 1. Base: NOI yield 4.5%, rate 2.0% | 4.50% | 7.00% | 8.25% | +3.75pt |
| 2. NOI down 20% (3.6%), rate 2.0% | 3.60% | 5.20% | 6.00% | +2.40pt |
| 3. NOI yield 4.5%, refinancing rate 3.5% | 4.50% | 5.50% | 6.00% | +1.50pt |
| 4. NOI down 20%, refinancing rate 3.5% | 3.60% | 3.70% | 3.75% | +0.15pt |
In the base scenario, equity distribution yield at 60% LTV is 8.25%, 3.75 points above 4.50% at 0% LTV. Choosing not to use leverage means giving up those 3.75 points in normal times.
In scenario 4, however, where both stresses hit at once, 0% LTV yields 3.60% and 60% LTV yields 3.75%, a gap of only 0.15 points. Borrowing barely pays off. In general, equity distribution yield flips against LTV once the NOI yield falls below the borrowing rate. With the refinancing rate at 3.5%, the benefit of leverage disappears once NOI yield falls 22.2% below the 4.5% base case.
The Kyoto deal’s loan carries a floating rate based on JPY TIBOR, with a scheduled senior loan repayment date of May 31, 2029 (final maturity May 31, 2032). This shows the issue is not abstract. The prospectus also explicitly names the risk that “an increase in the refinancing interest rate or in refinancing costs” could affect “the trust’s earnings.” For hotel ST deals with terms of 10 to 15 years, at least one refinancing will come during the term.
In other words, what the all-equity vehicle buys is “independence from mid-term interest-rate scenarios,” in exchange for the extra yield leverage would provide in normal times. We read the design philosophy as offering individual investors, who cannot predict the rate path over a 10-year term, a narrower range of distribution outcomes.
Compared with REIT Acquisition Prices per Room — Median ¥24.41 Million; Yokohama Sits in the Bottom 17.3%
Whether an ST deal’s price per room is high or low can’t be judged in isolation. As a benchmark, we use the acquisition prices of properties held by the seven listed hotel REITs. In our ownership master (as of September 14, 2026), the seven REITs hold 302 properties with total acquisition price of ¥1.8401 trillion and 52,352 rooms. Excluding 2 overseas properties, we analyzed the 300 domestic properties (total acquisition price ¥1.8042 trillion; 52,337 rooms).
| Metric | Acquisition price per room | Note |
|---|---|---|
| First quartile (bottom 25%) | ¥12.17M | Mainly budget to economy |
| Median | ¥24.41M | Middle of the 300 domestic properties |
| Third quartile (top 25%) | ¥41.02M | Mainly full-service |
| Weighted average (total price ÷ total rooms) | ¥34.47M | ¥1.8042 trillion ÷ 52,337 rooms |
Overlaying the ST deals on this distribution makes their positions clear. The Yokohama deal’s ¥9.6 million per room sits right next to the band of REIT properties under ¥10 million per room (54 properties, 18.0%): it would rank 52nd from the bottom, at the 17.3rd percentile. That is a relatively thin price band in listed REIT portfolios.
Meanwhile, only 8 of the 300 REIT properties (2.7%) exceed the Kyoto deal’s ¥120.29 million per room, and just 2 exceed W OSAKA’s ¥188.01 million. Assets in an ultra-high price band that is very rare even in listed REIT portfolios are being allocated to individuals in units of ¥100,000 or ¥1 million.
To sum up, hotel-backed STs are stretching toward both ends at once: the cheap band that REITs don’t buy, and the expensive band that even REITs hold only a handful of. Compared with listed REIT portfolios, which are concentrated around the ¥24.41 million median, STs are smaller vehicles and so tend to swing toward the extremes of the price range.
Locations of the Four Deals and Estimated Settled ADR by Area
Plotting the underlying assets on a map shows that all of them sit close to a major terminal station or a theme park. Circle size shows room count, and color shows the price-per-room band.
| Naka Ward, Yokohama | ¥11,156 N=51 properties |
| Kanagawa (all types) | ¥14,478 N=578 properties |
| Kyoto (all types) | ¥13,099 N=605 properties |
| Osaka (all types) | ¥9,058 N=653 properties |
| Chiba (all types) | ¥10,778 N=422 properties |
| Tokyo | 4.1% |
| Kyoto | 4.5% |
| Osaka | 4.5% |
| Fukuoka | 4.7% |
| Nagoya | 4.9% |
| Sapporo / Naha | 5.0% |
| Sendai | 5.3% |
The estimated settled ADR for Naka Ward, Yokohama was ¥11,156 in August 2026 (N=51 properties). Assuming 80% occupancy (full-year; a modeling assumption), annual room revenue per room comes to about ¥3.26 million, and the Yokohama deal’s ¥9.6 million raised per room is about 2.9 times that. It is a rough gauge that uses room revenue alone as the denominator, but it gives one yardstick for where the low price per room comes from.
Kanagawa’s estimated settled ADR was ¥14,478 in August 2026, 7.5% below ¥15,648 a year earlier. Peaks such as ¥15,574 in November 2025 and ¥15,286 in April 2026 remain, so the overall level has not collapsed. For a vehicle designed to run for a decade, what matters is not month-to-month moves but whether the acquisition price per room is low enough to keep paying distributions within this range of swings.
Practical Implications — How to View STs as an Exit Vehicle
Asset managers and private funds
An ST is a vehicle for fractionalizing assets “too small for a REIT,” and at the same time a vehicle for allocating ultra-high-priced assets that are rare even in REITs. Which end your pipeline leans toward changes both the difficulty of structuring and the expected distribution rate completely. In practice, it makes sense to fix the acquisition price per room first and then work back to the distribution rate.
Securities firms and ST product teams
Minimum investment units range tenfold, from ¥100,000 to ¥1 million. Designing the investor base and designing the distribution rate are not independent. The all-equity model gives up extra yield in normal times, but in return removes the need to explain refinancing during the term. For products with terms over 10 years, that difference in explanation cost is not small.
Hotel owners considering an exit
Whether your property could be an ST candidate depends on the expected acquisition price per room, not the room count. The median for REIT-held properties is ¥24.41 million. Properties far below or far above that level may fit an ST vehicle better than a listed REIT.
One more vehicle-level issue is liquidity. Among the deals covered here, those designated as transfer-restricted offer limited opportunities to sell during the term. For deals with terms over 10 years, this becomes a real risk factor. Several deals also give the issuer an option to extend the term, so investors should assume the redemption date is not fixed. For a broader comparison of fractional vehicles, see our article comparing listed REITs, private funds and STs by minimum investment and disclosure frequency.
Scope of this article: The forecast distribution rates, expected average distribution yields, appraisal values and asset sizes in this article are all figures stated in each deal’s public materials and do not guarantee future distributions. Because the calculation period and method differ by deal, simple comparisons across deals have limits. This article is not intended to recommend or solicit any individual product; it examines the structure of these vehicles as funding tools. Before making any investment decision, please review each deal’s prospectus and pre-contract disclosure documents.
Related Reading
- Own a Hotel from ¥100,000 — Security Tokens Open a Third Funding Route
- Hotel Acquisition Costs 7.1%: A 6.5% Gross Yield Becomes 4.65% Net
References and Sources
■ Data Sources
Estimated settled ADR (area median) is an estimate derived by applying a property-type adjustment factor to the lowest published plan level of each property (2 guests per room, per room, tax-inclusive); checked against property-level results disclosed by listed hotel REITs, the median error is about 7% (tax-exclusive equivalent). Property data for the seven listed hotel REITs come from an ownership master built from each REIT’s published property list (as of September 14, 2026; 302 properties, of which 300 domestic with 52,337 rooms). Issue terms, borrowing terms and appraisal values for each ST deal are as stated in each deal’s public materials and prospectus. Expected yields for limited-service hotels are from the Japan Real Estate Institute’s “54th Japanese Real Estate Investor Survey” (as of April 2026).
■ Model Assumptions
Equity distribution yield = (NOI yield − LTV × borrowing rate) ÷ (1 − LTV). Property price is fixed at 100, with a base NOI yield of 4.5% (the survey’s limited-service hotel level for Kyoto and Osaka) and a borrowing rate of 2.0% (3.5% in the refinancing scenario). Acquisition price per room is the acquisition price, appraisal value or asset size divided by room count; for quasi-co-ownership deals, rooms are converted in proportion to the ownership share. The annual room revenue per room gauge is estimated settled ADR × 365 days × 80% occupancy (full-year; a modeling assumption).
■ Limitations
Forecast distribution rates and expected average distribution yields are pre-tax figures published by each issuer; calculation periods and methods differ by deal, so simple comparisons across deals have limits. The price basis is also inconsistent (total offering, asset size or appraisal value). REIT acquisition prices are prices at the time of acquisition, and acquisition years range from the 1980s to the present. The sensitivity model is a simplified calculation that ignores principal repayment, management fees, taxes and distributions in excess of earnings from depreciation. Estimated settled ADR is an estimate and differs from each property’s actual transaction prices and accounting figures. This article is not intended to recommend or solicit any individual product.
■ Market Data
- MetroEngines Research & Consulting — estimated settled ADR (area median); ownership master of the seven listed hotel REITs (as of September 14, 2026; 302 properties)
■ ST Deal Disclosures (Japanese)
- Loadstar Capital K.K., “Notice Regarding the First Real Estate Digital Securities Offering under the New Management Structure” (July 16, 2026)
- Loadstar Securities, “Loadstar Group Digital Securities: Yokohama Isezakicho Hotel” fund information
- Resona Bank, Limited / Kyoto Yuraku G.K., “Prospectus for Beneficial Interest Issuance: Hotel Token Yuraku Kyoto Sanjo (transfer-restricted)” (February 2024)
- Resona Asset Management, “Hotel Token Yuraku Kyoto Sanjo (transfer-restricted)” property overview
- KDX Real Estate Security Token, “Kenedix Realty Token Grand Nikko Tokyo Bay Maihama (transfer-restricted)” fund overview
- KDX Real Estate Security Token, “Kenedix Realty Token Grand Nikko Tokyo Bay Maihama-2 (digital registration transfer method)” fund overview
- KDX Real Estate Security Token, “Kenedix Realty Token W OSAKA (digital registration transfer method)” fund overview
- SBI SECURITIES Co., Ltd., “Kenedix Realty Token W OSAKA (digital registration transfer method)” product summary
- Kenedix, Inc., “Completion of 6th Real Estate STO Backed by a Tokyo Disney Resort Official Hotel in Maihama, Chiba”
■ Public Statistics and Industry Surveys
■ Property Information