

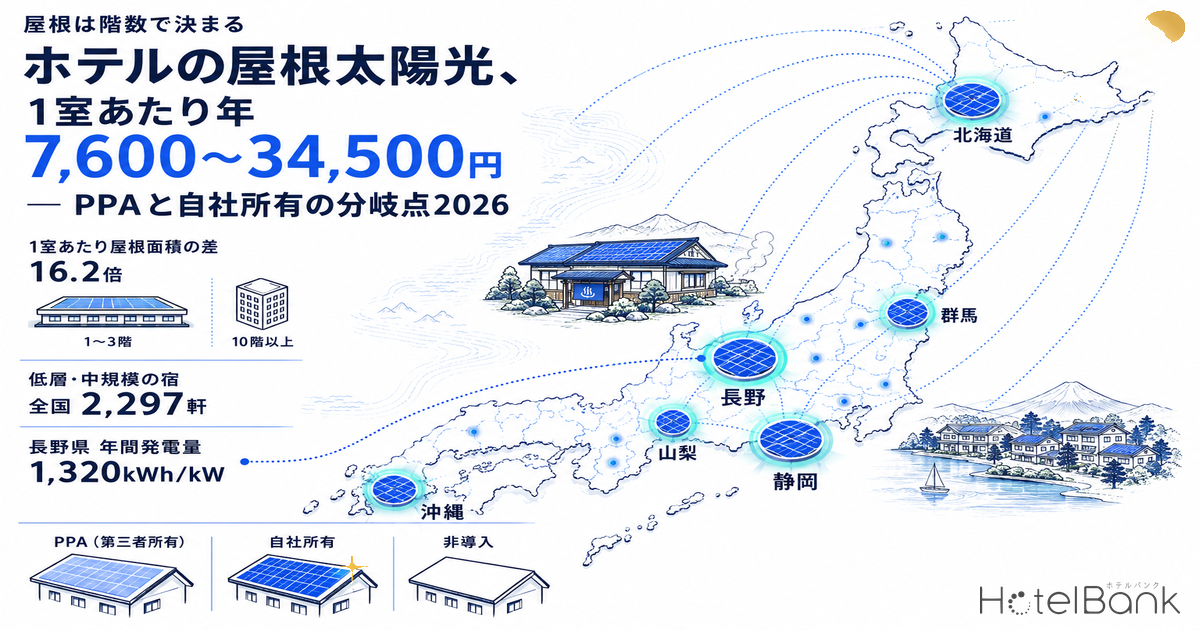
In most hotel investment decisions, the roof is treated as if it does not exist. Under Japan’s FY2026 policy framework, however, installing solar panels on the roof and using the electricity on site (self-consumption) can work as an Opex reduction that directly lowers the volume of purchased power. Because the savings disappear straight out of an expense line, they flow through GOP and stay in NOI. This article estimates how large that residual is, building the calculation up from the physical shape of the building.
The conclusion first. Aggregating 1,029 hotel construction projects in the Ministry of Land, Infrastructure, Transport and Tourism (MLIT) Building Construction Statistics for which floor count and building footprint are known, roof area per guest room (horizontal projection) is 43.8㎡ for 1–3-story buildings versus 2.7㎡ for buildings of 10 stories or more — a 16.2x gap. Whether a roof becomes an asset is determined first not by location or scale but by the number of floors. Counting low-rise, mid-sized properties nationwide yields 2,297 properties and 132,429 rooms. Under standard assumptions, the amount left in NOI falls in a range of ¥7,600–34,500 per room per year, adding +0.05–0.23pt to the cap rate.
How This Article Differs From Our Earlier Coverage
Our earlier coverage of energy efficiency and utility costs falls into two strands. One deals with regulatory compliance costs imposed on new construction; the other with actual Opex levels such as water and sewer charges and electricity bills. This article is neither. It focuses on a single investment decision that existing properties can make today: how to use the roof, and compares only the economics of three options — PPA (third-party ownership), owner-operated installation, and no installation. It is not about regulation, nor about tariff levels.
Metric Definitions Used in This Article
- Roof area: approximated by building footprint (the horizontal projected area of the building). Actual flat roofs carry penthouses, outdoor HVAC units, mounted equipment and maintenance walkways, so the installable area is smaller. This article assumes an installable ratio of 50%.
- Self-consumption rate: the share of generated electricity consumed within the property. The remainder is surplus that is either sold to the grid or curtailed.
- Avoidable unit cost: the cost of grid electricity that no longer has to be paid for each kWh self-consumed. It is the sum of the energy charge and the renewable energy surcharge, and in principle excludes the basic charge (the fixed charge for contracted capacity).
- NOI contribution (pt): annual Opex savings divided by the property’s acquisition price, showing how many percentage points are added to the cap rate (NOI yield).
- Data sources: MLIT Building Construction Statistics; MetroEngines Research & Consulting (property master); Agency for Natural Resources and Energy; Ministry of the Environment
*All monetary figures in this article are estimates based on stated assumptions and do not guarantee the actual savings or payback of any individual property. All assumptions are disclosed in the tables.
- — 16.2x — Roof area per room is 43.8㎡ for 1–3-story buildings versus 2.7㎡ for 10+ stories. Whether a roof becomes an asset is decided almost entirely by floor count, not location or scale (N=1,029 projects).
- — ¥7,590–34,519 per room per year stays in NOI. At an acquisition price of ¥15 million per room, that adds +0.05–0.23pt to the cap rate — equivalent to ¥15–69 million of asset value per property at a 5.0% cap rate.
- — Net benefit under PPA is roughly half that of ownership. A PPA keeps only the ¥9/kWh spread between the ¥24.0 avoidable unit cost and the ¥15.0 PPA rate. But it requires zero upfront investment and still secures ¥2,566 per room per year even in the worst case.
- — Owner-installed payback ranges from 6.3 to 41.0 years, determined by four assumptions — avoidable unit cost, self-consumption rate, system cost and solar irradiance — of which only system cost and self-consumption rate are within the owner’s control.
- — The deciding factors are holding period and remaining life of the roof waterproofing. PPA terms of 15–20 years do not mesh with 12–15-year waterproofing renewal cycles; if either is short, leasing out the roof rather than owning the system is the rational choice.
FY2026 Policy: Rooftop Solar Moves to the “Prioritized” Side
First, the policy landscape. There are broadly three ways to put solar panels on a roof.
| Model | Equipment owner | Upfront investment | Payment by hotel | Typical contract term |
|---|---|---|---|---|
| PPA (third-party ownership) | Power producer | None | Volume-based charge for electricity used | 10–20 years |
| Lease | Leasing company | None | Fixed lease fee regardless of output | 10–15 years |
| Owner-installed | Hotel (owner) | Required | None (O&M costs only) | — (capitalized) |
Source: Compiled by MetroEngines Research & Consulting from Ministry of the Environment, “Guide to Installing Solar Power Equipment Under Third-Party Ownership Models Such as PPA”
The difference between PPA and leasing lies in the payment structure. A PPA is a volume-based charge linked to output, so months with little generation cost little. A lease is a fixed fee, so the better a site’s irradiance, the lower its effective cost per kWh. Both are typically structured to allow off-balance-sheet accounting, and share the advantage of moving only Opex without committing equity. Owner installation, by contrast, requires upfront investment but captures the full savings. The purpose of this article is to assemble the numbers needed to decide which of these three options fits a given roof.
Next is the regulatory treatment of self-consumed power. Under the amended Energy Conservation Act that took effect in April 2023, non-fossil energy became reportable alongside fossil energy, and electricity generated by owner-held solar equipment and consumed on site is recorded in periodic reports as non-fossil energy use, converted to crude-oil equivalent. Under the greenhouse gas accounting of the Act on Promotion of Global Warming Countermeasures, energy-related CO₂ emissions also fall in proportion to the reduction in grid purchases. In other words, self-consumption simultaneously generates Opex savings and reductions in statutory reporting. For properties held for investors who require ESG reporting, this double effect becomes part of the valuation.
On procurement prices, the FY2026 FIT/FIP scheme clearly separates categories for commercial solar. The rooftop category benefits from an upfront investment support scheme: for 10kW and above, ¥19/kWh in years 1–5 and ¥8.3/kWh in years 6–20 (20-year procurement period, subject to requirements including a self-consumption rate of at least 30%). Ground-mounted systems, by contrast, receive lower rates of ¥9.9/kWh for 10kW to under 50kW and ¥9.6/kWh for 50kW to under 250kW. Moreover, deliberation materials from the Agency for Natural Resources and Energy in July 2026 set out a policy of excluding ground-mounted systems from new support from FY2027 onward, while concentrating support on forms that coexist with local communities, such as rooftop installations. Policy is moving in the roof’s favor.
One more number matters for calculating savings. The FY2026 renewable energy surcharge is ¥4.18/kWh (meter readings from May 2026 to April 2027), exceeding ¥4 for the first time. Self-consumed electricity is not subject to this surcharge, so any increase in the surcharge directly raises the value of self-consumption.
Is There Enough Roof? Roof Area per Room Varies 16.2x by Floor Count
Even with supportive policy, there is no point without area to install on. This is the first hurdle in the investment decision. From MLIT’s Building Construction Statistics, we extracted 1,029 construction projects whose primary use is hotel and for which floor count, building footprint and room count are all available, and aggregated building footprint per room (an approximation of the roof’s horizontal projected area) by floor-count band.
| Floors | Projects | Median rooms | Median footprint | Roof area per room | Installable capacity per 100 rooms |
|---|---|---|---|---|---|
| 1–3 floors | 18 | 63 rooms | 1,836㎡ | 43.8㎡ | 219.0kW |
| 4–5 floors | 37 | 49 rooms | 1,190㎡ | 18.6㎡ | 93.0kW |
| 6–9 floors | 204 | 114 rooms | 506㎡ | 4.2㎡ | 21.0kW |
| 10+ floors | 770 | 189 rooms | 482㎡ | 2.7㎡ | 13.5kW |
Source: Compiled by MetroEngines Research & Consulting from MLIT Building Construction Statistics (N=1,029 projects; only projects with building footprint, total floor area and room count all available). Installable capacity is an estimate assuming a 50% installable ratio and a power density of 10㎡/kW. The 1–3-floor band contains only 18 projects, so 43.8㎡ and the ¥34,519 per room figure discussed below depend on this thin sample. It can be read as a band median, but should be treated with a margin when used as a representative value for an individual property.
Source: Compiled by MetroEngines Research & Consulting from MLIT Building Construction Statistics (N=1,029 projects)
For urban hotels of 10 stories or more, installable capacity is only about 13.5kW per 100 rooms — the equivalent of three or four households. This is not a matter of management attitude but a geometric consequence of stacking guest rooms vertically. For urban limited-service hotels, the roof is unlikely to be an investment target. A 1–3-story building, by contrast, offers 219kW per 100 rooms — a 16x difference.
We therefore counted, nationwide, the population of properties most likely to be able to use their roofs. From the properties tracked by MetroEngines Research whose operation could be confirmed, we narrowed down to property types that are typically low-rise (ryokan, resort hotels, pensions, minshuku, auberges, lodges, cottages and vacation rentals) in the mid-size band of 30–150 rooms, yielding 2,297 properties and 132,429 rooms nationwide. Applying 18.6㎡ per room (the 4–5-floor median, a conservative choice) gives a horizontal roof area of about 2.46 million ㎡, equivalent to about 123MW of installation potential at a 50% installable ratio and 10㎡/kW power density.
A note on how to read this figure: Floor count is not recorded in the master data for existing properties, so property type is used as a proxy for low-rise construction. The figure above is therefore a population “likely to be low-rise,” not one whose floor counts were verified property by property. We also cannot distinguish properties that have already installed solar, so 123MW should be read not as the amount of unused roof, but as an upper bound on roofs that could be eligible. The roof area approximation is also a horizontal projection based on building footprint, and actual conditions — pitched roofs, penthouses, equipment space — vary by property.
Estimate: A 100-Room Model Keeps ¥7,590 to ¥34,519 per Room per Year in NOI
Now to convert this into money. All assumptions are disclosed in the table below.
| Assumption | Value used | Rationale |
|---|---|---|
| Roof area per room | 18.6㎡ (4–5 floors) / 43.8㎡ (1–3 floors) | Floor-band medians from MLIT Building Construction Statistics |
| Installable ratio | 50% of roof area | Deduction for penthouses, outdoor HVAC units, maintenance walkways and setbacks |
| Power density | 10㎡/kW | Typical practice for tilted racking on flat roofs (east-west low-tilt layouts can raise density to 7–8㎡/kW) |
| Annual generation | 1,209kWh/kW (national average) | National average of prefecture-level estimates based on the NEDO solar irradiance database |
| Self-consumption rate | 75% (sensitivity: 60 / 75 / 90%) | As discussed below, generation covers only 10–20% of annual consumption, making a high self-consumption rate readily achievable |
| Avoidable unit cost | ¥24.0/kWh (sensitivity: ±20% = ¥19.2 / ¥28.8) | High-voltage average unit price of ¥22.78/kWh (as of May 2026, excluding tax and surcharge), less the basic-charge component, plus the ¥4.18/kWh renewable energy surcharge |
| PPA rate | ¥15.0/kWh | Midpoint of the ¥12–18/kWh market range for on-site PPAs |
| System cost (owner-installed) | ¥226,000/kW | FY2024 average per-kW cost for commercial rooftop systems (Procurement Price Calculation Committee materials) |
| O&M cost (owner-installed) | ¥6,000/kW per year | Assumption covering inspection, cleaning and insurance, plus a reserve for inverter replacement |
Source: Compiled by MetroEngines Research & Consulting from MLIT, Agency for Natural Resources and Energy, NEDO solar irradiance database, and average electricity unit prices published by Shin-Denryoku Net
We set up two patterns for a 100-room low-rise hotel.
| Item | A: 4–5 stories | B: 1–3 stories |
|---|---|---|
| Roof area (horizontal projection) | 1,860㎡ | 4,380㎡ |
| Installable area | 930㎡ | 2,190㎡ |
| Installed capacity | 93.0kW | 219.0kW |
| Annual generation | 112,437kWh | 264,771kWh |
| Of which self-consumed (75%) | 84,328kWh | 198,578kWh |
| Property’s annual electricity use (est.) | approx. 1.04 million kWh | approx. 1.37 million kWh |
| Generation as share of use | 10.8% | 19.3% |
| PPA: annual NOI contribution | ¥758,950 | ¥1,787,204 |
| Per room | ¥7,590 | ¥17,872 |
| Owner-installed: annual NOI contribution | ¥1,465,866 | ¥3,451,878 |
| Per room | ¥14,659 | ¥34,519 |
| Owner-installed: upfront investment | ¥21,018,000 | ¥49,494,000 |
| Owner-installed: simple payback | 14.3 years | 14.3 years |
Source: MetroEngines Research & Consulting estimates (assumptions as in the table above). The property’s annual electricity use was estimated from the accommodation-sector electricity spend per unit of floor area (¥4,110/㎡ per year) in the Agency for Natural Resources and Energy’s Energy Consumption Statistics, converted as “total floor area × ¥4,110/㎡ per year ÷ avoidable unit cost of ¥24.0/kWh.” The floor area implied by this consumption is about 6,100㎡ for A (about 61㎡ per room) and about 8,000㎡ for B (about 80㎡ per room). For properties with different actual floor areas, the generation share and self-consumption assumptions will change.
Source: MetroEngines Research & Consulting estimates
Three points stand out. First, the roof can cover only 10–20% of the property’s electricity use. Solar is not a measure that eliminates power costs — which is precisely why surplus is rare and the self-consumption rate stays high. Second, the amount left in NOI differs by roughly 2x between PPA and ownership, because a PPA leaves only the ¥9/kWh spread between the ¥24 avoidable unit cost and the ¥15 PPA rate. Third, simple payback for owner installation is constant regardless of building size. Payback is determined solely by per-kW economics, so it is the same for 100 rooms or 300. Scale affects the absolute amount, not investment efficiency.
Assuming an acquisition price of ¥15 million per room, the cap rate rises by +0.051pt under PPA and +0.098pt under ownership (+0.119pt / +0.230pt for 1–3 stories). For regional properties acquired at ¥10 million per room, the contribution is larger still: +0.076pt under PPA and +0.147pt under ownership. On its own this is not large enough to overturn an investment decision, but capitalized at a 5.0% cap rate it equals ¥15–69 million of asset value per property. In discussions of exit pricing that take the distribution of cap rates into account, it is not a margin that can be ignored.
Regional Differences: Irradiance Moves Savings by Up to 22% — and Okinawa Is Not at the Top
Annual generation varies by region. In prefecture-level estimates based on NEDO’s solar irradiance database, top-ranked Miyazaki produces 1,335kWh/kW per year and bottom-ranked Akita 1,095kWh/kW per year, a difference of 21.9%. Note that the sunniest prefecture is not Okinawa. Okinawa, at 1,240kWh/kW per year, ranks only 16th nationally. Because of annual rainfall, humidity and panel temperature rise, low latitude does not translate directly into generation. The top ranks are held by Miyazaki and Kochi, along with high-elevation inland areas such as Yamanashi and Nagano.
| Prefecture | Low-rise, mid-sized properties | Rooms | Installation potential (kW) | Annual generation (kWh/kW) | PPA per room (¥) | Owner-installed per room (¥) |
|---|---|---|---|---|---|---|
| Nagano | 217 | 11,848 | 11,019 | 1,320 | 8,286 | 16,517 |
| Shizuoka | 169 | 9,607 | 8,935 | 1,280 | 8,035 | 15,847 |
| Hokkaido | 148 | 9,038 | 8,405 | 1,180 | 7,407 | 14,173 |
| Gunma | 85 | 5,085 | 4,729 | 1,230 | 7,721 | 15,010 |
| Fukushima | 84 | 5,043 | 4,690 | 1,170 | 7,345 | 14,006 |
| Tochigi | 82 | 5,057 | 4,703 | 1,210 | 7,596 | 14,675 |
| Yamanashi | 82 | 5,094 | 4,737 | 1,330 | 8,349 | 16,684 |
| Hyogo | 78 | 4,310 | 4,008 | 1,250 | 7,847 | 15,345 |
| Niigata | 75 | 3,948 | 3,672 | 1,105 | 6,937 | 12,918 |
| Okinawa | 70 | 5,027 | 4,675 | 1,240 | 7,784 | 15,178 |
| Mie | 69 | 3,869 | 3,598 | 1,230 | 7,721 | 15,010 |
| Chiba | 63 | 3,460 | 3,218 | 1,200 | 7,533 | 14,508 |
| Kanagawa | 63 | 3,781 | 3,516 | 1,170 | 7,345 | 14,006 |
| Ishikawa | 60 | 3,891 | 3,619 | 1,135 | 7,125 | 13,420 |
| Yamagata | 57 | 2,848 | 2,649 | 1,110 | 6,968 | 13,001 |
Source: MetroEngines Research & Consulting (property master; operating properties of low-rise types with 30–150 rooms, N=2,297 properties / 132,429 rooms) / prefecture-level estimates based on the NEDO solar irradiance database. Amounts are estimates assuming a 75% self-consumption rate and an avoidable unit cost of ¥24.0/kWh
Source: MetroEngines Research & Consulting (N=2,297 properties) / prefecture-level estimates based on the NEDO solar irradiance database
Here there is a coincidence that matters for investment decisions. Nagano, which has the most low-rise, mid-sized properties (217 properties, 11,848 rooms), also ranks 4th nationally for irradiance (1,320kWh/kW). Shizuoka (169 properties, 1,280kWh/kW) and Yamanashi (82 properties, 1,330kWh/kW) likewise combine roof supply with good irradiance. On the Sea of Japan side, by contrast — Ishikawa (1,135kWh/kW), Niigata (1,105kWh/kW) and Toyama (1,100kWh/kW) — the same equipment yields 14–17% lower savings per room than in Nagano. Reviewing business plans on uniform national assumptions will miss this gap.
Source: MetroEngines Research & Consulting (N=2,297 properties) / prefecture-level estimates based on the NEDO solar irradiance database
Nationwide, the 123MW of potentially eligible roofs would generate about 150.18 million kWh per year, of which about 112.64 million kWh would be consumed on site at a 75% self-consumption rate. In monetary terms, about ¥1.01 billion per year under PPA and about ¥1.96 billion per year under ownership would remain in this population’s NOI. Applying a national average emission factor of 0.43kg-CO₂/kWh, this equates to a reduction of about 48,000 t-CO₂ per year. To repeat, this is an upper bound; the actual potential after excluding properties that have already installed solar is smaller.
Three-Scenario Sensitivity: Ownership Works Only in the “High Unit Cost, High Self-Consumption” Quadrant
Of the assumptions, the two that move results most are avoidable unit cost and self-consumption rate. For the 100-room, 4–5-story (93kW) model, we lay out nine combinations of electricity unit cost ±20% and self-consumption rates of 60/75/90%.
| Self-consumption \ Avoidable unit cost | ¥19.2/kWh (-20%) | ¥24.0/kWh (base) | ¥28.8/kWh (+20%) |
|---|---|---|---|
| 60% | 7,373 / 2,833 Payback 28.5 yrs | 10,611 / 6,072 Payback 19.8 yrs | 13,849 / 9,310 Payback 15.2 yrs |
| 75% | 10,611 / 3,542 Payback 19.8 yrs | 14,659 / 7,590 Payback 14.3 yrs | 18,706 / 11,637 Payback 11.2 yrs |
| 90% | 13,849 / 4,250 Payback 15.2 yrs | 18,706 / 9,107 Payback 11.2 yrs | 23,564 / 13,965 Payback 8.9 yrs |
Each cell shows “annual NOI contribution per room under ownership (¥) / annual NOI contribution per room under PPA (¥)” and the simple payback period for ownership. Source: MetroEngines Research & Consulting estimates (assumptions as in the tables in the text)
Source: MetroEngines Research & Consulting estimates
Simple payback for ownership moves across a 3.2x range, from 8.9 to 28.5 years. With an assumed panel operating life of 20 years, 28.5 years does not work as an investment. At 8.9 years, by contrast, the internal rate of return reaches double digits. The boundary sits at roughly 15-year payback, and only properties with both “a high avoidable unit cost (i.e., high power procurement prices or a heavy surcharge burden)” and “a high self-consumption rate (i.e., heavy daytime operation, so generation is absorbed by consumption)” fall inside it.
The table above, however, moves only two of the assumptions. In practice, two more determine whether ownership works — system cost and irradiance. Moving each on its own shifts the simple payback of the 100-room, 4–5-story (93kW) model as follows.
| Assumption varied | Pessimistic | Base | Optimistic |
|---|---|---|---|
| System cost ¥226,000/kW ±20% | ¥271,000/kW Payback 17.2 yrs | ¥226,000/kW Payback 14.3 yrs | ¥181,000/kW Payback 11.5 yrs |
| Annual generation Actual range across prefectures | 1,095kWh/kW (Akita) ¥12,750/room / payback 16.5 yrs | 1,209kWh/kW (national avg.) ¥14,659/room / payback 14.3 yrs | 1,335kWh/kW (Miyazaki) ¥16,768/room / payback 12.5 yrs |
Source: MetroEngines Research & Consulting estimates (assumptions as in the tables in the text) / irradiance from prefecture-level estimates based on the NEDO solar irradiance database
Moving all four assumptions in the same direction widens the range further. Below, three cases — optimistic, mid and pessimistic — reset avoidable unit cost, self-consumption rate, system cost and irradiance simultaneously.
| Assumption / metric | Pessimistic | Mid (base) | Optimistic |
|---|---|---|---|
| Avoidable unit cost | ¥19.2/kWh | ¥24.0/kWh | ¥28.8/kWh |
| Self-consumption rate | 60% | 75% | 90% |
| System cost | ¥271,000/kW | ¥226,000/kW | ¥181,000/kW |
| Annual generation | 1,095kWh/kW | 1,209kWh/kW | 1,335kWh/kW |
| PPA: per room per year | ¥2,566 | ¥7,590 | ¥15,420 |
| Owner-installed: per room per year | ¥6,151 | ¥14,659 | ¥26,601 |
| Owner-installed: upfront investment | ¥25,221,600 | ¥21,018,000 | ¥16,814,400 |
| Owner-installed: simple payback | 41.0 years | 14.3 years | 6.3 years |
Source: MetroEngines Research & Consulting estimates (assumptions as in the tables in the text). O&M cost of ¥6,000/kW per year is common to all three cases
The pessimistic case’s 41.0-year payback far exceeds the assumed 20-year panel operating life. In other words, ownership fails not at properties with “cheap power,” but at properties where unit cost, self-consumption rate, procurement cost and irradiance are all unfavorable at once. Conversely, the optimistic case’s 6.3 years ranks high in priority even against other Capex. In practice, of these four, only system cost (competitive quotes) and self-consumption rate (operations) are within the owner’s control; unit cost and irradiance are given. The less favorable the givens, the more the decision leans toward leasing the roof via PPA rather than owning.
It is worth touching on the reality of self-consumption rates here. As shown in the previous section, the roof can generate only 10–20% of a property’s annual consumption. Hotels have a thick daytime base load — housekeeping, kitchens, HVAC, circulation pumps for large communal baths — so at this level of generation, a 90% self-consumption rate is a realistic range. Rates fall to 60% at properties whose occupancy is extremely seasonal or that close on certain days. It is also worth checking that, depending on a property’s winter heat-source mix, its daytime electricity demand profile can change significantly.
On the PPA side, even as the values shift, the worst case still secures ¥2,833 per room per year (60% self-consumption, ¥19.2 unit cost). Since upfront investment is zero, this amount is a pure gain. PPA is “small but certain,” ownership is “large but assumption-dependent” — an asymmetric choice.
Investment Decision: Which Roofs to Own and Which to Lease Out
Let us rearrange the estimates in the order an actual decision is made. The decision breaks down into the following questions.
| Question | Conditions favoring ownership | Conditions favoring PPA (leasing out the roof) |
|---|---|---|
| 1. Holding period | Long-term hold of 10+ years; payback fits within the holding period | Sale expected in 3–7 years; exit comes before payback |
| 2. Unit cost and occupancy | High avoidable unit cost and year-round operation supporting ~90% self-consumption (payback within 12 years) | Low unit cost, or strong seasonality making self-consumption unpredictable (payback over 20 years) |
| 3. Roof waterproofing renewal timing | Waterproofing recently renewed, or can be done together with this installation | Little remaining waterproofing life; cost of temporary removal and reinstallation is uncertain |
| 4. Capital allocation | Capex budget has room, and solar can be judged a higher priority than room renovations, etc. | Capex should go first to guest rooms, bathrooms and HVAC replacement |
| 5. Balance sheet | Want the benefits of capitalization and depreciation | Want to stay off balance sheet |
Source: Compiled by MetroEngines Research & Consulting based on Ministry of the Environment, “Guide to Installing Solar Power Equipment Under Third-Party Ownership Models Such as PPA,” and other materials
Question 3, roof waterproofing, is the issue most often overlooked in practice. MLIT’s long-term repair planning guidelines put the renewal cycle for rooftop waterproofing at roughly 12–15 years, with guideline figures of 10–15 years for sheet membranes and 15–20 years for asphalt membranes. A PPA term of 15–20 years and a waterproofing renewal cycle of 12–15 years do not mesh as they stand. If waterproofing work becomes necessary mid-contract, panels must be temporarily removed, stored and reinstalled; unless the contract specifies who bears that cost, it becomes a negotiation. The first step in considering installation is therefore not a solar quote but confirming the remaining life of the waterproofing. If the timing allows both to be done together, shared scaffolding and protection lower the effective investment.
The treatment of exit in Question 1 is equally important. PPA contracts run 10–20 years, and when a property is sold mid-term, the standard structure is for the buyer to assume the contractual position. If assumption fails, the contract is terminated early and payment of the equipment’s residual value may be required. In property due diligence, the PPA contract’s assignment clause, settlement method on termination, and ownership of the equipment after the term ends (free transfer or removal) must always be checked. Conversely, if these are clear, a buyer can value a PPA as “a property with NOI already uplifted, simply by taking over the contract.”
Then there is Question 4, capital allocation. The NOI gain of ¥14,659 per room per year (ownership, base case) needs to be weighed on the same footing as other Capex. Compared with cost items that can be reduced merely by renegotiating contracts or changing operations — such as waste disposal fees or water and sewer charges — solar clears a higher bar because it requires investment. The rational sequence is to capture Opex reductions that need no investment first, and only then turn to the roof. On the other hand, compared with measures that exploit site-specific resources, such as monetizing hot-spring heat, solar rests on simple assumptions and can be rolled out across other properties. For owners holding multiple low-rise properties in a portfolio, it is a measure that lends itself to being designed as a standard specification.
Summary
Whether a hotel’s roof becomes an asset is decided almost entirely by floor count. Roof area per room is 43.8㎡ for 1–3-story buildings and 2.7㎡ for 10 stories or more — a 16.2x gap — leaving little to discuss for high-rise urban properties. Low-rise, mid-sized properties, on the other hand, number 2,297 nationwide with 132,429 rooms; potentially eligible roofs total about 123MW, with annual generation potential of about 150 million kWh.
The amount left in NOI in the 100-room model ranges from ¥7,590 per room per year (4–5 stories, PPA) to ¥34,519 (1–3 stories, ownership). At an acquisition price of ¥15 million per room, that contributes +0.05–0.23pt to the cap rate. However, simple payback for ownership moves from 8.9 to 28.5 years depending on assumptions, and works only in the quadrant where both power unit cost and self-consumption rate are high. When in doubt, the deciding factors are holding period and the remaining life of the roof waterproofing; if either is short, leasing out the roof rather than owning the system is the rational choice.
If new support for ground-mounted systems is curtailed and concentrated on rooftop installations from FY2027 onward, power producers will come looking for roofs. For owners of low-rise properties, this is a phase in which their negotiating position improves. There is ample value in taking stock, across one’s own portfolio, of how much roof remains unused.
Related Articles
References and Sources
■ Data Sources
The distribution of roof area by floor-count band was aggregated from 1,029 construction projects in MLIT’s Building Construction Statistics whose primary use is hotel and for which floor count, building footprint, total floor area and room count are all available. The population size is the 2,297 properties / 132,429 rooms in our property master (about 27,000 properties confirmed as operating) belonging to eight typically low-rise property types (ryokan, resort hotels, pensions, minshuku, auberges, lodges, cottages, vacation rentals) with 30–150 rooms. Irradiance is based on prefecture-level annual generation estimates from the NEDO solar irradiance database (MONSOLA-20); electricity unit prices on the high-voltage average published by Shin-Denryoku Net (as of May 2026); and policy and procurement prices on published materials from the Agency for Natural Resources and Energy and the Ministry of the Environment.
■ Estimation Assumptions
Roof area is approximated by building footprint (horizontal projection), and installed capacity is calculated assuming a 50% installable ratio and 10㎡/kW power density. Annual generation of 1,209kWh/kW (national average); self-consumption rate of 75% (sensitivity 60/75/90%); avoidable unit cost of ¥24.0/kWh (sensitivity ±20%), derived from the ¥22.78/kWh high-voltage average less the basic-charge component plus the ¥4.18/kWh renewable energy surcharge; PPA rate of ¥15.0/kWh; system cost of ¥226,000/kW (sensitivity ±20%); O&M cost of ¥6,000/kW per year. The property’s annual electricity use was converted as “total floor area × ¥4,110/㎡ per year ÷ ¥24.0/kWh,” and NOI contribution (pt) was calculated by dividing annual savings by an acquisition price of ¥15 million per room.
■ Limitations and Caveats
All monetary figures in this article are estimates based on stated assumptions and do not guarantee the actual savings or payback of any individual property. (1) Roof area is approximated by building footprint; actual conditions of penthouses, outdoor HVAC units, maintenance walkways and pitched roofs vary by property. (2) The 1–3-floor band has a thin sample of only 18 projects, so 43.8㎡ and ¥34,519 per room depend on its median. (3) Because floor count is not recorded in the existing property master, property type is used as a proxy for low-rise construction, and the population consists of “properties likely to be low-rise.” (4) Because properties that have already installed solar cannot be distinguished, 123MW is an upper bound on potentially eligible roofs, and unused potential is smaller. (5) Actual self-consumption rates depend on each property’s demand profile, seasonal operation and closure days, and some properties fall outside this article’s 60–90% range. (6) Grid connection feasibility, capacity of receiving equipment and local ordinance constraints require individual confirmation and are not considered here.
■ Market and Property Data
- MetroEngines Research & Consulting — property master (of about 27,000 properties confirmed as operating, 2,297 properties / 132,429 rooms of low-rise types with 30–150 rooms aggregated)
■ Government Statistics and Public Data
- MLIT, Building Construction Statistics (建築物動態統計調査) — floor count, building footprint, total floor area and room count of hotel construction projects (N=1,029)
- Ministry of Economy, Trade and Industry, “Setting FIT/FIP Purchase Prices for FY2026 Onward and the FY2026 Surcharge Rate” (March 19, 2026)
- Agency for Natural Resources and Energy, “Purchase Prices and Periods | FIT/FIP Scheme”
- Agency for Natural Resources and Energy, “Prioritizing FIT/FIP Support for Commercial Solar Power” (July 28, 2026)
- Agency for Natural Resources and Energy, Procurement Price Calculation Committee, “On Solar Power” (per-kW system cost)
- Agency for Natural Resources and Energy, “Periodic Reports and Medium- to Long-Term Plans (Energy Conservation Act)”
- Ministry of the Environment, “Greenhouse Gas Emissions Accounting, Reporting and Disclosure System”
- Ministry of the Environment, “Guide to Installing Solar Power Equipment Under Third-Party Ownership Models Such as PPA” (revised March 2026)
- Agency for Natural Resources and Energy, Energy Consumption Statistics — electricity spend per unit of floor area in the accommodation sector
- Explanation of rooftop waterproofing repair cycles (12–15 years) based on MLIT’s Long-Term Repair Plan Guidelines
■ Irradiance and Electricity Prices