

Coverage of Japan’s listed hotel REITs has largely been written around one question: what did they pay? Acquisition price per room, property count and diversification, unentered prefectures, holding periods — all of these are numbers fixed at the moment of acquisition. This article takes the opposite side and builds around a different question: what are these assets worth now? We collected, property by property, the real estate appraisal values each REIT discloses at period-end, together with the direct capitalization rates (cap rates), DCF discount rates and terminal cap rates underpinning them, from the primary disclosures of seven investment corporations, and aggregated 298 properties.
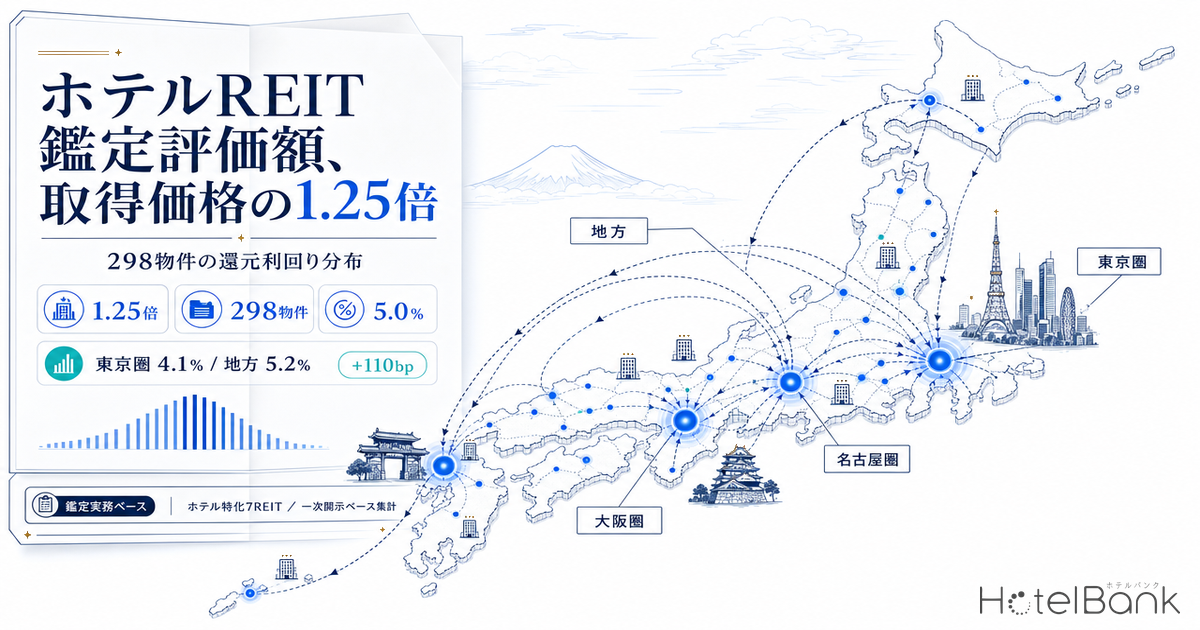
The conclusion first. The seven investment corporations hold 298 domestic hotel properties whose combined period-end appraisal value is ¥2,062,957 million, or 1.250x the combined acquisition price of ¥1,650,381 million — a gap of ¥412,576 million. That multiple is far from uniform across the portfolio, however: it ranges from 1.475x to 1.064x by acquisition year, and from 1.361x to 1.111x by region. And the direct cap rates that drive those valuations still show a median of 4.1% in Greater Tokyo against 5.2% in regional Japan — a spread of roughly 110bp. That 110bp is the most direct indication available of where acquisition headroom still sits.
Metric Definitions Used in This Article
- Period-end appraisal value (period-end calculated value): the value determined by a licensed real estate appraiser as of the fiscal period-end date, in accordance with each investment corporation’s articles of incorporation and the rules of The Investment Trusts Association, Japan. We use the figures stated in each company’s financial results summary or securities report exactly as disclosed.
- Appraisal multiple: period-end appraisal value ÷ acquisition price. This is our own aggregate metric, and its denominator differs from the “unrealized gain” (= appraisal value − balance sheet carrying amount) that each investment corporation discloses. Calculated across the 282 properties for which book value is disclosed, appraisal value ÷ book value is 1.282x.
- Direct capitalization rate (cap rate): the capitalization rate applied under the direct capitalization method within the income approach of the appraisal report. It is a separate concept from the DCF discount rate and the terminal cap rate.
- ADR (average daily rate) = an estimated transacted rate (tax-excluded equivalent) derived by applying a category-specific adjustment coefficient to the lowest published plan level each property lists on OTAs (double occupancy, per-room, tax-included). Cross-checked against property-level actuals disclosed by listed hotel REITs (91 properties, trailing three months), the median error is approximately 7%. These are estimates and differ from each property’s actual transacted rates and accounting figures. Area-level ADR is the median across the target properties (the level of a typical property in that area).
- Data sources: financial results summaries and securities reports of each investment corporation / our REIT ownership master (snapshot as of August 31, 2026) / MetroEngines Research
Appraisal cap rates and investor-survey expected yields are two different things
Before the main analysis, one piece of terminology is worth settling. The “cap rate” so often cited in hotel investment coverage in fact refers to two figures drawn from entirely different populations.
The first is the expected yield from investor surveys. The representative example is the semi-annual “Japanese Real Estate Investor Survey” conducted by the Japan Real Estate Institute (日本不動産研究所). Invincible Investment Corporation’s securities report (45th fiscal period) cites that survey (October 2025), noting that the expected yield for limited-service hotels in Tokyo was 4.2%, flat for a second consecutive period, with only Osaka declining by 0.1 point. That is an aggregation of the levels at which investors say they would buy — not a figure used to value any actual property.
The second is the subject of this article: the direct cap rate actually applied in appraisal practice. This is the rate an appraisal firm applies to a specific property after assessing operating revenue, operating expenses and capital expenditure, and it forms the legal basis for fixing an investment corporation’s period-end valuation. The population here is “real properties actually held,” not survey respondents’ intentions.
The two sit at similar levels, but they mean different things. Among the 138 properties in our sample, the median direct cap rate for properties located in Tokyo was 4.0%, and 4.1% across Greater Tokyo (Tokyo, Kanagawa, Chiba, Saitama). That is marginally below the 4.2% expected yield from the investor survey — appraisal practice is applying a slightly tighter rate than the investor questionnaire suggests. All analysis below uses the latter, appraisal-based figures.
Appraisal multiples across the seven REITs run from 1.096x to 1.365x — portfolio vintage decides the number
Start at the investment corporation level. A higher or lower appraisal multiple is not a ranking of management skill; it almost entirely reflects when, and at what price level, the portfolio was assembled. The more long-held assets a portfolio contains, the more the multiple accumulates, while a recently assembled portfolio starts from a point where acquisition price and appraisal value are close. An investment corporation listed for less than a year sitting in the 1.1x range does not mean its valuations have failed to grow — it means not enough time has passed.
| Investment corporation | Properties | Rooms | Acquisition price (¥ mn) | Period-end appraisal value (¥ mn) | Appraisal multiple | Median direct cap rate | Valuation date |
|---|---|---|---|---|---|---|---|
| Japan Hotel REIT Investment Corporation | 51 | 14,130 | 515,388 | 703,630 | 1.365x | — | Dec 31, 2025 |
| Mori Trust REIT Investment Corporation | 6 | 1,937 | 142,217 | 190,039 | 1.336x | 3.95% | Feb 28, 2026 |
| Ichigo Hotel REIT Investment Corporation | 30 | 4,418 | 73,103 | 90,897 | 1.243x | 4.50% | Jan 31, 2026 |
| Invincible Investment Corporation | 109 | 18,254 | 588,474 | 694,765 | 1.181x | — | Jun 30, 2026 |
| Hoshino Resorts REIT | 71 | 8,667 | 233,906 | 275,674 | 1.179x | 5.40% | Apr 30, 2026 |
| Kasumigaseki Hotel REIT Investment Corporation | 15 | 726 | 49,210 | 55,250 | 1.123x | 4.80% | Jan 31, 2026 |
| Japan Hotel & Residential Investment Corporation | 16 | 1,991 | 48,083 | 52,702 | 1.096x | 5.15% | May 31, 2026 |
| Total / median | 298 | 50,123 | 1,650,381 | 2,062,957 | 1.250x | 5.00% | — |
Source: compiled by MetroEngines Research & Consulting from the financial results summaries and securities reports of each investment corporation (valuation dates as stated in the table). Direct cap rates are medians across the 138 properties disclosed by the five investment corporations that publish property-level rates. Property counts and amounts for Japan Hotel & Residential Investment Corporation cover its 16 hotel properties only, excluding 15 rental residential assets.
Median direct cap rates also differ sharply by investment corporation. Mori Trust REIT, built mainly around large central-Tokyo assets, sits at 3.95%, while portfolios weighted toward regional and smaller properties move into the 5% range. That gap is a difference in location and scale mix, which the following sections break down.
Source: compiled by MetroEngines Research & Consulting from the financial results summaries and securities reports of each investment corporation (N=298 properties)
By acquisition cohort — assets bought before 2015 sit at 1.475x, those from 2023 onward at 1.064x
Grouping appraisal multiples by acquisition year makes the structure plain. We split the 233 properties whose acquisition date could be confirmed from primary disclosure and our ownership master (Hoshino Resorts REIT 64, Ichigo Hotel REIT 29, Japan Hotel & Residential 16, Invincible 109, Kasumigaseki Hotel REIT 15) into four cohorts.
| Acquisition cohort | Properties | Rooms | Acquisition price (¥ mn) | Period-end appraisal value (¥ mn) | Appraisal multiple | Median direct cap rate |
|---|---|---|---|---|---|---|
| Through 2015 | 83 | 10,543 | 200,984 | 296,354 | 1.475x | 5.60% (N=48) |
| 2016–2019 | 74 | 12,785 | 418,872 | 470,711 | 1.124x | 5.10% (N=30) |
| 2020–2022 | 14 | 2,478 | 54,714 | 58,315 | 1.066x | 4.85% (N=12) |
| 2023–2025 | 62 | 7,573 | 301,851 | 321,133 | 1.064x | 4.75% (N=34) |
Source: compiled by MetroEngines Research & Consulting from the financial results summaries and securities reports of each investment corporation and our REIT ownership master (snapshot as of August 31, 2026). The population is the 233 properties whose acquisition date could be confirmed. The 51 properties of Japan Hotel REIT Investment Corporation and the 6 properties of Mori Trust REIT Investment Corporation are excluded from this table because acquisition dates are not available in a consistent disclosure format.
The 83 properties acquired before 2015 carry a combined acquisition price of ¥200,984 million against a period-end appraisal value of ¥296,354 million — 1.475x. Many of these assets were assembled at levels set before accommodation demand recovered in earnest. The 62 properties acquired from 2023 onward, by contrast, sit at just 1.064x. They have been held only briefly, and their acquisition prices already reflected recent appraisal levels — an unsurprising result.
More telling is the cap rate side. Older cohorts carry fatter yields (5.60%), newer ones thinner (4.75%). This is not a story about older properties being inferior. The assets acquired before 2015 are heavily concentrated in the regional and smaller-scale segment, where cap rates in the 5% range are still being applied — meaning the areas where valuations have grown and the areas where yields remain fat are not necessarily the same.
Source: compiled by MetroEngines Research & Consulting from the financial results summaries and securities reports of each investment corporation and our REIT ownership master
By region — Greater Tokyo 4.1%, regional Japan 5.2%. A roughly 110bp cap rate gap remains
Next, cut by location. Using the prefecture of each property, we split the sample into four regions: Greater Tokyo (Tokyo, Kanagawa, Chiba, Saitama), Greater Osaka (Osaka, Kyoto, Hyogo, Nara), Greater Nagoya (Aichi, Gifu, Mie) and regional Japan (everywhere else).
| Region | Properties | Acquisition price (¥ mn) | Period-end appraisal value (¥ mn) | Appraisal multiple | Direct cap rate Q1 / median / Q3 | Rates disclosed |
|---|---|---|---|---|---|---|
| Greater Tokyo | 80 | 537,865 | 731,934 | 1.361x | 3.80% / 4.10% / 4.40% | 18 |
| Greater Osaka | 33 | 271,138 | 329,956 | 1.217x | 4.10% / 4.30% / 4.50% | 15 |
| Greater Nagoya | 20 | 66,908 | 74,358 | 1.111x | 4.80% / 5.00% / 5.30% | 14 |
| Regional Japan | 165 | 774,470 | 926,709 | 1.197x | 4.80% / 5.20% / 5.80% | 91 |
Source: compiled by MetroEngines Research & Consulting from the financial results summaries and securities reports of each investment corporation (N=298 properties, of which 138 disclose direct cap rates)
Greater Tokyo’s 1.361x appraisal multiple is the highest of the four regions, and its 4.10% median cap rate is the tightest. A rising valuation means the same income is being capitalized at a lower rate, so the two are two sides of the same coin.
What deserves attention is regional Japan’s Q3 of 5.80%. One quarter of the 91 regional properties are still valued at direct cap rates of 5.8% or above. The gap to Greater Tokyo’s Q1 of 3.80% reaches 200bp. With the interest rate environment normalizing, that thickness represents clear headroom from an acquisition standpoint.
The sample skew should be stated honestly. Among the five investment corporations that disclose cap rates at the property level, Hoshino Resorts REIT’s 71 properties account for 51% of the 138, and that portfolio is weighted toward regional locations. Re-running the same aggregation on the remaining 67 properties gives Greater Tokyo 4.1%, Greater Osaka 4.2%, Greater Nagoya 4.9% and regional Japan 4.9% — the regional premium narrows from 110bp to 80bp, but its direction is unchanged. The discussion below should be read with that range in mind.
Source: compiled by MetroEngines Research & Consulting from the financial results summaries and securities reports of each investment corporation (N=138 properties)
By room-count band — 4.2% at 300+ rooms, 5.5% at 99 or fewer. Scale is setting the cap rate
The third axis is property scale. We split properties into three bands by room count and ran the same aggregation.
| Room-count band | Properties | Acquisition price (¥ mn) | Period-end appraisal value (¥ mn) | Appraisal multiple | Median direct cap rate | Rates disclosed |
|---|---|---|---|---|---|---|
| Up to 99 rooms | 106 | 218,657 | 277,919 | 1.271x | 5.50% | 66 |
| 100–299 rooms | 153 | 701,047 | 897,548 | 1.280x | 4.70% | 62 |
| 300 rooms and above | 38 | 729,477 | 884,940 | 1.213x | 4.20% | 9 |
Source: compiled by MetroEngines Research & Consulting from the financial results summaries and securities reports of each investment corporation and our REIT ownership master (297 properties with confirmed room counts)
Appraisal multiples land in the 1.2x range across all three bands, with almost no difference between them. Cap rates, however, thin monotonically across a 130bp range: 5.50% at 99 rooms or fewer, 4.70% at 100–299 rooms and 4.20% at 300 rooms and above. The larger the property, the tighter the rate applied — an exceptionally clear pattern. Excluding Hoshino Resorts REIT gives 4.8% / 4.5% / 4.2%, the same direction with the range narrowing to 60bp.
This reads as economies of scale being priced directly into the appraisal. Larger properties carry a lower fixed-cost ratio in operating expenses, tenants (operators) with relatively stronger credit, and more readily available liquidity. Meanwhile, the sub-100-room band contains a concentration of properties still valued at cap rates in the high 5% range. Smaller assets tend to retain fatter yields because the per-deal investment is small and the unit cost of due diligence is relatively heavy — but by the same token, this is where portfolio construction skill can capture excess returns.
Source: compiled by MetroEngines Research & Consulting from the financial results summaries and securities reports of each investment corporation and our REIT ownership master
The cap rate distribution — median 5.0%, top decile at or below 4.1%, bottom decile at or above 5.9%
Arranging the 138 direct cap rates in 0.25-point buckets gives a distribution spanning 3.1 points, from 3.1% to 6.2%, with a median of 5.0%, Q1 of 4.4% and Q3 of 5.6%. The top decile (the tightest end) sits at 4.1% and the bottom decile at 5.9%.
Source: compiled by MetroEngines Research & Consulting from the financial results summaries and securities reports of each investment corporation
The distribution has two peaks, at 4.0–4.25% and 5.0–5.25%. The former corresponds to mid- to large-scale properties in the three major metropolitan areas, the latter to the core of the regional and smaller-scale segment. This bimodality is what the 110bp cited at the outset actually consists of.
Crossing region with scale identifies the segment where cap rates remain fattest. Regional Japan × up to 99 rooms (N=66 properties, 51 with disclosed rates) has a median of 5.60%, 155bp above the 4.05% of Greater Tokyo × 100–299 rooms (N=42, 10 disclosed). From an acquisition standpoint, this is where the yield spread currently remains widest.
TIGHTEST Greater Tokyo × 100–299 rooms
Median cap rate 4.05% (N=42 properties, 10 with disclosed rates). Appraisal multiple 1.305x. Mid-sized central Tokyo assets are the segment where appraisal practice applies the tightest rates.
MIDDLE BAND Greater Osaka × 100–299 rooms
Median cap rate 4.30% (N=18 properties, 9 disclosed). At 1.403x, this segment posted the strongest appraisal growth in our region × scale cross-tabulation.
FATTEST Regional Japan × up to 99 rooms
Median cap rate 5.60% (N=66 properties, 51 disclosed). Appraisal multiple 1.172x. The widest remaining yield spread, and the segment where valuations still have room to catch up.
Where valuations rose, did rates rise too? Cross-checking against operating reality
Appraisal values incorporate a forward view of cash flow. So in the prefectures where valuations rose, did accommodation rates actually rise as well? For the 20 prefectures holding five or more properties, we compared the appraisal multiple against MetroEngines Research’s estimated transacted ADR (two-year change from the H1 2024 average to the H1 2026 average).
Source: compiled by MetroEngines Research & Consulting from the financial results summaries and securities reports of each investment corporation and MetroEngines Research (estimated transacted ADR). The 20 prefectures holding five or more properties.
The correlation coefficient came to +0.29 — a weak positive relationship. That result is itself an important finding. The appraisal multiple is a stock measure reflecting cumulative change since acquisition, and it cannot be explained by a flow measure such as the last two years of ADR movement alone. Multiples accumulate for older acquisitions, so this outcome follows naturally.
Consistent movements are nonetheless visible. Tokyo saw estimated transacted ADR rise 19.0% over two years (H1 2026 average of roughly ¥14,700, N=1,135 properties), and with an appraisal multiple of 1.336x and a median cap rate of 4.00% it sits at the tightest position on both rate and valuation. Fukuoka also aligns in sign, with +20.8% (roughly ¥11,800, N=471 properties) against a 1.306x multiple and a 4.20% cap rate. It is a prefecture where properties with large valuation gains cluster in the major cities of Kyushu, such as Japan Hotel REIT’s Hotel Oriental Express Fukuoka Tenjin (ホテル オリエンタル エクスプレス 福岡天神) and Oriental Hotel Fukuoka Hakata Station (オリエンタルホテル福岡 博多ステーション).
Ishikawa, by contrast, saw estimated transacted ADR fall 10.2% over two years (roughly ¥10,600, N=239 properties) and posted an appraisal multiple of 0.913x — the only one of the 20 prefectures below 1.0x. The prefecture is still recovering from the Noto Peninsula earthquake, and the effects of the Hokuriku Shinkansen extension to Tsuruga have yet to arrive in full. It is best positioned as an area where both rates and valuations still have room to catch up.
Okinawa shows an appraisal multiple of 1.185x against estimated transacted ADR growth of 17.0% (roughly ¥11,700, N=495 properties) — valuations have not yet fully followed the rise in rates. Chiba is the inverse: its 1.486x multiple is the highest of the 20 prefectures, while its two-year ADR change is just +4.6%. Chiba’s high multiple owes much to accumulated long-held assets, including large hotels around Tokyo Disney Resort.
| Prefecture | Properties | Rooms | Acquisition price (¥ mn) | Appraisal multiple | Median cap rate | Estimated transacted ADR H1 2026 average | Two-year change |
|---|
Source: compiled by MetroEngines Research & Consulting from the financial results summaries and securities reports of each investment corporation and MetroEngines Research (estimated transacted ADR). Prefectures holding five or more properties only. Cap rates are medians across disclosed properties only, with the number of disclosures in parentheses.
Mapping 298 properties — shaded by appraisal multiple
Finally, we plotted the 296 properties among the 298 for which coordinates could be identified. Circle size indicates acquisition price and colour indicates the appraisal multiple band. High multiples concentrate in the three major metropolitan areas, while properties above 1.5x are also scattered across major regional cities.
Source: compiled by MetroEngines Research & Consulting from the financial results summaries and securities reports of each investment corporation and our REIT ownership master (snapshot as of August 31, 2026); CartoDB (map tiles)
The 29 properties at 2.0x and above include, for example, Mori Trust REIT’s Hotel Sunroute Plaza Shinjuku (ホテルサンルートプラザ新宿) (624 rooms, ¥32,500 million acquisition price → ¥65,500 million period-end appraisal value), Japan Hotel REIT’s Namba Oriental Hotel (なんばオリエンタルホテル) (267 rooms, ¥15,000 million → ¥33,700 million) and Oriental Hotel Universal City (オリエンタルホテル ユニバーサル・シティ) (330 rooms, ¥6,753 million → ¥22,300 million), and Invincible’s Hotel MyStays Fukuoka Tenjin Minami (ホテルマイステイズ福岡天神南) (177 rooms, ¥1,570 million → ¥8,320 million). All are long-held properties in which demand recovery and revised lease structures have been reflected in valuation.
Methodology and caveats
Population: the 298 domestic hotel properties held by seven listed investment corporations, hotel-focused and diversified alike (Japan Hotel REIT, Invincible, Hoshino Resorts REIT, Mori Trust REIT, Ichigo Hotel REIT, Japan Hotel & Residential, Kasumigaseki Hotel REIT). Starting from our REIT ownership master (snapshot as of August 31, 2026, 302 entries in total), we reconciled property-level acquisition prices and period-end appraisal values against each company’s latest financial results summary or securities report, and excluded the following.
| Exclusion | Count | Reason |
|---|---|---|
| Invincible Investment Corporation’s overseas hotels | 2 | Yen-translated and verified against local appraisals, so not comparable with domestic properties on the same basis |
| Same corporation’s preferred equity securities in a special purpose company | 1 | Preferred equity securities, with no disclosed period-end calculated value |
| Japan Hotel REIT Investment Corporation’s post-period acquisitions | 2 | Not included in disclosure as of the December 2025 period-end |
| Japan Hotel & Residential Investment Corporation’s rental residential assets | 15 | Non-hotel use |
| Mori Trust REIT Investment Corporation’s office and retail assets | 14 | Same as above |
On misaligned valuation dates: because fiscal periods differ by investment corporation, the valuation dates for period-end appraisal values range from December 31, 2025 to June 30, 2026. Market movement over six months can affect multiples. We have not adjusted for this; instead, each company’s valuation date is stated explicitly in the tables and the aggregation is presented on that basis.
The difference between “appraisal multiple” and “unrealized gain”: our appraisal multiple is appraisal value ÷ acquisition price, whereas the “unrealized gain” each investment corporation discloses (appraisal value − balance sheet carrying amount) uses a different denominator. Invincible Investment Corporation, for instance, disclosed in its June 2026 financial results summary a combined appraisal value of ¥848,295 million across the 155 of its 156 properties that carry an appraisal, with unrealized gains of ¥220,421 million. Calculating appraisal value ÷ book value across the 282 properties with disclosed book values gives 1.282x — higher than our 1.250x by the extent of accumulated depreciation.
On room counts: room counts for Kasumigaseki Hotel REIT Investment Corporation were re-sourced from the property-level disclosure in its 1st fiscal period securities report (filed April 28, 2026), because of a known column-misalignment defect in our ownership master (15 properties, 726 rooms in total). The company’s ¥49,210 million total acquisition price is also based on that report.
Scope of direct cap rate disclosure: property-level direct cap rates are disclosed by five investment corporations — Hoshino Resorts REIT 71, Ichigo Hotel REIT 30, Japan Hotel & Residential 16, Kasumigaseki Hotel REIT 15 and Mori Trust REIT 6 — for a total of 138 properties, or 46% of the 298. The remaining two disclose only property-level period-end calculated values. All cap rate aggregations use those 138 properties as their population.
Verification of ownership: for properties named individually in this article, ownership was confirmed via our REIT ownership master. Note that the master covers only the seven investment corporations listed above, which are primarily hotel-focused, so the absence of an entry does not mean a property is not held by another J-REIT.
Summary
Hotel REITs viewed through acquisition price and hotel REITs viewed through appraisal value draw entirely different maps. A portfolio that looks polarized between concentrated and diversified strategies when ranked by price per room turns out, when re-ranked by appraisal multiple, to show that vintage decides nearly everything. The 83 properties from before 2015 sit at 1.475x and the 62 from 2023 onward at 1.064x — a difference that is a function of time, not management skill.
And what matters to the acquisition side is not the multiple but the cap rate behind it. Greater Tokyo 4.10% against regional Japan 5.20%; 4.20% at 300 rooms and above against 5.50% at 99 rooms or fewer; and 5.60% for regional Japan × up to 99 rooms. Now that large assets in the three major metropolitan areas have been valued to the tightest levels, the remaining yield spread sits in smaller and mid-sized regional properties — a structure confirmed by the appraisal practice applied to 138 properties across seven investment corporations.
That said, it is not a segment where rates rise automatically. The correlation between the two-year change in estimated transacted ADR and the appraisal multiple is only +0.29, and in a fair number of prefectures valuation and market reality are not moving in the same direction. A fat cap rate can equally be read as a gap that operating capability is expected to close. For owners of regional hotels considering REIT inclusion as an exit, the cap rate level of the segment their property belongs to is the starting point for working backwards to a valuation.
References and Sources
■ Primary disclosure by investment corporations (property-level acquisition price, period-end appraisal value, direct cap rate)
- Invincible Investment Corporation, “Financial Results Summary for the Fiscal Period Ended June 2026 (REIT)” (August 25, 2026)
- Japan Hotel REIT Investment Corporation, “Financial Results Summary for the Fiscal Period Ended December 2025 (REIT)” (February 25, 2026)
- Hoshino Resorts REIT, “Financial Results Summary for the Fiscal Period Ended April 2026 (REIT)” (June 15, 2026)
- Mori Trust REIT Investment Corporation, “Financial Results Summary for the Fiscal Period Ended February 2026 (REIT)” (April 22, 2026)
- Ichigo Hotel REIT Investment Corporation, “Securities Report, 21st Fiscal Period” (filed April 27, 2026)
- Japan Hotel & Residential Investment Corporation, “Financial Results Summary for the Fiscal Period Ended May 2026 (REIT)” (July 22, 2026)
- Kasumigaseki Hotel REIT Investment Corporation, “Securities Report, 1st Fiscal Period” (filed April 28, 2026)
■ External research referenced
- Japan Real Estate Institute (日本不動産研究所), “Japanese Real Estate Investor Survey” (October 2025) — based on the citation in Invincible Investment Corporation’s securities report, 45th fiscal period
■ Our own data
- MetroEngines Research & Consulting — REIT ownership master (N=302 properties, snapshot as of August 31, 2026)
- MetroEngines Research — estimated transacted ADR (monthly by prefecture, January 2024 to August 2026)