

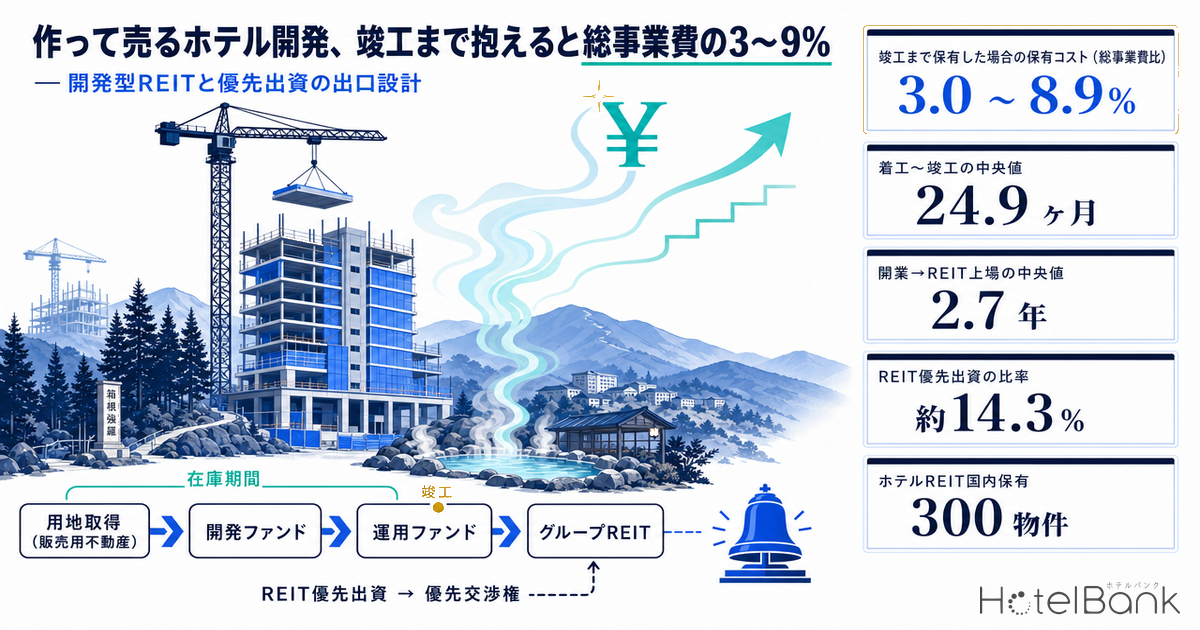
Who funds a hotel development, at which stage, and for how long? Lining up the disclosures published in 2026 reveals two contrasting designs. In the first, the developer acquires the site as real estate for sale (inventory), passes it through a development fund and an operating fund, and prepares an exit all the way to a listed REIT that it sponsors itself. In the second, a diversified REIT takes a preferred equity stake in a development special purpose company (SPC) and obtains a right of first negotiation to buy the hotel after completion. This article reads the two through three lenses — how development risk is allocated, how long capital is tied up, and how the exit is designed — and shows, as a range, the carrying cost of holding a 100-room model hotel through to completion.
First, where this article sits relative to earlier coverage. Our previous analysis of the 26 hotels due for completion in 2027–28 looked at forward-commitment contracts (pre-completion purchase agreements) from the buyer’s side — penalties and handover conditions. Comparisons of development yields against acquisition yields are about the investor’s choice, and tallies of developer types describe the distribution of “who is building.” The subject here is the seller’s balance sheet — the developer’s: the inventory period from site acquisition to sale, and a design that keeps the exit inside the group.
Terms and Metrics Used in This Article
- Real estate for sale: property held for the purpose of sale, booked as inventory rather than as a fixed asset. The “inventory period” in this article is the time from site acquisition until the asset is transferred to an outside party (a fund, a REIT, etc.).
- Preferred equity / right of first negotiation: preferred equity is the class of equity securities issued by a specific purpose company (TMK) under the Act on Securitization of Assets that ranks ahead on dividends and residual assets. A right of first negotiation lets the holder negotiate a purchase of the completed property ahead of others; it carries no obligation to buy.
- REIT Holdings Master: MetroEngines Research & Consulting’s dataset of properties held by the seven listed hotel REITs (acquisition date, acquisition price, room count), compiled from each REIT’s IR disclosures. As of September 14, 2026, 300 domestic properties out of 302 registered are in scope.
- Construction start to completion: months from the (planned) construction start date to the (planned) completion date, from the building-permit-based plan data of the Ministry of Land, Infrastructure, Transport and Tourism (MLIT) Building Dynamics Statistics survey.
- Carrying cost (this article’s estimate): cash outlays only — loan interest + fixed asset tax and city planning tax + management costs. The opportunity cost of equity is excluded.
- Tsubo: Japanese unit of floor area; 1 tsubo = 3.3058 m².
- Data sources: MetroEngines Research & Consulting; company press releases and timely disclosures; MLIT
- — In the model that cycles sites as real estate for sale, the sooner the site moves to a development fund, the shorter the developer’s own capital is tied up. Kasumigaseki Capital describes the flow as: “We acquire the land, plan the project and move it into a development fund. After completion it moves to an operating fund, and ultimately it is incorporated into a long-term REIT” (earnings briefing, April 3, 2026).
- — In the model where the REIT enters development, United Urban Investment Corporation takes about 14.3% of the preferred equity of the Hakone Gora development SPC and gains a right of first negotiation running from completion to the end of September 2031. Its downside is capped at the amount invested.
- — As a result of keeping the exit in-house, the 15 properties of Kasumigaseki Hotel REIT Investment Corporation were incorporated a median 2.7 years (range 0.7–4.8 years) after opening, measured to the REIT’s listing (August 13, 2025) using opening dates in our master data.
- — Holding a 100-room model on the developer’s own books to completion means a holding period of 26.5–49 months and a carrying cost of ¥87M–¥426M (¥0.87M–¥4.26M per room). Transferring at the site stage keeps it to ¥11M–¥62M.
Two Designs — The Developer Owns the Exit, or the REIT Enters Development
The hotel development value chain breaks into stages: site acquisition, planning and permitting, construction, opening and ramp-up, stabilised operation, and long-term ownership. Each stage calls for a different risk appetite and cost of capital, so “risk allocation” — who carries which stage — becomes the difference between business models. The disclosures published in 2026 illustrate two contrasting types.
| Item | Developer owns the exit | REIT invests in a development SPC |
|---|---|---|
| Representative disclosure | Kasumigaseki Capital, “Notice Concerning Acquisition of Two Hotel Development Sites” (July 31, 2026) | United Urban Investment Corporation, “Notice Concerning Acquisition of Domestic Asset” (September 4, 2026) |
| Site owner | The developer (acquired as real estate for sale) | A specific purpose company (acquisition scheduled for September 30, 2026) |
| Funding during development | Transferred to a development fund (per the company) | Senior loan, mezzanine loan, preferred equity |
| REIT involvement | Ultimately incorporated into the listed REIT the developer sponsors | Takes about 14.3% of the preferred equity and a right of first negotiation |
| Certainty of exit | A buyer exists inside the group | A right, not an obligation to buy; price negotiated with reference to actual sales and other factors |
| Price disclosure | Undisclosed under a confidentiality agreement | Investment amounts disclosed (1st tranche ¥166,500,000; 2nd tranche ¥77,300,000) |
The two are not opposing choices. The first is a design in which the developer “builds the exit first” to raise its own asset turnover; the second is one in which a long-term owner “secures the chance to buy a completed property early.” Both pull the timeline forward around the same object — a stabilised property after completion — one from the seller’s side and one from the buyer’s, so structurally they mirror each other.
Cycling Sites as Real Estate for Sale — What the 2026 Disclosures Show
On July 31, 2026, Kasumigaseki Capital announced that it had acquired hotel development sites in two locations: Kisarazu, Chiba Prefecture, and Nippori in Arakawa Ward, Tokyo. The disclosure states that the sites were “acquired as real estate for sale” for the group’s hotel brand for larger groups of guests, that the counterparties and prices are undisclosed under confidentiality agreements, and that the impact on consolidated results for the fiscal year ending August 2026 is minor. Similar disclosures were also made on April 15, 2026 and on June 30, 2026 (Lake Yamanaka, Yamanashi Prefecture), showing that site procurement continues quarter after quarter.
This accounting classification is the starting point of this article. Holding a site as inventory rather than as a fixed asset means operating on the premise that returns are realised through sale, not through ownership itself. At its Q2 briefing for the fiscal year ending August 2026, the company described its business flow as: “We acquire the land, plan the project and move it into a development fund. After completion it moves to an operating fund, and ultimately it is incorporated into a long-term REIT,” and stated that “all projects under development or already open are off balance sheet.” It also explained that, compared with the previous fiscal year-end, real estate for sale on the balance sheet increased by ¥3.1bn and advance payments by ¥7.71bn (according to the logmi Finance transcript).
On the pace of openings, the same briefing said: “At an opening pace of 10 buildings a year, we expect to exceed 50 buildings from 2028 onward.” For the listed REIT it cited “currently 15 properties, with assets of about ¥49.2bn,” and for the REIT pipeline “53 properties with a project scale of ¥311bn.” The company has also disclosed a sale of a development site as real estate for sale in the past (a hotel development site in Shibuya Ward, Tokyo, May 29, 2025). In other words, it keeps the option, project by project, of transferring at the site stage or taking the project to completion within a development fund.
The point of this design is to shorten the period a site sits on the developer’s own balance sheet and redeploy that capital into the next site. The shorter the inventory period, the more projects the same equity can support, and the easier it is to raise the pace of openings. Conversely, if the transfer to a development fund is delayed, the site’s funding cost and property taxes pile up on top of the inventory. The estimate in the second half of this article puts a yen figure on this difference in “when to transfer.”
The REIT Enters Development — Preferred Equity and a Right of First Negotiation in the Hakone Gora SPC
At the opposite pole is the acquisition announced on September 4, 2026 by United Urban Investment Corporation (8960). What it is acquiring is not land or a building but preferred equity securities of the Hakone Kamigora Project specific purpose company. The underlying property is the tentatively named NOWA by RIHGA Hakone Gora. According to the disclosure, the SPC will acquire the planned development site on September 30, 2026, begin developing the hotel at the end of October the same year, and complete it in September 2028. The plan is a reinforced-concrete building with one basement floor and four floors above ground (among other structures), 90 hotel rooms, 9,359.78 m² of land and 10,104.86 m² of floor area. Every room will have an open-air bath, and all rooms will be 50 m² or larger including the terrace.
The hotel will be operated by The Royal Hotel, Limited. The disclosure said the SPC and the operator were scheduled to sign a legally binding pre-contract for a fixed-term building lease on September 7, 2026. The same day, the operator announced that NOWA by RIHGA Hakone Gora will open in December 2028. The REIT’s own disclosed schedule has the hotel operator starting operations at the end of September 2028 and rent accruing to the SPC from January 2029.
The capital structure is disclosed too. Against SPC assets of ¥4,912.2M (mainly the planned development site plus cash and deposits), the planned funding is a senior loan of ¥2,957.9M, a mezzanine loan of ¥116.7M, a consumption tax loan of ¥134.6M, preferred equity of ¥1,703M and specified equity of ¥0.1M. United Urban’s investment is ¥166.5M in the first tranche and ¥77.3M in the second, ¥243.8M in total, equal to about 14.3% of all preferred equity. CREAL Inc. serves as the SPC’s asset manager, and Marubeni Toshi Kaihatsu (丸紅都市開発株式会社) is involved as the project management contractor. Additional preferred equity issues are scheduled for the end of September 2027 and the end of August 2028 to fund construction payments.
The disclosure is clear about how development risk is allocated in this design. If the SPC suffers a downside from development risk (such as the building not being completed) or tenant risk, the REIT may be affected up to the acquisition price of its investment. At the same time, it judges the risks of development delay, change or cancellation, and tenant risk, to be minor, because it invests after permits and the building confirmation certificate have been issued, because of the contractor’s capacity to complete, and because a fixed-term building lease pre-contract is in place. The right of first negotiation runs from the day the SPC takes delivery of the building (expected around September 2028) to the end of September 2031, and the sale price will be agreed through negotiation, taking into account the hotel’s actual sales, financial and economic conditions, and financing terms.
Put another way, for a limited outlay — about 14.3% of the preferred equity — the REIT holds an option to decide on acquisition after seeing up to three years of operating results from completion. Most of the funding during development comes from the senior loan and the other preferred investors, so the REIT’s own capital commitment is small. According to the REIT’s disclosure, hotels account for 26 properties and ¥168,198M (23.5%) of its portfolio by (planned) acquisition price as of May 25, 2029 (planned), which suggests this kind of development-stage involvement is positioned to supplement external growth in hotels.
Checking the In-House Exit Against the REIT Holdings Master
To see how a design that keeps the exit inside the group actually shows up in ownership, we turn to the REIT Holdings Master for the seven listed hotel REITs. As of September 14, 2026, 300 domestic properties out of 302 registered are in scope, with total acquisition prices of ¥1,804,161M and 52,337 rooms. The table is sorted by securities code and does not indicate ranking by size.
| REIT (securities code) | Domestic properties | Total acquisition price | Rooms | Acquisition price per room (median) |
|---|---|---|---|---|
| Hoshino Resorts REIT (3287) | 71 | ¥233,906M | 8,667 | ¥19.3M |
| Ichigo Hotel REIT (3463) | 29 | ¥71,903M | 4,418 | ¥13.8M |
| Nippon Hotel & Residential Investment Corporation (3472) | 16 | ¥48,083M | 1,991 | ¥26.5M |
| Kasumigaseki Hotel REIT (401A) | 15 | ¥49,210M | 726 | ¥45.3M |
| MORI TRUST REIT (8961) | 6 | ¥142,217M | 1,937 | ¥52.2M |
| Invincible Investment Corporation (8963) | 110 | ¥603,134M | 19,260 | ¥23.3M |
| Japan Hotel REIT Investment Corporation (8985) | 53 | ¥655,708M | 15,338 | ¥25.8M |
| Total | 300 | ¥1,804,161M | 52,337 | — |
Kasumigaseki Hotel REIT Investment Corporation is a hotel-focused REIT sponsored by Kasumigaseki Capital that listed on the Tokyo Stock Exchange on August 13, 2025. In the REIT Holdings Master it holds 15 properties with total acquisition prices of ¥49,210M and 726 rooms — an average of 48 rooms per property and a median acquisition price per room of ¥45.3M. Dividing total acquisition price by total rooms gives a weighted average of ¥67.8M; the gap from the median is driven largely by a single property, seven x seven ISHIGAKI, with 121 rooms and ¥18,700M. This level reflects a product built around spacious rooms for larger groups, and recent acquisition dates. The other six REITs made acquisitions spread out from the early 2010s onward, so cross-REIT comparisons of price per room include differences in acquisition vintage.
The time from opening to incorporation shows the in-house exit more directly. Measuring from each of the 15 properties’ opening dates in our hotel master to the listing date gives a median of 2.7 years, with a minimum of 0.7 years (FAV LUX KAGOSHIMA TENMONKAN) and a maximum of 4.8 years (fav HIDA TAKAYAMA). The numbers confirm a flow in which properties build up an operating track record for roughly one to five years after opening — in an operating fund or similar — before moving into the group REIT.
Where This Sits in Overall Supply — New Openings and Plans with 100+ Rooms
It is also worth placing these build-to-sell projects within total hotel supply. Within the scope tracked by MetroEngines Research, new openings confirmed via OTA and other listings numbered 1,979 in 2024 (20 rooms on average), 1,751 in 2025 (24 rooms) and 1,560 in 2026 (25 rooms). By category in 2026, vacation rentals led with 759, followed by business hotels at 198, hostels at 114 and resort hotels at 93 — small properties make up the majority by count. Because listings appear several months before opening, the 2026 figures for September onward are expected to rise as more listings come in.
Meanwhile, on the building-permit basis of MLIT’s Building Dynamics Statistics survey, there are 63 hotel plans with 100 or more rooms, totalling 15,104 rooms, with a median of 200 rooms. Of these, 29 plans and 5,992 rooms have scheduled completion dates on or after this article’s writing date (September 16, 2026), concentrated in 2027 (16 plans, 3,685 rooms) and 2028 (7 plans, 1,375 rooms). By count they are a tiny fraction of all new openings, but in rooms and capital deployed they are a weighty band. Kasumigaseki Hotel REIT’s holdings (48 rooms on average) and Hakone Gora (90 rooms) sit in the mid-size band between these large plans and the small openings.
The months from construction start to completion in the left chart are what the holding-period estimate uses. For the 36 plans whose primary use is hotel and that have both a construction start date and a completion date registered, the median is 24.9 months and the interquartile range is 19.5–34.0 months. The Hakone Gora disclosure (construction start at the end of October 2026, completion planned for September 2028) implies about 23 months, close to the middle of this distribution. The planning and permitting period from site acquisition to construction start is not included in these statistics, so the estimate adds 6–12 months separately; municipal ordinance procedures alone typically take 15–60 days within that window.
Estimating Capital Lock-Up — How Long a 100-Room Model “Sits in Inventory”
From here we estimate how much the carrying cost changes depending on at which stage a developer holding the site as real estate for sale transfers it to an outside party. Rather than a single definitive figure, we show three cases — low, mid and high — with assumptions set as ranges. This article limits carrying cost to cash outlays (loan interest, property taxes and management costs); the opportunity cost of equity tied up in the site is excluded.
| Assumption | Low | Mid | High | Basis |
|---|---|---|---|---|
| Site price | ¥800M | ¥1.15bn | ¥1.5bn | Assumption (varies widely by location) |
| Gross floor area (100 rooms) | 3,500 m² | 4,000 m² | 4,500 m² | Referencing the median floor area per room of 42.8 m² for plans with 100+ rooms (N=41) |
| Construction unit cost | ¥2.0M/tsubo | ¥2.2M/tsubo | ¥2.4M/tsubo | 2025 Building Construction Starts Statistics basis: RC ¥2.026M, steel ¥2.405M per tsubo |
| Construction cost | ¥2.12bn | ¥2.66bn | ¥3.27bn | Floor area × unit cost |
| Borrowing rate (applied to full amount) | 2.00% | 2.50% | 3.15% | Assumption |
| Fixed asset tax and city planning tax (site) | 0.70% | 0.83% | 0.90% | Effective rate: standard rates of 1.4% + 0.3% multiplied by the ratio of taxable value to assessed value |
| Management and other costs (site) | 0.05% | 0.075% | 0.10% | Assumption |
| Planning and permitting period | 6 months | 9 months | 12 months | Assumption |
| Construction start to completion | 19.5 months | 24.9 months | 34.0 months | Quartiles and median of plan data (N=36) |
| Completion to sale | 1 month | 2 months | 3 months | Hakone Gora: completion September 2028, opening December 2028 (planned) |
We split the analysis into two cases. Transfer at the site stage is a design in which the site moves to a development fund or similar once planning and permitting are complete, so the developer carries only 6–12 months of site holding. Hold to completion is a design in which the developer carries both the site and the construction funding on its own balance sheet from site acquisition to sale after completion.
| Case | Holding period | Total project cost | Carrying cost | Per room | % of total project cost |
|---|---|---|---|---|---|
| Transfer at site stage (low) | 6 months | — | ¥11M | ¥110k | — |
| Transfer at site stage (high) | 12 months | — | ¥62M | ¥620k | — |
| Hold to completion (low) | 26.5 months | ¥2.92bn | ¥87M | ¥0.87M | 3.0% |
| Hold to completion (mid) | 35.9 months | ¥3.81bn | ¥197M | ¥1.97M | 5.2% |
| Hold to completion (high) | 49.0 months | ¥4.77bn | ¥426M | ¥4.26M | 8.9% |
Holding to completion on the developer’s own books means a holding period of 26.5–49 months and a carrying cost of ¥87M–¥426M, or 3.0–8.9% of total project cost. In the mid case, ¥117M comes from the site and ¥80M from construction funding, and the longer the period, the larger the site’s share. The 8.9% in the high case is a level that should be weighed against the expected range of development profit. By contrast, in the model that transfers to a development fund at the site stage, the carrying cost borne by the developer stays at ¥11M–¥62M (¥110k–¥620k per room).
Two-Way Sensitivity to Interest Rate and Holding Period — How Far Can the Ratio Swing?
The three cases above move all assumptions together, so they cannot isolate how much each variable matters. We therefore fix the mid case (site ¥1.15bn, construction cost ¥2.66bn, total project cost ¥3.81bn) and vary only two axes: the total period from site acquisition to sale and the borrowing rate. Planning and permitting (9 months) and completion to sale (2 months) stay at their mid-case values, with the remainder allocated to construction. Darker shading means a higher share of total project cost. The mid case (36 months, 2.50%) is the outlined cell.
| Total period / borrowing rate | 1.50% | 2.00% | 2.50% | 3.00% | 3.50% |
|---|---|---|---|---|---|
| 24 months | 2.2%¥84M | 2.7%¥105M | 3.3%¥125M | 3.8%¥146M | 4.4%¥167M |
| 30 months | 2.8%¥107M | 3.5%¥135M | 4.2%¥162M | 5.0%¥189M | 5.7%¥216M |
| 36 months | 3.4%¥131M | 4.3%¥165M | 5.2%¥198M | 6.1%¥231M | 6.9%¥265M |
| 42 months | 4.1%¥155M | 5.1%¥195M | 6.1%¥234M | 7.2%¥274M | 8.2%¥313M |
| 48 months | 4.7%¥179M | 5.9%¥225M | 7.1%¥270M | 8.3%¥316M | 9.5%¥362M |
The range runs from 2.2% to 9.5% — a spread of 7.3 percentage points of total project cost, or ¥84M versus ¥362M in yen. Doubling the period from 24 to 48 months raises the ratio by roughly 2.1–2.2 times, while raising the rate by 2 points from 1.50% to 3.50% raises it 1.9–2.0 times for the same period. Because period and interest rate work with nearly equal force, when rates are rising, shortening the inventory period is a direct way to offset the rate increase. For example, 2.50% over 42 months (6.1%) lands at almost the same level — 5.7% — if the rate rises to 3.50% but the period is cut to 30 months.
In practice, the key reading is where this ratio sits relative to the expected development margin. If the development profit margin is put at, say, the low teens, the 9.5% at 48 months and 3.50% falls in territory where carrying cost eats most of it. The reason developers choose designs that transfer the site to outside parties at the acquisition stage is to take this upper end off their balance sheet.
This difference is the heart of the design that cycles sites as real estate for sale. The earlier the transfer, the shorter the developer’s capital lock-up, and the more projects the same equity can run in parallel. The carrying cost does not disappear, however; it moves to the investors and lenders of the development fund or SPC, and their compensation is reflected in how development profit is shared. As the Hakone Gora capital structure shows, development-period funding is planned at about 60% senior loan and about 35% preferred equity; allocating by contract who bears the funding cost for which period is, in effect, the design of development-type hotel investment itself.
Dividing the estimated total project cost by the number of rooms gives ¥29–48M per room. The ¥45.3M median acquisition price per room for Kasumigaseki Hotel REIT’s 15 properties, mentioned above, sits near the upper end of that range. Acquisition prices reflect development profit and the value of an operating track record on top of development cost, so this is not a like-for-like comparison, but it is a useful gauge of how wide the gap is between exit price and development cost.
Implications by Reader — Who Provides the Capital, and How the Exit Is Designed
Developer planning and finance teams
Adopt “months from site acquisition to external transfer” as a KPI for the inventory period. Because the carrying cost of holding to completion reaches 3.0–8.9% of total project cost, there is room to design the transfer timing together with negotiations over how development profit is shared.
REIT and private fund acquisitions teams
Entering a development SPC through preferred equity gives the option to watch up to three years of post-completion operating results with risk capped at the amount invested. Conditions such as investing only after permits are obtained and signing a lease pre-contract are the requirements that keep that risk contained.
Project finance lenders
In the Hakone Gora plan, the senior loan is about 60% of assets. Whether an exit buyer exists (a group REIT, a right of first negotiation) and for how long it can be exercised can be organised as inputs for judging the certainty of repayment sources.
Summary
Hotel development financing is easier to understand when organised not by “who builds” but by “who carries which period.” The model that acquires sites as real estate for sale and passes them in stages to a development fund, an operating fund and then a group REIT works to shorten the developer’s inventory period and raise its pace of openings. The result shows in the fact that Kasumigaseki Hotel REIT Investment Corporation’s 15 properties were incorporated a median 2.7 years after opening. The model in which a REIT takes about 14.3% of a development SPC’s preferred equity and gains a post-completion right of first negotiation, meanwhile, is a design through which a long-term owner secures an acquisition opportunity early for a limited outlay.
In the 100-room model estimate, holding to completion on the developer’s own books costs 3.0–8.9% of total project cost, while transferring at the site stage keeps it to ¥11M–¥62M. Against a construction period with a median of 24.9 months from start to completion (N=36), that difference is large enough to decide a development project’s economics. How development risk and funding costs are split by contract will likely shape how far investment opportunities in mid-size hotel development widen from here.
References and Sources
■ Data Sources
REIT Holdings Master (properties held by the seven listed hotel REITs; as of September 14, 2026, 300 domestic properties out of 302 registered), in-house hotel master (opening dates based on confirmed OTA and other listings, N=15 properties), new-opening tally (1,979 in 2024, 1,751 in 2025, 1,560 in 2026; listing-confirmation basis), building-permit-based plan data from MLIT’s Building Dynamics Statistics survey (63 plans with 100+ rooms, 15,104 rooms; of which N=36 with primary use hotel and both construction start and completion dates registered; N=41 for floor area per room), MLIT’s Building Construction Starts Statistics, and company timely disclosures and press releases (dates given in the text).
■ Estimation Assumptions
The carrying cost of the 100-room model is on a cash-outlay basis (loan interest + fixed asset tax and city planning tax + management costs). In addition to the low, mid and high cases, a two-way sensitivity of total period × borrowing rate with the mid case fixed is shown. The site bears interest, property taxes and management costs for the full period from acquisition to sale; interest on construction funding is charged on an average balance of 50% of construction cost during construction and 100% from completion to sale. Property tax uses an effective rate equal to the standard rates of 1.4% + 0.3% multiplied by the ratio of taxable value to assessed value; the construction unit cost range references the 2025 Building Construction Starts Statistics figures of ¥2.026M per tsubo for RC and ¥2.405M per tsubo for steel. Site price, interest rate, management costs and the planning and permitting period are assumptions and vary widely with location and financing terms.
■ Limitations and Caveats
The estimate is a simplified model that excludes the opportunity cost of equity, development profit, tax effects and project-specific demolition or site preparation costs, and it does not replace a feasibility study for an individual project. Plan data are on a building-permit basis, so counts and rooms are expected to rise as further applications are added; read them as a lower bound of the currently confirmed pipeline. New-opening counts are on a listing-confirmation basis, so the most recent months will increase. REIT acquisition prices per room span acquisition years from the early 2010s onward, so cross-REIT comparisons include differences in acquisition timing. Development schedules, room counts and capital structures are all planned values as of disclosure and do not indicate that completion, opening or acquisition is certain. A right of first negotiation is a right and carries no obligation to buy.
■ Market Data
- MetroEngines Research & Consulting — REIT Holdings Master (as of September 14, 2026, 300 domestic properties), in-house hotel master (opening dates based on confirmed OTA and other listings), new-opening tally
■ Timely Disclosures and Press Releases (in Japanese)
- United Urban Investment Corporation, “Notice Concerning Acquisition of Domestic Asset (Preferred Equity Securities of the Hakone Kamigora Project (Hotel Development) Specific Purpose Company)” (September 4, 2026)
- The Royal Hotel, Limited, “RIHGA Royal Hotels hot-spring resort brand NOWA by RIHGA Hakone Gora to open in December 2028” (September 4, 2026)
- Kasumigaseki Capital Co., Ltd., “[Kisarazu/Nippori] Notice Concerning Acquisition of Two Hotel Development Sites” (July 31, 2026)
- Kasumigaseki Capital Co., Ltd., “[Lake Yamanaka, Yamanashi] Notice Concerning Acquisition of a Hotel Development Site” (June 30, 2026)
- Kasumigaseki Capital Co., Ltd., “Notice Concerning Acquisition of a Hotel Development Site” (April 15, 2026)
- Kasumigaseki Capital Co., Ltd., “[Shibuya, Tokyo] Notice Concerning Sale of Real Estate for Sale (Hotel Development Site)” (May 29, 2025)
- Kasumigaseki Capital Co., Ltd., “Q2 FY Ending August 2026 Earnings Presentation” (April 3, 2026)
- logmi Finance, transcript of Kasumigaseki Capital’s Q2 FY Ending August 2026 earnings briefing (April 2026)
- United Urban Investment Corporation, portfolio list
- Kasumigaseki Hotel REIT Investment Corporation, portfolio list
- Kasumigaseki Hotel REIT Investment Corporation, listing information (listed August 13, 2025)
■ Government Statistics and Public Data
- MLIT, Building Construction Starts Statistics
- MLIT, Building Dynamics Statistics survey (building-permit-based hotel plan data)
- archi-book, “Construction Unit Costs by Structure, 2025 Edition”