

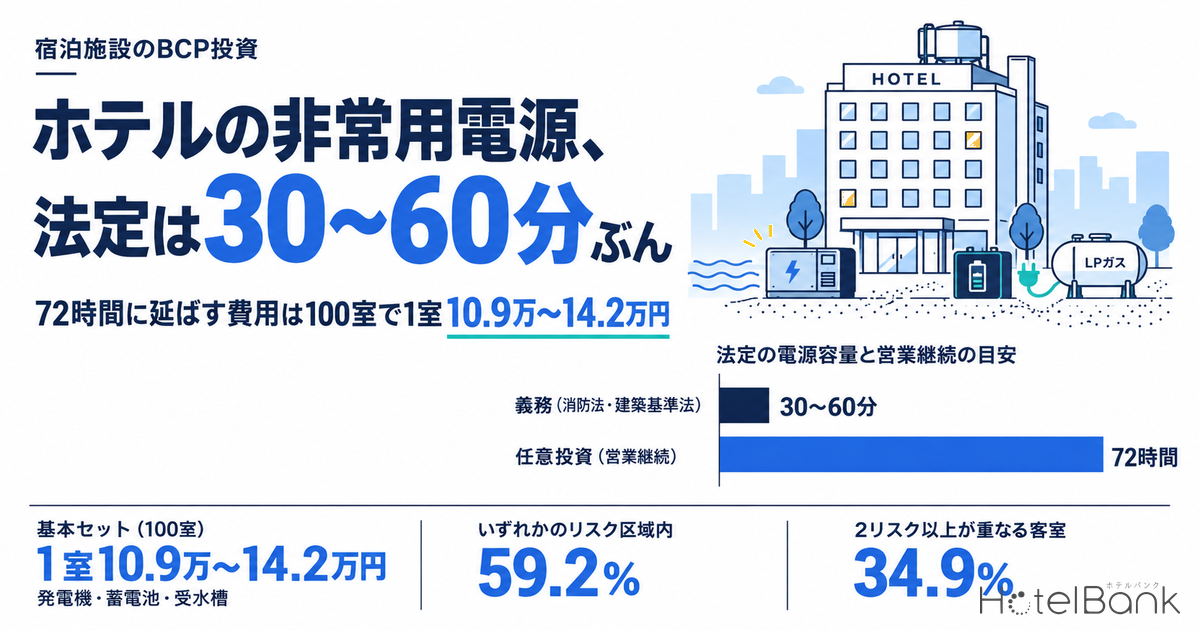
The emergency power that Japanese law requires of hotels and ryokan exists to run fire hydrants and emergency elevators for 30 to 60 minutes during a fire. It is not power for continuing to sell rooms during a blackout. A reading of the Fire Service Act and the Building Standards Act shows that the obligation is limited to “the time needed to get people out of a fire”; the electricity and water needed to keep operating for 72 hours are left entirely to the operator’s voluntary investment. So how much does that voluntary investment cost, and in which locations does it pay off first? In this article we first set out the statutory line article by article, then build up Capex for 100-room and 200-room models from published unit prices for generators, storage batteries, receiving water tanks, wells and LP gas bulk tanks. We then overlay the locations of 2,711 properties and 332,483 rooms in 16 trade areas nationwide on the Ministry of Land, Infrastructure, Transport and Tourism (MLIT) disaster risk data, to work out the order in which equipment should be added to create upside in asset value.
Metric Definitions Used in This Article
- ADR (average daily rate): An estimated settled rate (tax-exclusive equivalent) calculated by applying a correction factor for each property type to the lowest-plan price level each property publishes on OTAs (two guests in one room, per-room rate, tax-inclusive). Checked against the property-level results disclosed by listed hotel REITs (184 property-months, April–May 2026), the median error is about 7.5%. These are estimates and differ from each property’s actual settled rates and accounting figures. Trade-area ADR is the median of the properties covered (the level of a typical property in that trade area). This article uses the monthly average for September 2025 to August 2026.
- OCC (occupancy rate): The ratio of rooms sold to total rooms in the area (an estimate based on inventory sold through OTAs). The occupancy rate used in the payback estimates in this article is a model assumption taken from the Japan Tourism Agency’s Overnight Travel Statistics Survey, 2025 final figures (business hotels: 75.3%).
- Scope of analysis: 2,711 properties with 332,483 rooms located within a 1.5km radius of the center point of 16 trade areas nationwide, with 10 or more rooms, for which selling prices were observed on OTAs between September 2025 and August 2026 (based on listings on major booking sites).
- The four disaster risks: Determined by overlaying each property’s location coordinates on the public layers of the MLIT Real Estate Information Library. Flood = inundation depth of 0.5m or more in an assumed flood inundation area (maximum assumed scale); tsunami = inside an assumed tsunami inundation area; landslide = inside a sediment disaster warning area; liquefaction = the top two of five classes in the liquefaction tendency map based on landform classification. All of these areas are premised on events of “the maximum conceivable scale” and the like, and do not indicate a high probability of occurrence.
- Data sources: MetroEngines Research & Consulting; MLIT Real Estate Information Library. Data as of October 3, 2026.
- — Statutory power is 30–60 minutes: Under the Fire Service Act, emergency power sources must last 30 minutes for indoor fire hydrants and 10 minutes for automatic fire alarm systems; under the Building Standards Act, standby power must last 30 minutes for emergency lighting and smoke exhaust and 60 minutes for emergency elevators. Continuing operations for 72 hours is voluntary investment.
- — Routes to subsidies and payment: Lodging facilities recognized by their municipality as temporary evacuation shelters are eligible for fuel stockpiling subsidies (up to 1/2) for disaster-ready LP gas bulk tanks and similar equipment. Payment for use as an evacuation shelter is capped at ¥10,000 per person per night including tax (meals separate).
- — The basic set costs ¥109,000–142,000 per room: A portable generator, storage battery and larger receiving water tank come to ¥10.88–14.21 million for 100 rooms and ¥16.35–23.94 million for 200 rooms (¥82,000–120,000 per room).
- — 59.2% of rooms in the 16 trade areas (196,684 of 332,483) are inside a flood, tsunami, landslide or liquefaction area. Rooms where two or more risks overlap account for 34.9%, ranging from 0.0% at Sendai Station and 0.1% in Shinjuku to 100% in Hiroshima and Kochi.
- — Payback balances at 1.2–4.7 disaster events: Converted to years, the basic set ranges from 5.5 years to more than 80. In the two-axis sensitivity analysis, median Capex with a 1/2 subsidy, one event every 10 years and 7 closure days avoided gives 8.6 years for 100 rooms.
The Mandatory Line — The Law Requires Power for “Time to Escape”, Sized at 30–60 Minutes
Let us first confirm where the regulatory line is drawn. The basis for requiring emergency power at lodging facilities falls into two systems: the “emergency power source” under the Fire Service Act and the “standby power source” under the Building Standards Act. Both cover equipment for firefighting, alarm and evacuation; operating loads such as guest room lighting, air conditioning, hot water and kitchens are not included.
Under the Fire Service Act, hotels and ryokan are specified fire-prevention properties under item (5)(a) of Appended Table 1 of the Order for Enforcement. Indoor fire hydrant equipment is required at a total floor area of 700㎡ or more (relaxed to two or three times that figure where fire-resistive construction and interior finish conditions are met), and sprinkler equipment is required on the 11th floor and above, or where total floor area is 6,000㎡ or more in buildings other than single-story ones. This equipment must be fitted with an emergency power source, and Article 12 of the Enforcement Regulations sets the capacity for indoor fire hydrant equipment as being able to “operate effectively for thirty minutes or more.” There is also a line on the type of power source: specified fire-prevention properties with a total floor area of 1,000㎡ or more cannot choose dedicated emergency power receiving equipment and must use private generating equipment, storage battery equipment or fuel cell equipment. Since a 100-room hotel usually has a total floor area of several thousand square meters, in practice almost all of them can be considered to fall inside this line.
The Building Standards Act, meanwhile, requires emergency elevators in buildings more than 31m high (Article 34, paragraph 2 of the Act) and requires those emergency elevators to have a standby power source (Article 129-13-3 of the Order for Enforcement). Emergency lighting is required in the habitable rooms and evacuation routes of hotels and ryokan (Article 126-4 of the Order), and smoke exhaust equipment that needs power must also have a standby power source (Article 126-3 of the Order). The required duration is 30 minutes for emergency lighting and smoke exhaust equipment and 60 minutes for emergency elevators. According to commentary by the Nippon Engine Generator Association (日本内燃力発電設備協会), the building standards legislation sets no specific standards for the structure and performance of standby power sources other than operating time, and they are administered in line with the standards of the fire service legislation.
| Law | Equipment covered | Installation threshold for hotels and ryokan | Power source requirement | Duration |
|---|---|---|---|---|
| Order for Enforcement of the Fire Service Act, Art. 11 / Enforcement Regulations, Art. 12 | Indoor fire hydrant equipment | Total floor area of 700㎡ or more (relaxed for fire-resistive construction and interior finish limits) | Emergency power source required. At 1,000㎡ or more: private generator, storage battery or fuel cell | 30 minutes or more |
| Order for Enforcement of the Fire Service Act, Art. 12 | Sprinkler equipment | 11th floor and above / total floor area of 6,000㎡ or more in buildings other than single-story | Emergency power source required (as for indoor fire hydrant equipment) | 30 minutes or more |
| Enforcement Regulations of the Fire Service Act, Art. 24 | Automatic fire alarm system | Required at hotels and ryokan | Storage battery equipment at 1,000㎡ or more | 10 minutes |
| Building Standards Act, Art. 34 / Order for Enforcement, Art. 129-13-3 | Emergency elevator | Buildings more than 31m high | Standby power source (private generating equipment) | 60 minutes |
| Order for Enforcement of the Building Standards Act, Art. 126-4 | Emergency lighting | Habitable rooms and evacuation routes of special buildings (including hotels and ryokan) | Standby power source (storage batteries, etc.) | 30 minutes |
| Order for Enforcement of the Building Standards Act, Art. 126-3 | Smoke exhaust equipment | Smoke exhaust equipment that requires power | Standby power source | 30 minutes |
The maintenance obligation is also worth confirming. According to the Tokyo Fire Department, the inspection standards for private generating equipment were revised in June 2018: internal observation and similar methods can now be chosen in place of load operation, and where preventive maintenance measures to maintain operating performance are in place, the cycle for load operation or internal observation can be extended to once every six years. Equipment that uses a gas turbine as its prime mover no longer requires load operation. In other words, hotels inside the mandatory line already have generators and storage batteries and already bear the cost of inspection. The question for voluntary investment is not “installing power where there is none” but the increment: “how far to extend 30–60 minutes of fire-safety power toward 72 hours of operating power.”
The Gateway to Voluntary Investment — A Shelter Agreement Opens Routes to Subsidies and Payment
The 72-hour benchmark comes from the government’s shelter schemes. The “Guidelines for Securing and Operating Temporary Shelter Facilities” issued by the liaison council on measures for commuters stranded by a Tokyo inland earthquake assume that stranded commuters are accommodated for up to three days after a disaster, and the Tokyo Metropolitan Ordinance on Measures for Stranded Persons also asks businesses to make efforts to stockpile three days of supplies. Whether a hotel becomes a temporary shelter facility or an evacuation shelter, however, is a voluntary decision based on an agreement with the municipality. Precisely because it is not mandatory, agreements are paired with payment and support.
There are three main routes. The first is subsidies for physical improvements: under the Tokyo Metropolitan Government’s program for temporary shelter facilities, the incremental cost that private operators incur for the shelter portion is subsidized 2/3 by the national government and 1/3 by Tokyo. The second is subsidies for fuel stockpiling. The Ministry of Economy, Trade and Industry (METI) subsidy for promoting self-reliant fuel stockpiling at socially important infrastructure in preparation for disasters covers private facilities such as lodging facilities recognized by their municipality as temporary evacuation shelters, as “facilities that can serve as temporary evacuation shelters,” and in the call under the FY2025 supplementary budget and FY2026, applications are accepted under the FY2026 program. The subsidy rate is up to 1/2 of eligible costs, with a cap of ¥10 million for LP gas containers and supply equipment only, rising to ¥50 million when combined with generators and air-conditioning equipment. For LP gas, the requirement is that 50% of the maximum storage volume can cover operation for at least three and no more than seven days; here too, “three days” appears as a design condition. In FY2026, following the first call (May 27–June 16) and the second (July 1–21), a third call ran from August 5 to October 5, and an additional (fourth) call for the FY2026 program is planned from early October onward.
The third is payment for the accommodation itself. According to Cabinet Office guidelines (December 2025), when hotels and ryokan are used as evacuation shelters in a disaster to which the Disaster Relief Act applies, the cost that can be paid is the actual cost up to ¥10,000 per person per night including tax (not including meals) under the standard amount as of FY2025, and materials from a Cabinet Office study group introduce examples such as Kumamoto Prefecture and Gero City, where agreements are concluded in advance with ryokan and hotel associations or individual properties. A shelter agreement can help fill rooms at a time when ordinary demand stops. Since sheltering itself is impossible in a building where electricity and water have stopped, the effectiveness of an agreement can be said to depend on whether the property has independent power and independent water supply.
| Category | Purpose | Guide for power and water capacity | Basis / scheme | Who bears the cost |
|---|---|---|---|---|
| Mandatory (fire safety) | Firefighting, alarm, evacuation | 10–60 minutes (by equipment) | Emergency power source under the Fire Service Act; standby power source under the Building Standards Act | Operator (included in construction cost at new build) |
| Voluntary 1 (agreement) | Accommodating stranded commuters and evacuees | 3 days (72 hours) | Agreement with the municipality, Disaster Relief Act, Tokyo and national improvement subsidies, disaster-ready LP gas bulk subsidy | Shelter portion subsidized. Payment of up to ¥10,000 per person per night (meals separate) when sheltering |
| Voluntary 2 (business continuity) | Selling rooms during power and water outages | 3–7 days | No statutory provision (BCP) | Operator. Municipal BCP grants may be available |
Capex by Equipment — The Basic Set Costs ¥10.88–14.21 Million for 100 Rooms, ¥109,000–142,000 per Room
Next, we build up the content of voluntary investment equipment by equipment. On the power side we cover emergency generators (portable, permanently installed diesel, and LP gas) and storage batteries; on the water and heat side, a larger receiving water tank, a well, well-water filtration and an LP gas bulk tank. Unit prices are taken from published list prices and market-rate articles and applied to two models of 100 and 200 rooms. Because installation costs vary widely with the installation site and delivery conditions, the figures should be read strictly as rough ranges.
| Equipment | Assumed specification and basis for unit price | 100-room model | Per room | 200-room model | Per room |
|---|---|---|---|---|---|
| Portable generator (diesel) | 25–45kVA class for 100 rooms, 60–100kVA class for 200 rooms. Published list price of the unit (excluding tax). Connection panel work is separate | ¥4.04–5.21 million | ¥40,400–52,100 | ¥4.97–8.24 million | ¥24,850–41,200 |
| Permanent generator (diesel) | 50–66kVA class for 100 rooms, 100–115kVA class for 200 rooms. Lower bound is the market rate for the unit; upper bound is the published list price of emergency units (excluding tax). Installation work is separate | ¥4.00–16.22 million | ¥40,000–162,200 | ¥8.00–20.70 million | ¥40,000–103,500 |
| Permanent generator (LP gas) | Converted at about 1.5 times a diesel unit of the same output. Output is limited to 54kVA, so two units for 200 rooms | ¥6.00–20.54 million | ¥60,000–205,400 | ¥12.00–41.08 million | ¥60,000–205,400 |
| Storage battery | 20kWh for 100 rooms, 40kWh for 200 rooms (to maintain communications, front desk and lighting). ¥92,000–200,000/kWh | ¥1.84–4.00 million | ¥18,400–40,000 | ¥3.68–8.00 million | ¥18,400–40,000 |
| Larger receiving water tank | 12㎥ for 100 rooms (an actual FRP tank replacement at ¥5 million); 24㎥ for 200 rooms (linear interpolation between actual 12㎥ and 100㎥ cases) | Approx. ¥5.00 million | ¥50,000 | Approx. ¥7.70 million | ¥38,500 |
| Well (deep well) | Drilling to 100m depth at 100–150mm diameter, ¥3–6 million, plus submersible pump, ¥0.6–2 million | ¥3.60–8.00 million | ¥36,000–80,000 | ¥3.60–8.00 million | ¥18,000–40,000 |
| Well-water filtration (membrane) | The on-site model, in which a vendor owns the equipment and charges by volume of water treated, is common | No upfront cost | — | No upfront cost | — |
| LP gas bulk tank | For 100 rooms, a package with a 500–1,000kg tank (about ¥5–6 million including power, lighting and heat source); for 200 rooms, two 1,000kg tanks | ¥5.00–6.00 million | ¥50,000–60,000 | Approx. ¥12.00 million | ¥60,000 |
| Basic set | Portable generator + storage battery + larger receiving water tank | ¥10.88–14.21 million | ¥108,800–142,100 | ¥16.35–23.94 million | ¥81,750–119,700 |
| Extended set | Permanent diesel generator + storage battery + receiving water tank + well + LP gas bulk tank | ¥19.44–39.22 million | ¥194,400–392,200 | ¥34.98–56.40 million | ¥174,900–282,000 |
The basic set of three items — a portable generator, a storage battery and a larger receiving water tank — comes to ¥10.88–14.21 million for the 100-room model, or ¥109,000–142,000 per room. The 200-room model comes to ¥16.35–23.94 million, which falls to ¥82,000–120,000 per room. Because generators and wells do not increase in proportion to room count, the per-room burden becomes lighter the larger the property. The extended set, which adds a well and an LP gas bulk tank to a permanent generator, has a wide range: ¥19.44–39.22 million for 100 rooms and ¥34.98–56.40 million for 200 rooms. Most of that range comes from the unit price of the permanent generator, because there is a fourfold gap between the market-rate lower bound and the list-price upper bound.
Regulation also affects the choice of fuel. Diesel oil is a hazardous material under the Fire Service Act (Class II petroleum), with a designated quantity of 1,000 liters. Running a generator that consumes, say, 15 liters per hour for 72 hours requires 1,080 liters, which exceeds the designated quantity. The more that is stockpiled, the heavier the storage permit and equipment requirements become; this is the background to why 72-hour diesel capacity does not advance easily in city-center buildings. LP gas, by contrast, keeps its quality for about 20 years according to Iwatani’s commentary, whereas diesel oil needs replacing once every five years. The unit price is about 1.5 times that of a diesel unit and the maximum output is small at 54kVA, but combined with a bulk tank, a single fuel can cover power generation, hot water and the kitchen heat source. For storage batteries, materials from a METI study group put the equipment cost in subsidized projects at an average of ¥92,000/kWh (FY2023, 11 projects) and the prevailing price outside subsidized projects at around ¥200,000/kWh; batteries suit the role of keeping communications and front-desk functions running until the generator starts up.
| Item | Assumption | Annual amount |
|---|---|---|
| Equipment inspection and comprehensive inspection | One equipment inspection at ¥100,000–300,000 and one comprehensive inspection at ¥200,000–500,000 | ¥300,000–800,000 |
| Load test (once every 6 years) | Simulated load test at ¥200,000–800,000 spread over 6 years. Where preventive maintenance measures are in place | ¥33,000–133,000 |
| Fuel renewal | 1,080 liters of diesel oil replaced every 5 years. Unit price assumed at ¥150/liter | Approx. ¥32,000 |
| Total | — | Approx. ¥370,000–970,000 |
We estimate maintenance at ¥370,000–970,000 per year per generator. However, hotels inside the lines in Table 1 already carry out statutory inspections, so if the investment takes the form of upgrading an existing generator, the increment is limited to around ¥30,000 a year for fuel renewal. When a generator is added voluntarily, the inspection cost is added in full, so whether the unit can double as mandatory equipment is the fork that determines how heavy maintenance costs become.
Location Analysis — 59.2% of the 332,483 Rooms in 16 Trade Areas Are Inside at Least One of the Four Risk Areas
We now turn to location. For 16 trade areas nationwide from Sapporo to Naha, we took the 2,711 properties and 332,483 rooms with 10 or more rooms that lie within a 1.5km radius of the center point and for which selling prices were observed between September 2025 and August 2026, and determined whether each property’s location falls inside the four areas: flood (inundation depth of 0.5m or more), tsunami, landslide and liquefaction. Note that we count at the points where rooms actually stand, not by the land area of the trade area.
| Trade area (1.5km radius) | Properties | Rooms | Flood 0.5m+ | Of which 3m+ | Tsunami | Landslide | Liquefaction | Any | 2 or more | Median ADR |
|---|---|---|---|---|---|---|---|---|---|---|
| Sapporo (Odori/Susukino) | 193 | 31,337 | 29.8% | 0.0% | 0.0% | 0.0% | 0.0% | 29.8% | 0.0% | ¥14,958 N=151 |
| Sendai Station | 93 | 13,675 | 0.0% | 0.0% | 0.0% | 0.0% | 0.0% | 0.0% | 0.0% | ¥9,608 N=85 |
| Tokyo Station (Marunouchi/Yaesu) | 168 | 23,356 | 52.5% | 2.6% | 0.0% | 0.0% | 58.2% | 66.1% | 44.6% | ¥19,178 N=124 |
| Shinjuku | 156 | 21,902 | 0.1% | 0.0% | 0.0% | 0.0% | 0.0% | 0.1% | 0.0% | ¥15,404 N=98 |
| Ueno/Asakusa | 278 | 22,900 | 84.4% | 21.8% | 0.0% | 0.0% | 51.3% | 87.2% | 48.6% | ¥14,574 N=173 |
| Yokohama (Kannai/Minato Mirai) | 88 | 15,161 | 1.4% | 0.0% | 76.2% | 0.5% | 80.3% | 92.9% | 64.1% | ¥12,407 N=59 |
| Nagoya Station | 103 | 17,916 | 74.2% | 0.0% | 0.0% | 0.0% | 56.4% | 74.2% | 56.4% | ¥10,460 N=95 |
| Kanazawa (Station/Korinbo) | 97 | 12,924 | 50.3% | 4.8% | 0.0% | 0.0% | 0.0% | 50.3% | 0.0% | ¥9,501 N=88 |
| Kyoto (Shijo-Karasuma) | 379 | 28,003 | 66.9% | 6.2% | 0.0% | 0.0% | 0.0% | 66.9% | 0.0% | ¥16,175 N=251 |
| Osaka Umeda | 112 | 24,562 | 79.5% | 24.8% | 61.3% | 0.0% | 62.1% | 94.8% | 68.1% | ¥11,930 N=90 |
| Osaka Namba | 303 | 36,276 | 2.9% | 0.0% | 1.9% | 0.0% | 13.4% | 14.7% | 2.5% | ¥11,810 N=217 |
| Kobe Sannomiya | 65 | 9,651 | 2.3% | 2.3% | 0.0% | 11.3% | 32.6% | 46.2% | 0.0% | ¥12,602 N=57 |
| Hiroshima (Hatchobori/Station) | 124 | 16,348 | 100.0% | 81.1% | 89.8% | 0.0% | 100.0% | 100.0% | 100.0% | ¥10,147 N=94 |
| Kochi (Harimayabashi) | 55 | 5,327 | 98.9% | 0.0% | 98.9% | 0.0% | 100.0% | 100.0% | 98.9% | ¥7,801 N=54 |
| Fukuoka (Hakata/Tenjin) | 287 | 34,259 | 74.1% | 1.1% | 0.0% | 0.0% | 85.7% | 89.0% | 70.7% | ¥15,322 N=209 |
| Naha (Kokusai-dori) | 210 | 18,886 | 23.5% | 2.2% | 58.2% | 0.0% | 67.3% | 74.4% | 59.9% | ¥10,831 N=122 |
| Total, 16 trade areas | 2,711 | 332,483 | 45.7% | 8.5% | 17.5% | 0.4% | 40.5% | 59.2% | 34.9% | ¥13,249 N=1,967 |
Across the 16 trade areas in total, 196,684 rooms (59.2%) are inside at least one of the four risk areas, and 116,126 rooms (34.9%) are where two or more overlap. By type, flood of 0.5m or more accounts for 45.7%, liquefaction 40.5% and tsunami 17.5%, while landslide is only 0.4%. What characterizes the location of urban hotels, it can be said, is the overlap of flood and liquefaction. Alluvial lowlands and reclaimed land are also where railways and commerce cluster: in Fukuoka (Hakata/Tenjin) 70.7% of rooms, and at Nagoya Station 56.4%, fall under both flood and liquefaction.
The differences between trade areas are large. In Hiroshima (Hatchobori/Station) and Kochi (Harimayabashi), every room is inside one of the areas, directly reflecting a landform in which the city spreads across the deltas of the Ota and Kagami rivers. Osaka Umeda stands at 94.8% and Yokohama (Kannai/Minato Mirai) at 92.9%, both with tsunami and liquefaction added. In contrast, Sendai Station is at 0.0%, Shinjuku at 0.1% and Osaka Namba at 14.7%. These are trade areas where lodging is clustered on uplands and terraces. However, there is no visible correspondence between being inside or outside an area and the level of ADR. Median ADR is ¥11,900 in Umeda, where the share inside any area exceeds 90%; ¥15,400 in Shinjuku, which is almost entirely outside; and ¥19,200 around Tokyo Station, at 66.1%. Rates are determined by the depth of demand. Risk areas are best read not as an indicator of whether a location is good or bad, but as a design condition that determines the order in which equipment is added.
Priorities by Risk Category — “Placement” in Inundation Areas, “Water” in Liquefaction Areas, “Power” Outside the Areas
So which equipment is most effective to add first? Even the same generator works differently depending on where it is located. If the generator and fuel tank are placed in the basement or on the first floor in a place where inundation is expected, they may be unusable at the critical moment, and on liquefaction-prone ground, restoring buried water, sewer and gas pipes tends to take time. We have set out the equipment to tackle first for each of the four risk categories.
| Risk category | Rooms in the 16 trade areas | What tends to fail first | Equipment to add first | Key design point |
|---|---|---|---|---|
| Flood 0.5m+ | 151,920 rooms (45.7%) | Substation equipment, generators and pumps in the basement and on the first floor | 1. Electrical equipment on upper floors; 2. Portable generator (stored on an upper floor) + storage battery; 3. Elevated receiving water tank | The starting point is whether equipment can be placed above the assumed inundation depth. Areas of 3m or more hold 28,326 rooms (8.5%) |
| Tsunami | 58,241 rooms (17.5%) | All equipment on lower floors; surrounding roads | 1. Placement on upper floors; 2. Fuel self-reliance through an LP gas bulk tank or storage battery; 3. Three days of water | Assume fuel resupply routes are cut, and cover 72 hours from stockpiles alone |
| Liquefaction | 134,628 rooms (40.5%) | Buried water and sewer pipes and city gas pipes | 1. Larger receiving water tank; 2. LP gas bulk tank (alternative heat source); 3. Generator | Water and drainage stop even if the building is sound. Consider together with flexible piping |
| Landslide | 1,169 rooms (0.4%) | Service drop lines; access roads | 1. Larger stockpiles of fuel and water; 2. Portable generator | Limited in urban trade areas. Weighs more heavily in onsen areas and mountain districts |
| Outside all areas | 135,799 rooms (40.8%) | Wide-area blackouts (occur regardless of location) | 1. Upgraded generator and 72 hours of fuel; 2. Storage battery; 3. Shelter agreement | Building and equipment are likely to survive, giving high value as a shelter base |
In flood and tsunami areas, deciding where to put equipment comes before buying it. We have separately estimated the cost of moving substation equipment to upper floors at ¥30,000–250,000 per room, and this should be considered together with the basic set in this article. Because portable generators can be stored on upper floors or the roof, they can be an option that takes effect before permanent units in inundation areas. In liquefaction areas, it is worth assuming situations where water stays off longer than electricity. Additional cost for a receiving water tank can be contained by adding capacity at the regular replacement cycle, while a well presupposes confirmation of ground conditions. Our analysis of liquefaction and room stock in Niigata’s Chuo Ward found that even on liquefaction-prone ground, no difference appears in ADR.
On the other hand, the 135,799 rooms (40.8%) that fall under none of the four risks are the segment where the effect of resilience investment shows up most directly. Because the building and equipment are less likely to be damaged, the likelihood of continuing to operate is high as long as power and water are self-reliant, and the property’s role as a shelter base stands out when surrounding facilities have stopped. In trade areas such as Sendai Station and Shinjuku, the combination of 72-hour power and a shelter agreement can be said to be effective.
How to Think About Payback — The Basic Set Balances at 1.2–4.7 Events, While Years Range From 5.5 to More Than 80
Finally, we consider payback on the investment through three routes. The first is revenue preserved when the hotel can keep operating during power and water outages. Assuming the 16-trade-area median ADR of ¥13,200 (N=1,967 properties) and occupancy of 75.3% (full year; the business hotel average in the Japan Tourism Agency’s 2025 final figures), room revenue for the 100-room model is about ¥1 million per day, and about ¥2 million for 200 rooms. If independent power and water supply avoid a three-day closure, about ¥2.99 million of revenue is preserved for 100 rooms; for seven days, about ¥6.98 million. Dividing the Capex of the basic set by these amounts, the investment balances at 1.2–4.7 disaster events without subsidies, and at 0.6–2.4 events after applying a 1/2 subsidy rate.
The second is insurance. Flood premium rates for fire insurance have been subdivided according to regional risk since the October 2024 revision. The annual cash effect, however, is small. If property and casualty insurance premiums are put at ¥4,000 per room per year (an editorial rule of thumb obtained by dividing the premiums stated in listed hotel REITs’ securities reports by the number of rooms held), then even if equipment measures produce a 5–10% difference, the amount is ¥20,000–40,000 a year for 100 rooms. PML (an indicator expressing the scale of damage a building suffers in an earthquake as a ratio of replacement cost) measures damage to the building, so adding emergency power does not move PML itself. The insurance and PML route is thought to work less through rates than through the qualitative side: how business continuity is described in engineering reports and loan screening.
The third is payment for sheltering under an agreement. Use of hotels and ryokan as evacuation shelters under the Disaster Relief Act is capped at ¥10,000 per person per night including tax (not including meals), so accommodating two people each in half of 100 rooms yields up to ¥1 million per day in room charges alone. The Cabinet Office guidelines call for amounts below normal room rates, so this will not exceed ordinary room revenue (about ¥1 million), but it serves as a floor that secures occupancy even when tourism and business travel demand stops. Because it uses the same rooms as the first route, the two cannot be added together, but it means having two exits: normal sales if demand remains, sheltering if it stops.
| Item | Scenario A (short payback) | Scenario B (middle) | Scenario C (long payback) |
|---|---|---|---|
| Event frequency (events involving power and water outages) | Once every 10 years | Once every 20 years | Once every 20 years |
| Closure days avoided | 7 days | 7 days | 3 days |
| Capex | Lower bound of range, 1/2 subsidy applied | Median of range, no subsidy | Upper bound of range, no subsidy |
| Insurance premium difference (against ¥4,000 per room per year) | 10% | 7.5% | 5% |
| ADR and occupancy | ADR ¥13,249 (property median for the 16 trade areas, N=1,967); occupancy 75.3% (full year; Japan Tourism Agency 2025 final figures, business hotels). Room revenue only | ||
| Payback period, basic set, 100 rooms | 7.4 years | 33.1 years | 83.8 years |
| Payback period, basic set, 200 rooms | 5.5 years | 26.6 years | 70.6 years |
| Payback period, extended set, 100 rooms | 13.2 years | 77.4 years | Over 100 years |
| Payback period, extended set, 200 rooms | 11.8 years | 60.2 years | Over 100 years |
Once an event frequency is assumed and the result converted to years, the outcomes spread widely. For the basic set, Scenario A — using subsidies and assuming one event every 10 years with a 7-day closure avoided — gives 7.4 years for 100 rooms and 5.5 years for 200 rooms, while Scenario C — no subsidy, one event every 20 years and 3 days — exceeds 70 years. The extended set takes 12–13 years even in Scenario A. To sum up so far, expected value alone can explain payback only up to “the basic set with subsidies”; investment beyond that has to be measured by value other than preserved revenue. With construction costs continuing to rise, the fact that building the equipment in at the time of new construction or major renovation makes it easier to contain costs than adding it later should also be factored into the decision.
That value is the valuation of the property as an asset. A hotel equipped with independent power and water supply that has concluded a shelter agreement with its municipality can demonstrate business continuity in numbers and in writing during due diligence at the time of sale. As Table 5 shows, 60% of rooms in the 16 trade areas are inside one of the risk areas, and being located inside an area has itself become a standard condition for urban hotels. What makes the difference is likely to be less whether a property is inside or outside an area than how much preparation it has built up against that condition. Resilience investment is positioned less as recovering a cost than as upside that makes an asset more likely to be chosen within the same trade area.
Sensitivity Analysis — What Drives the Payback Period Is “Closure Days Avoided” More Than Event Frequency
| Event frequency \ Days avoided | 3 days | 5 days | 7 days | 10 days |
|---|---|---|---|---|
| Once every 5 years | 20.0 / 10.0 years | 12.2 / 6.1 years | 8.8 / 4.4 years | 6.2 / 3.1 years |
| Once every 10 years | 38.1 / 19.0 years | 23.7 / 11.9 years | 17.2 / 8.6 years | 12.2 / 6.1 years |
| Once every 20 years | 69.8 / 34.9 years | 44.9 / 22.4 years | 33.1 / 16.5 years | 23.7 / 11.9 years |
| Once every 30 years | 96.7 / 48.3 years | 63.9 / 32.0 years | 47.7 / 23.9 years | 34.6 / 17.3 years |
| Once every 50 years | 139.6 / 69.8 years | 96.7 / 48.3 years | 73.9 / 37.0 years | 54.7 / 27.3 years |
Moving the assumptions along two axes shows that what drives the payback period is the number of closure days avoided per event, more than event frequency. Even assuming one event every 20 years, extending the days avoided from 3 to 10 shortens payback from 69.8 years to 23.7 years without subsidies, and to 11.9 years when combined with a 1/2 subsidy rate. Water and fuel reserves that allow operations to continue beyond 72 hours directly raise the efficiency of payback. Conversely, if event frequency is set at once every 50 years, payback takes more than 27 years even with subsidies, so the cases where expected value alone can justify the investment are limited to locations where power and water outages are expected about once every 10 years, or equipment configurations that allow a long period of closure to be avoided.
Conclusion — Add the Increment Beyond the Mandatory Line in an Order That Fits the Location
The power that the law requires of hotels covers 30–60 minutes; continuing operations for 72 hours and sheltering people belong to the domain of voluntary investment. That investment came to ¥10.88–14.21 million for 100 rooms, or ¥109,000–142,000 per room, for the basic set of a portable generator, a storage battery and a larger receiving water tank. In the 16 trade areas, 59.2% of rooms are inside a flood, tsunami, landslide or liquefaction area, and it can be said to be effective to start with placement in inundation areas, water in liquefaction areas, and power and agreements outside the areas. Payback is at a level that balances at 1.2–4.7 disaster events, and becomes shorter the more subsidies and shelter agreements are combined. Properties with generators or receiving water tanks approaching replacement would do well to estimate the increment for 72-hour capacity before replacing them at the same capacity.
Note on the estimates: The Capex, maintenance costs and payback periods in this article are simplified estimates based on price information publicly available as of the survey date (October 3, 2026) and on certain assumptions, and will vary with installation conditions, specifications and whether subsidy applications are approved. Disaster risk is determined by overlaying each property’s location coordinates on public layers and does not assess the safety of individual buildings or their likelihood of being damaged. Subsidy schemes change their requirements and application periods each fiscal year, so please check the latest guidelines of each implementing body when applying.
References and Sources
■ Data sources
2,711 properties with 332,483 rooms located within a 1.5km radius of the center point of 16 trade areas nationwide, with 10 or more rooms, for which selling prices were observed on OTAs between September 2025 and August 2026 (compiled by MetroEngines Research & Consulting, based on listings on major booking sites). Estimated settled ADR is the monthly average for the same period and the median of the 1,967 properties for which an estimate was obtained. Disaster risk is determined by overlaying each property’s location coordinates on the MLIT Real Estate Information Library’s assumed flood inundation areas (maximum assumed scale, inundation depth of 0.5m or more), assumed tsunami inundation, sediment disaster warning areas and liquefaction tendency map (top two classes) (data as of October 3, 2026). Laws are from e-Gov Laws and Regulations Search; equipment unit prices are from published list prices and public market-rate information.
■ Estimation assumptions
Two models of 100 and 200 rooms. Basic set = portable generator + storage battery (20kWh for 100 rooms, 40kWh for 200 rooms) + larger receiving water tank (12㎥ / 24㎥); extended set = permanent diesel generator + storage battery + receiving water tank + deep well + LP gas bulk tank. Generators are at unit price (excluding tax) and do not include installation work. Payback period = Capex ÷ (room revenue preserved per event × annual probability of an event + insurance premium difference). Room revenue is ADR ¥13,249 × occupancy 75.3% (full year; the business hotel average in the Japan Tourism Agency’s 2025 final figures) × number of rooms; insurance premiums assume a 5–10% difference against ¥4,000 per room per year. Scenarios A–C are set with an event frequency of once every 10–20 years and 3–7 closure days avoided, and Table 8 widens these to a frequency of 5–50 years and 3–10 days.
■ Limitations and caveats
Equipment unit prices vary widely with installation site, delivery conditions and specifications, and for permanent generators there is roughly a fourfold gap between the market-rate lower bound and the list-price upper bound. The payback estimates cover room revenue only and do not include food and beverage and banquet revenue, maintenance costs (¥370,000–970,000 per year per generator), shelter payments, or the effect of avoiding building damage. Disaster risk refers to being inside or outside areas premised on the maximum assumed scale and the like, and does not indicate probability of occurrence or the safety of individual buildings. Trade areas are cut out by radius from a center point and do not match statistics for administrative districts. Subsidy schemes change their requirements and application periods each fiscal year.
■ Market data
- MetroEngines Research & Consulting — Property locations and room counts in the 16 trade areas (N=2,711 properties, 332,483 rooms), estimated settled ADR (September 2025–August 2026, N=1,967 properties), Capex and payback estimates
■ Laws, government statistics and public data
- e-Gov Laws and Regulations Search, “Order for Enforcement of the Fire Service Act” (消防法施行令) (Art. 11 indoor fire hydrant equipment, Art. 12 sprinkler equipment, Appended Table 1)
- e-Gov Laws and Regulations Search, “Enforcement Regulations of the Fire Service Act” (消防法施行規則) (Art. 12 emergency power sources, Art. 24 automatic fire alarm systems)
- e-Gov Laws and Regulations Search, “Building Standards Act” (建築基準法) (Art. 34, para. 2, emergency elevators)
- e-Gov Laws and Regulations Search, “Order for Enforcement of the Building Standards Act” (建築基準法施行令) (Art. 126-3, Art. 126-4, Art. 129-13-3)
- Tokyo Fire Department, “Inspection of Private Generating Equipment” (自家発電設備の点検) (June 2018 revision of inspection standards)
- MLIT Real Estate Information Library (不動産情報ライブラリ) — Assumed flood inundation areas (maximum assumed scale), assumed tsunami inundation, sediment disaster warning areas, liquefaction tendency map based on landform classification
- Cabinet Office, “Guidelines for Using Hotels, Ryokan, etc. as Evacuation Shelters in a Disaster” (December 2025)
- Cabinet Office, “Use of Hotels and Ryokan and Initiatives for Evacuation Shelters Other Than Designated Shelters” (5th meeting of the study group on support responding to changes in the evacuation living environment, November 22, 2023)
- Liaison council on measures for commuters stranded by a Tokyo inland earthquake, “Guidelines for Securing and Operating Temporary Shelter Facilities”
- Tokyo Metropolitan Government Disaster Prevention website, “Tokyo Metropolitan Ordinance on Measures for Stranded Persons”
- LP Gas Center of Japan (エルピーガス振興センター), “Self-Reliant Fuel Stockpiling Subsidy (Disaster-Ready LP Gas Bulk Tanks, Petroleum Product Tanks, etc.), FY2025 Supplementary Budget and FY2026: Application Guide” (May 2026)
- METI, “FY2024 Study Group on Expanding the Use of Stationary Storage Battery Systems: Summary of Results” (March 7, 2025)
- MLIT and METI, “Guidelines for Flood Countermeasures for Electrical Equipment in Buildings” (June 2020)
- Japan Tourism Agency, “Overnight Travel Statistics Survey” (宿泊旅行統計調査) — 2025 annual final figures (business hotel occupancy 75.3%, full year)
■ Industry associations and public information on equipment prices
- Nippon Engine Generator Association (日本内燃力発電設備協会), “NEGA News,” June 2019 issue, “Regulations on the Installation of Private Generating Equipment under the Building Standards Act, Part 2”
- Kensetsu Plaza, “Diesel Generator Prices and Unit Prices: Sekisan Shiryo Published Price Edition” (posted October 2026)
- Denzai Zeus, “What Are the Market Prices for Emergency Generators? From Rough Estimates by Capacity to Installation Work”
- Iwatani, “Which Fuel Is Better for Emergency Generators? The Differences Between LP Gas and Diesel”
- Azuma Sangyo, “Costs and Actual Cases of Receiving Water Tank Replacement Work”
- Mizu-Log, “How Much Does It Cost to Dig a Well? Market Rates for Shallow and Deep Wells and How to Keep Costs Down”
- Toyo Aquatech, “Groundwater Utilization System: Case Studies”
- Nora Communications, “Disaster-Ready LP Gas Bulk Tanks for Public Facilities”
- Logiative, “What Are the Market Rates for Emergency Generator Inspection Costs?”