

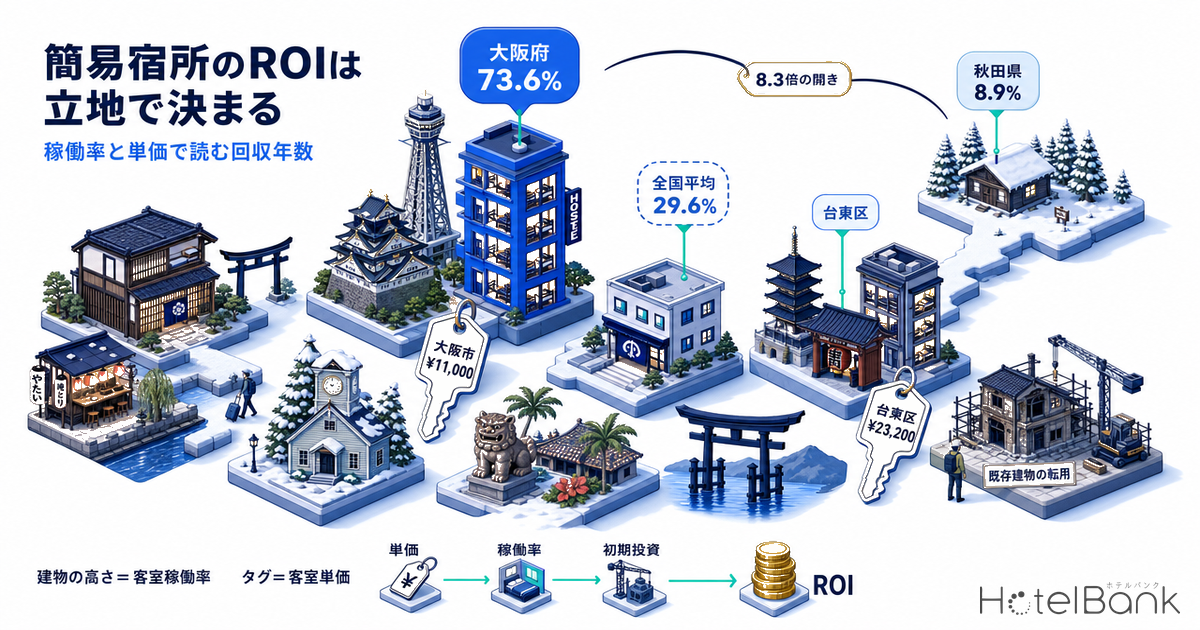
An investment decision on a kani-shukusho (簡易宿所, Japan’s “simple lodging” licence category that covers guesthouses and hostels) ultimately comes down to only three variables: room rate, occupancy, and upfront investment. The first two can be measured from public data, but the third varies by an order of magnitude from property to property and cannot be generalised. This article turns that structure to its advantage and builds an ROI model that treats the upfront investment not as an “answer” but as a “ceiling to be solved for”. In the 2025 final figures released by the Japan Tourism Agency on July 6, 2026, the national room occupancy of simple lodgings was 29.6%. But using that number as a uniform nationwide assumption for investment decisions is almost certain to mislead. Broken down by prefecture, occupancy ranges 8.3-fold, from 73.6% in Osaka to 8.9% in Akita, and within that range the payback period falls on both sides of the line between viable and non-viable.
Metric Definitions Used in This Article
- Room occupancy (actual): Room occupancy by property type from the Japan Tourism Agency’s Overnight Travel Statistics Survey. Unless otherwise noted, this article uses the final annual figures for January–December 2025.
- Bed (capacity) occupancy (actual): Capacity occupancy from the same survey. It measures utilisation against guest capacity rather than room count, capturing empty beds in shared and multi-guest rooms.
- Lowest listed plan level: The price of each property’s cheapest publicly listed plan on OTAs and similar channels (2 guests per room, per-room rate, tax included), averaged by month for each property, with the median taken across the market. The room rate in this article’s ROI model uses this level.
- Listed price (all-plan average, tax included): The published price averaged across all plans from room-only to meal-inclusive (2 guests per room, per room). Shown alongside for reference.
- ADR (average daily rate): An estimated settled rate (tax-excluded equivalent) calculated by applying a segment-specific adjustment factor to each property’s lowest listed plan level on OTAs. Against property-level actuals disclosed by listed hotel REITs (184 property-months, April–May 2026), the median error is 7.5%. However, this estimated settled ADR has been validated only for five segments — business, city, resort, ryokan and capsule — and cannot be applied to the guesthouse/hostel segment covered in this article. This article therefore does not call prices in this segment “ADR” and treats them as the lowest listed plan level.
- Occupancy (assumption): A hypothetical value set for modelling purposes, not a measured value.
- GOP (gross operating profit): Room revenue minus operating costs (assumed values). Shown in this article as an annual amount per room.
- ROI = annual GOP ÷ upfront investment. Simple payback period = upfront investment ÷ annual GOP (a simple calculation that ignores interest, taxes, depreciation and exit value).
- Data sources: Prices from MetroEngines Research & Consulting; occupancy from the Japan Tourism Agency’s Overnight Travel Statistics Survey; facility counts from the Ministry of Health, Labour and Welfare’s Report on Public Health Administration and Services; land prices and floor-area ratios from the MLIT Real Estate Information Library.
The ROI Skeleton — Two Variables You Can Measure, One You Cannot
Simple-lodging ROI can be decomposed as follows.
ROI = Annual GOP ÷ Upfront investment
Annual room revenue (per room) = 365 days × occupancy × room rate
Annual GOP (per room) = room revenue − (room revenue × commission rate) − (365 × occupancy × cleaning cost) − fixed operating cost
Simple payback period = upfront investment ÷ annual GOP
Of these, room rate and occupancy can be measured from public data. For upfront investment and operating costs, however, we have no measured data. This article therefore sets all of them explicitly as “assumptions” and presents them in a form readers can replace with their own figures. We do not treat assumptions as if they were measured values.
Operating cost assumptions (per room)
| Item | Assumption | Type | Includes |
|---|---|---|---|
| Booking & payment commissions | 12% of room revenue | Variable | Distribution commissions, payment fees |
| Cleaning & linen | ¥3,500 per occupied room-night | Variable | Room cleaning, linen change, amenities |
| Fixed operating cost | ¥600,000 per room per year | Fixed | Labour, utilities, maintenance, insurance, telecoms, property taxes |
| Upfront investment | Solved for | — | Not fixed; the ceiling is derived from the target ROI |
None of these items are backed by our own measured data; they are assumptions for modelling. Actual figures vary widely by property size, operating model and location / Source: MetroEngines Research & Consulting
The key point of this setup is that fixed operating cost is charged as a flat amount per room. Because fixed costs do not fall when occupancy drops, GOP thins out rapidly at low-occupancy, low-rate combinations. The non-linear sensitivity discussed later comes from here.
Reading the 29.6% Occupancy — Only 6 of the 32-Point Gap Is Specific to Simple Lodging
In the 2025 final figures, room occupancy across all property types was 61.6%, versus 29.6% for simple lodgings — a gap of 32.0 points. It would be premature to read that gap as meaning “simple lodging is a structurally unfillable format”. Looking at the same survey’s breakdown by number of employees, properties with 0–9 employees average only 35.6% across all property types. By contrast, properties with 10–29 employees reach 70.4%, 30–99 employees 71.5%, and 100 or more 70.8% — the level jumps once staff numbers pass 10.
Simple lodgings are almost without exception small properties with 0–9 employees. The right comparison is therefore 35.6%, not 61.6%, and the gap specific to simple lodging is only 6.0 points. Most of the 32 points can be attributed to scale, not format. Put the other way, the scale factor is something that property selection and operating design can move.
Source: Compiled by MetroEngines Research & Consulting from the Japan Tourism Agency’s Overnight Travel Statistics Survey, 2025 annual final figures
Bed occupancy is the other number not to overlook. The bed occupancy of simple lodgings is 16.2%, a ratio of 54.7% to its 29.6% room occupancy. In other words, even rooms that are sold fill only a little over half of their guest capacity. The same ratio is 80.9% for business hotels (60.9% ÷ 75.3%) and 65.9% overall, showing that simple lodging has relatively large amounts of empty beds in multi-guest and shared-room inventory. This article’s model, which uses a room rate based on 2 guests per room, does not include the upside from filling those beds. A design that can put 3 or more guests in a room can add revenue at the same occupancy.
Osaka 73.6%, Akita 8.9% — An 8.3-Fold Spread Across Prefectures
The danger of using the 29.6% national average as an investment assumption becomes visible the moment you break it down by prefecture. Osaka leads at 73.6%, almost level with the 75.3% national average for business hotels. Next come Kyoto at 52.0%, Tokyo at 48.6% and Fukuoka at 44.8%. At the bottom, Akita (8.9%), Saga (9.6%) and Tottori (10.0%) sit around 10%. The top-to-bottom ratio is 8.3x. The prefecture that exactly matches the 29.6% national average is Kagawa — the average is not “typical”, merely the midpoint of the distribution.
Source: Compiled by MetroEngines Research & Consulting from the Japan Tourism Agency’s Overnight Travel Statistics Survey, 2025 annual final figures
Overlaying supply-side figures makes the meaning of this distribution even clearer. According to the Ministry of Health, Labour and Welfare’s Report on Public Health Administration and Services, there were 44,901 simple-lodging businesses nationwide as of the end of FY2024 (Reiwa 6). That is 45.7% of all 98,338 licensed lodging businesses, up 7.1% year on year — faster than ryokan/hotel businesses (52,946 facilities, up 3.7%). By prefecture, Nagano (4,361), Okinawa (3,804), Kyoto (3,647) and Hokkaido (3,314) lead, with tourist-destination clusters — including mountain huts, pensions and converted holiday homes — standing out.
By contrast, Osaka, the occupancy leader, has just 773 facilities, Fukuoka 400 and Aichi 158: urban simple-lodging stock is surprisingly thin. Nagano holds 5.6 times as many facilities as Osaka yet runs at 13.6% occupancy. A large facility count does not signal strong demand; in highly seasonal locations it even appears inversely correlated. The obvious conclusion — that the first step in an investment review is not “how many facilities are in which prefecture” but “what is this area’s year-round occupancy” — is confirmed by the numbers as well.
Seasonality — Troughs of 24.5% in December vs 39.1% in August Squeeze Fixed Costs
Looking only at the annual average hides another pitfall. In 2025, simple-lodging monthly room occupancy peaked at 39.1% in August, with troughs of 24.5% in December and 25.1% in January. The swing is 14.6 points, an asymmetric shape running at most 32% above and 17% below the annual average. The swing itself is similar to all properties combined (high 66.6% in October, low 54.6% in January, a 12.0-point swing) and business hotels (81.4% and 66.6%, 14.8 points), but because simple lodging starts from a much lower level, recovering fixed costs becomes structurally difficult in the trough months.
Source: Compiled by MetroEngines Research & Consulting from the Japan Tourism Agency’s Overnight Travel Statistics Survey, 2025 monthly final figures
Annualised ROI smooths out the monthly bumps, but cash flow does not. If fixed operating cost is set at ¥50,000 per room per month (the ¥600,000 annual assumption divided by 12), then in a month with 24.5% occupancy and a ¥12,000 rate, the contribution margin per room (rate × 88% − ¥3,500 cleaning) is about ¥1,730 per day, or roughly ¥52,600 per month. After fixed costs, only about ¥2,600 remains. Even when operating multiple rooms, margins this thin feed directly into working-capital planning.
Actual Rates in 8 Markets — Measuring the Guesthouse/Hostel Price Band
Next, room rates. From the roughly 168,000 properties we track in Japan, we took those with confirmed OTA activity, extracted properties classified in the guesthouse and hostel segments by city, averaged each property’s lowest listed plan level by month for the 12 months from September 2025 to August 2026, and took the median within each market. The sample covers 537 properties with at least six months of price observations.
There is a basis for adopting the lowest listed plan level as the room-rate assumption. For segments where the estimated settled ADR has been validated (business hotels and capsule hotels), a comparison across 464 properties in the same six cities found that the median ratio of estimated settled ADR to the lowest listed plan level was 1.05x, versus 0.64x against the all-plan average. In other words, the lowest listed plan level is very close to the settled level, while using the all-plan average would overstate actual rates by about 60%. That is why this article adopts the conservative metric.
| Market | Properties observed |
Lowest listed plan level |
Listed price (all-plan avg.) |
Room occupancy (prefecture, 2025 final) |
Room revenue /room/year |
GOP /room/year |
Max viable upfront investment/room |
|---|---|---|---|---|---|---|---|
| Tokyo – Taito Ward | 60 | ¥23,200 | ¥33,400 | 48.6% | ¥4,118,000 | ¥2,403,000 | ¥24,031,000 |
| Tokyo – Shinjuku Ward | 30 | ¥21,700 | ¥30,400 | 48.6% | ¥3,858,000 | ¥2,174,000 | ¥21,741,000 |
| Kyoto City | 67 | ¥16,700 | ¥22,700 | 52.0% | ¥3,171,000 | ¥1,526,000 | ¥15,260,000 |
| Osaka City | 58 | ¥11,000 | ¥17,500 | 73.6% | ¥2,965,000 | ¥1,069,000 | ¥10,692,000 |
| Fukuoka City | 128 | ¥14,800 | ¥27,000 | 44.8% | ¥2,416,000 | ¥954,000 | ¥9,542,000 |
| Sapporo City | 44 | ¥16,100 | ¥25,900 | 25.2% | ¥1,480,000 | ¥381,000 | ¥3,808,000 |
| Naha City | 108 | ¥8,100 | ¥11,600 | 34.7% | ¥1,026,000 | Below assumed operating costs | — |
| Hiroshima City | 42 | ¥12,800 | ¥17,600 | 19.1% | ¥893,000 | Below assumed operating costs | — |
Prices: 537 properties in the guesthouse and hostel segments, 12 months from September 2025 to August 2026, market median (2 guests per room, per room, tax included) / Occupancy: prefecture-level simple-lodging values from the Japan Tourism Agency’s Overnight Travel Statistics Survey, 2025 final / Max viable upfront investment: solved for a 10% target ROI / Source: MetroEngines Research & Consulting, Japan Tourism Agency
An important caveat applies here. Rates are measured at the city/ward level, but occupancy is a prefecture-level statistic. In prefectures such as Osaka and Kyoto, where demand is concentrated in the core city, the mismatch is small; but in Okinawa (3,804 simple lodgings, many on outlying islands and in resort locations) and Hiroshima (733 facilities), prefecture-wide occupancy likely understates actual performance in central Naha and Hiroshima. The two cities show negative GOP because the prefectural average is being applied to city-level rates — it does not mean “simple lodging is not viable in Naha or Hiroshima”. If city-level occupancy can be obtained separately, the assessment of both cities has room to improve.
Source: MetroEngines Research & Consulting (prices, n=537 properties); Japan Tourism Agency, Overnight Travel Statistics Survey, 2025 final figures (occupancy)
The scatter plot shows a simple fact: no market combines high occupancy with a high rate. Osaka City runs at 73.6% occupancy but its rate of ¥11,000 is close to the lowest of the eight markets. Taito Ward commands ¥23,200 but runs at 48.6%. Their GOP differs by 2.2x, and the rate side accounts for most of that. In a structure where fixed operating cost is charged as a flat amount, rate tends to move GOP more than occupancy does. Where hostels and guesthouses in this price band cluster within Greater Tokyo varies sharply by ward — Taito has 150 such properties against 27 in Shibuya.
Circle size = number of properties with price observations; colour = prefectural simple-lodging room occupancy (2025 final) / Source: MetroEngines Research & Consulting, Japan Tourism Agency, CartoDB (map tiles)
Sensitivity — How the Payback Period Moves with Occupancy × Rate
Holding the assumptions fixed, the chart below shows how the simple payback period (for an upfront investment of ¥5 million per room) changes as occupancy and room rate vary. Where a line is missing, that combination cannot pay back within 30 years.
Modelled on assumptions of ¥5,000,000 upfront investment per room, 12% commission, ¥3,500 cleaning per occupied room-night and ¥600,000 fixed operating cost per room per year / Source: MetroEngines Research & Consulting
The shape of the curves shows that ROI is determined not by the product of occupancy and rate, but by the residual after fixed costs. The ¥8,000 line does not appear within 30 years until occupancy reaches 60%. At ¥24,000, by contrast, payback arrives in 6.1 years even at 22% occupancy. Organising this asymmetry as break-even occupancy gives the following.
| Room rate (assumption) | Break-even occupancy | GOP/room/year at 30% occupancy | Max viable upfront investment/room at 30% (10% target ROI) |
|---|---|---|---|
| ¥8,000 | 46.4% | −¥212,000 | Not viable |
| ¥10,000 | 31.0% | −¥20,000 | Not viable |
| ¥12,000 | 23.3% | ¥173,000 | ¥1,731,000 |
| ¥14,000 | 18.6% | ¥366,000 | ¥3,658,000 |
| ¥16,000 | 15.5% | ¥559,000 | ¥5,585,000 |
| ¥20,000 | 11.7% | ¥944,000 | ¥9,440,000 |
| ¥24,000 | 9.3% | ¥1,329,000 | ¥13,294,000 |
Break-even occupancy = ¥600,000 fixed operating cost per room per year divided by the contribution margin (rate × 88% − ¥3,500 cleaning), converted to a 365-day basis / Source: MetroEngines Research & Consulting
The practical implication is clear. If you assume the 29.6% national average occupancy, the room rate must exceed roughly ¥10,300 just to cover assumed operating costs. Even using the 35.6% small-property average, the floor is still ¥9,200. Conversely, in a market like Osaka City where 73.6% occupancy can be expected, the floor drops to ¥6,500. Where rate is hard to achieve, occupancy has to carry the model; where occupancy is hard to achieve, rate has to — unless one of them clears a certain level, the model does not stand up.
Checking the Investment Ceiling Against Land and Construction Costs — Why New Builds Are Not Chosen
We now have the maximum upfront investment each market can support. Let us test it against actual land and building costs. According to MLIT’s Building Construction Starts Statistics, the planned construction cost of accommodation-use buildings in 2024 was ¥591,279 per square metre of floor area (about ¥1.955 million per tsubo), up 41.1% in two years from ¥419,163 in 2022. At 30 m² per room including common areas, construction alone comes to about ¥17.74 million per room.
For land, we aggregated commercial-land survey points in the centre of each market (within a radius of about 2 km) from the 2026 official land prices (chika koji) in the MLIT Real Estate Information Library. Combining these with the median floor-area ratio gives the following land cost per room. Note that official land prices do not match actual transaction prices: a check of 394 transactions across 10 commercial districts found commercial land trading at 0.86x the official price, so these figures should be discounted accordingly.
| Market | Commercial land price median (¥/m²) |
YoY | Floor-area ratio median |
Land/room | Construction/room | New-build total/room | Gap vs viable ceiling |
|---|---|---|---|---|---|---|---|
| Tokyo – Taito Ward | 1,600,000 | +18.7% | 600% | ¥8,000,000 | ¥17,738,000 | ¥25,738,000 | −¥1,708,000 |
| Tokyo – Shinjuku Ward | 2,750,000 | +15.3% | 500% | ¥16,500,000 | ¥17,738,000 | ¥34,238,000 | −¥12,498,000 |
| Kyoto City | 1,250,000 | +11.4% | 400% | ¥9,375,000 | ¥17,738,000 | ¥27,113,000 | −¥11,853,000 |
| Osaka City | 1,735,000 | +15.6% | 600% | ¥8,675,000 | ¥17,738,000 | ¥26,413,000 | −¥15,722,000 |
| Fukuoka City | 1,675,000 | +9.9% | 400% | ¥12,563,000 | ¥17,738,000 | ¥30,301,000 | −¥20,759,000 |
| Sapporo City | 697,500 | +7.1% | 400% | ¥5,231,000 | ¥17,738,000 | ¥22,970,000 | −¥19,162,000 |
| Naha City | 412,500 | +6.8% | 350% | ¥3,536,000 | ¥17,738,000 | ¥21,274,000 | — |
| Hiroshima City | 695,000 | +5.3% | 500% | ¥4,170,000 | ¥17,738,000 | ¥21,908,000 | — |
Land prices and floor-area ratios are medians of 2026 official land price commercial survey points (within about 2 km of each market’s centre, n=16–79 points) / Construction cost is the 2024 planned construction cost for accommodation-use buildings of ¥591,279/m², with an assumed 30 m² per room including common areas / Source: Compiled by MetroEngines Research & Consulting from the MLIT Real Estate Information Library and Building Construction Starts Statistics
The result is consistent. In every one of the eight markets, building a new simple lodging on central commercial land falls short of a 10% target ROI. Even in Taito Ward, the most favourable market, a gap of ¥1.71 million per room remains, while Shinjuku Ward, Osaka City and Fukuoka City show gaps of ¥12–21 million. Construction cost of ¥17.74 million alone consumes 74% of Taito Ward’s ¥24.03 million viable ceiling.
This check explains why simple-lodging stock has grown through conversions of vacant houses, machiya townhouses and existing mixed-use buildings. Since new builds do not work, whether you can convert an existing building acquired well below new-build cost, while keeping renovation costs down, is the watershed for ROI. Put the other way, at a 10% target ROI the combined ceiling for acquisition + renovation + fixtures is ¥24 million per room in Taito Ward, ¥15.26 million in Kyoto City and ¥10.69 million in Osaka City. Once an acquisition price above that line is on the table, the numbers only work if operations beat the assumptions on either occupancy or rate. When acquiring an existing building, also note that whether the business licence can be succeeded feeds directly into the schedule and cash flow — licence succession differs by deal structure (asset purchase, business transfer or share acquisition).
Regulation — Simple Lodging and Private Lodging (Minpaku) Have Different Denominators
The model so far assumes operation 365 days a year. Whether that assumption holds is the biggest reason to choose a simple-lodging licence.
Simple-lodging business requires a permit from the prefectural governor (or the mayor/ward head in cities with public health centres and special wards) under Article 3 of the Hotel Business Act (旅館業法), and the structural and equipment standards are set out in Article 1, Paragraph 2 of the Order for Enforcement of the Hotel Business Act. There are seven items: a total guest-room floor area of at least 33 m² (or at least 3.3 m² × the number of guests if the permit application specifies fewer than 10 guests); where bunk beds are installed, a vertical clearance of roughly 1 m or more between upper and lower tiers; adequate ventilation, lighting, illumination, damp-proofing and drainage; bathing facilities sufficient for demand, except where a public bath is nearby; likewise washing facilities; an adequate number of toilets; and compliance with standards set by prefectural ordinance.
What stands out is that simple lodging has no per-room minimum floor area, unlike the “7 m² per guest room (9 m² for rooms with beds)” requirement imposed on ryokan/hotel business. Instead, a floor of 33 m² is set on the total floor area of all guest rooms, and bunk beds are explicitly permitted. This enables designs with multiple beds per room, creating a structural revenue source that fits more guests into the same floor area. The 16.2% bed occupancy noted earlier is the flip side: this design headroom is still far from filled.
| Item | Simple lodging (Hotel Business Act) |
Ryokan/hotel (Hotel Business Act) |
Private lodging (minpaku) (Private Lodging Business Act) |
|---|---|---|---|
| Procedure | Permit | Permit | Notification |
| Annual operating days | No cap (365 days) | No cap (365 days) | Up to 180 days per year |
| Room area standard | Total guest-room floor area ≥ 33 m² (3.3 m² × guests if fewer than 10 guests) | ≥ 7 m² per guest room (≥ 9 m² for rooms with beds) | ≥ 3.3 m² per guest |
| Bunk beds | Explicitly permitted (roughly 1 m or more between tiers) | No provision | No provision |
| Additional local ordinance rules | Yes (Order Art. 1(2)(vii)) | Yes | Yes (area and period restrictions) |
| Meaning for the model | 365 days can be the denominator | 365 days can be the denominator, but the per-room area constraint is heavy | The denominator is halved to at most 180 days |
Source: Compiled by MetroEngines Research & Consulting from the Order for Enforcement of the Hotel Business Act (Cabinet Order No. 152 of 1957) and the Private Lodging Business Act
For this article’s ROI model, the difference is decisive. Because private lodging (minpaku) is limited to 180 days of provision per year, the same property at the same rate and occupancy has at most half the revenue denominator. In a structure where fixed operating cost is charged as a flat amount, halving the denominator does more than halve GOP — it pushes up the break-even point itself. According to the Japan Tourism Agency, cumulative private-lodging notifications stood at 65,837 as of July 15, 2026, of which 23,767 had been withdrawn, leaving 42,070 notified homes currently registered. More than a third of notifications have already closed.
In Osaka City, acceptance of new certification applications — and of change applications for adding rooms — under the National Strategic Special Zone foreign-visitor accommodation business (so-called “special-zone minpaku”) ended on May 29, 2026. Existing certified facilities may continue operating as before, but the route to launching a new short-stay accommodation facility in the city has effectively converged on a Hotel Business Act permit. Simple-lodging room occupancy is the highest in Japan at 73.6%, yet the prefecture’s facility count is thin for its size, at 773 facilities (572 of them in Osaka City). From both the regulatory and the supply-demand side, it is natural to see this market’s structure as shifting from 2026.
Summary — Decide on the Distribution, Not the Average
On simple-lodging ROI, this article draws the following five conclusions from public data.
First, the 29.6% occupancy cannot be used as an investment assumption. By prefecture it ranges 8.3-fold, from 73.6% in Osaka to 8.9% in Akita, and within that range the payback period falls on both sides of the viability line.
Second, most of the 32-point gap versus the 61.6% overall figure is due to scale. Properties with 0–9 employees average 35.6% regardless of type, so the gap specific to simple lodging is only 6.0 points.
Third, because fixed costs are charged as a flat amount, rate matters more than occupancy. Break-even occupancy falls quickly: 46.4% at ¥8,000, 15.5% at ¥16,000 and 9.3% at ¥24,000. Assuming the 29.6% national average occupancy, ¥10,300 is the minimum rate.
Fourth, new builds do not work. Adding land acquisition to the 2024 accommodation construction cost of ¥591,279/m² (¥17.74 million for a 30 m² room including common areas) exceeds the 10% target-ROI ceiling in all eight markets. Acquiring and converting existing buildings is effectively a precondition.
Fifth, being able to use 365 days as the denominator is the biggest economic reason to choose a simple-lodging licence. Under a fixed-cost structure, the 180-day cap on private lodging has an impact greater than halving revenue.
All upfront investment and operating cost figures in this article are assumptions, not measured values. Readers who plug their own property’s acquisition price, renovation cost and labour cost into the formula will get their own numbers within the same framework. When doing so, we recommend using measured values for the specific area under review — not national averages — for occupancy and rate. An average does not describe the reality of any actual location.
Frequently Asked Questions
Q. What is a typical ROI for a simple lodging (guesthouse/hostel)?
A. There is no single benchmark. Under this article’s assumptions (12% commission, ¥3,500 cleaning per occupied room-night, ¥600,000 fixed operating cost per room per year), an upfront investment of ¥5 million per room gives a simple payback of 5.3 years at 40% occupancy and a ¥16,000 rate, 13.7 years at 25% and ¥16,000, and is not viable at 30% and ¥8,000. Comparing ROI without stating the assumptions is meaningless.
Q. Which is better: a simple-lodging permit or private lodging (notification-based minpaku)?
A. If you plan to operate year-round, a simple-lodging licence. Private lodging is limited to 180 days of provision per year, and under a structure where fixed operating cost is charged as a flat amount, halving the revenue denominator pushes the break-even point up sharply. On the other hand, simple lodging is permit-based and requires compliance with the structural and equipment standards (Order for Enforcement of the Hotel Business Act, Article 1, Paragraph 2) and local ordinances.
Q. What is the minimum floor area needed for a simple-lodging permit?
A. Article 1, Paragraph 2, Item 1 of the Order for Enforcement of the Hotel Business Act requires a total guest-room floor area of at least 33 m². However, if the permit application specifies fewer than 10 guests, 3.3 m² × the number of guests is sufficient. There are also provisions on bathing facilities, washing facilities and toilets, and prefectures and other authorities may set additional standards by ordinance, so prior consultation with the competent public health centre is necessary.
Q. Which areas are most promising for investment?
A. Under this article’s assumptions, GOP per room is highest in Tokyo’s Taito Ward (¥2.40 million per room per year), followed by Tokyo’s Shinjuku Ward (¥2.17 million) and Kyoto City (¥1.53 million). However, this only means that higher-rate markets also have higher viable investment ceilings; whether the actual acquisition price falls below that ceiling depends on the property. In absolute occupancy terms Osaka stands out at 73.6%, while its simple-lodging stock is thin at 773 facilities.
Related Articles
- Lodging Supply Denominator: 44,901 Simple Lodgings Move Kyoto from 21st to 5th
- Simple Lodging × Vacant Home Reuse 2026: Whole-House Rental IRR in Kyoto, Osaka and Naha
References & Sources
■ Market data
- MetroEngines Research & Consulting — Listed prices in the guesthouse and hostel segments (8 markets, 537 properties, September 2025–August 2026); comparison with estimated settled ADR (464 properties in validated segments)
■ Government statistics and public data
- Japan Tourism Agency, Overnight Travel Statistics Survey, 2025 annual final figures (updated August 31, 2026) — Table 1 (facilities), Table 4 (guest nights), Table 6 (capacity occupancy), Table 8 (room occupancy)
- Ministry of Health, Labour and Welfare, Overview of the FY2024 (Reiwa 6) Report on Public Health Administration and Services — Chapter 4 Environmental Health, Table 8 (ryokan/hotel facilities and rooms; simple-lodging and boarding-house facilities)
- MLIT Real Estate Information Library — 2026 official land prices (commercial survey points, floor-area ratios)
- e-Stat, Building Construction Starts Statistics — by use and client / number of buildings, floor area, planned construction cost (statistical table ID 0003114490, accommodation use, 2024)
- e-Gov Law Search, Order for Enforcement of the Hotel Business Act (Cabinet Order No. 152 of 1957), Article 1
- Japan Tourism Agency Minpaku Portal, “Implementation status of the Private Lodging Business Act” (as of July 15, 2026)
- Osaka City, “National Strategic Special Zone Foreign-Visitor Accommodation Business (Special-Zone Minpaku)” — End of acceptance of new applications and change applications for adding rooms (May 29, 2026)
■ Maps
- CartoDB (map tiles), OpenStreetMap contributors
Note on the modelling: The upfront investment and operating costs in this article (commission rate, cleaning cost, fixed operating cost, floor area per room) are all items for which we have no measured data; they are assumptions for modelling purposes. Actual figures vary widely by property size, operating model, location and financing terms. The payback periods, ROI and maximum viable upfront investment shown are simplified estimates; actual investment decisions require a property-specific feasibility study. Room rates are measured values based on selling prices published on OTAs and similar channels at the time of the survey and will change.