

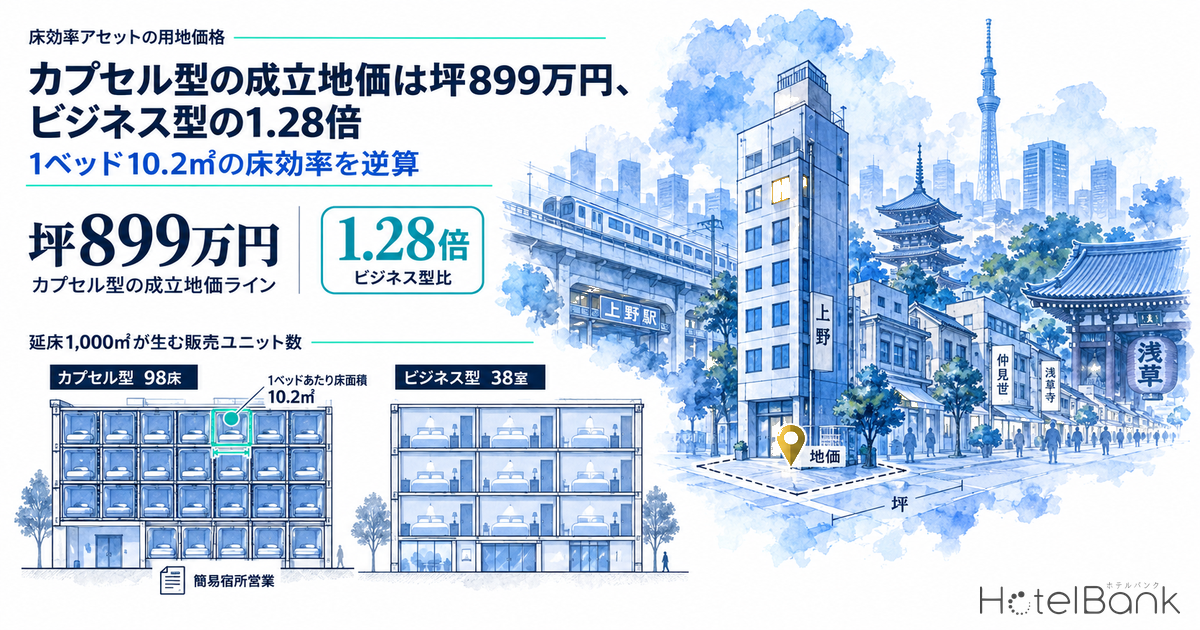
In hotel site acquisition, the starting point is how much land cost each room can carry. Yet even at the same gross floor area, the number of sellable units a single site produces can differ several-fold depending on how much floor space is allocated to each bed. Among the 16 capsule facilities whose gross floor area could be confirmed in the MetroEngines Research & Consulting property master, the median floor area per bed is 10.2㎡ — 2.6 times smaller than the 26.6㎡ per room of 472 business hotels. Starting from this floor efficiency, this article links the 2026 official land price survey (chika koji) with the Building Construction Starts statistics to reverse-engineer the land price ceiling at which a new capsule hotel pencils out, using prime-location models in Tokyo, Osaka and Fukuoka.
Metric Definitions Used in This Article
- ADR (Average Daily Rate): An estimated settled rate (tax-exclusive equivalent), calculated by applying segment-specific adjustment factors to the lowest-plan rate each property publishes on OTAs and elsewhere (per room, 2 guests, tax-inclusive). Checked against property-level results disclosed by listed hotel REITs (91 properties, most recent 3 months), the median error is about 7%. These are estimates and differ from each property’s actual settled prices and accounting figures. Area-level ADR is the median across target properties (the level of a typical property in the area). Where listed prices are mentioned, they refer to the per-room rate for 2 guests (tax-inclusive).
- Unit of capsule ADR: Capsule facilities sell one capsule (= one bed) as their unit, so capsule ADR in this article is per bed. Business and city hotel ADRs are per room; direct comparisons between the two assume this difference in units.
- Floor area per bed (floor efficiency): A property’s gross floor area divided by its number of sellable units (beds for capsule facilities, rooms for hotels). It is a gross measure that includes common areas, baths and lobbies.
- OCC (Occupancy Rate): OCC figures cited as actuals in this article are the room occupancy rates by facility type published in the Japan Tourism Agency’s Overnight Travel Statistics Survey (2025 annual, final figures). Our own estimated OCC is not used. The 80% used in the model is an assumption.
- Tsubo: Japanese unit of land area commonly used in property pricing; 1 tsubo = 3.306㎡. Prices “per tsubo” are shown in yen (e.g., ¥8.99M/tsubo ≈ ¥2.72M/㎡).
- Data sources: MetroEngines Research & Consulting / MLIT Real Estate Information Library / e-Stat Building Construction Starts Statistics / Japan Tourism Agency Overnight Travel Statistics Survey
- — 10.2㎡ per bed (median of N=16 facilities), 2.6 times smaller than the 26.6㎡ per business hotel room (N=472). The same 1,000㎡ of floor area yields 98 beds versus 38 rooms
- — ¥583 per ㎡ of floor per night. Capsule facilities in Tokyo exceed business hotels’ ¥533 by 9% — the floor-efficiency gap is not fully offset by the rate gap
- — Viable land price of ¥8.99M per tsubo (Taito-ku model, 600% FAR, 80% occupancy, 5.0% target yield) — only 1.28x the business hotel’s ¥7.00M per tsubo
- — Over 4x in regional core cities. 4.04x in Chuo-ku, Osaka and 4.21x in Hakata-ku, Fukuoka: the more rates lag land prices, the larger the floor-efficiency advantage
- — Occupancy is the biggest variable. At 65–85% occupancy and 4.5–6.0% target yield, the viable land price moves more than eightfold, from ¥1.57M to ¥13.13M per tsubo
237 facilities and 30,453 beds nationwide — 76.4% of beds concentrated in the top 6 prefectures
First, the outline of supply. The MetroEngines Research & Consulting property master lists 237 capsule facilities with 30,453 beds confirmed as operating nationwide (as of September 2026). Counted on the same basis, there are 6,392 business hotels with 644,066 rooms and 1,050 hostels with 18,213 rooms, so by facility count capsules are only a tiny slice of the lodging market. But they are large per facility: the median is 114 beds (N=236 facilities), and 37 facilities have 200 beds or more. The structure of stacking many sellable units onto a small site shows up directly in the size distribution.
Location is clearly skewed toward metropolitan areas. Tokyo accounts for 94 facilities and 12,516 beds — 41.1% of all beds — followed by Osaka (26 facilities, 4,697 beds), Kyoto (16, 1,856), Kanagawa (15, 1,875), Fukuoka (10, 1,395) and Chiba (9, 942). These top 6 prefectures together hold 170 facilities and 23,281 beds, 76.4% of the national bed count. Meanwhile, 12 prefectures have only one facility each; given the small sample, they are treated as reference values.
Source: MetroEngines Research & Consulting (237 facilities / 30,453 beds confirmed as operating)
Source: MetroEngines Research & Consulting (94 facilities / 12,516 beds in Tokyo)
At the municipal level the concentration is even sharper. The largest cluster is Chuo-ku, Osaka with 14 facilities and 2,687 beds, followed by Taito-ku, Tokyo (13 facilities, 2,097 beds), Minato-ku (14, 1,755), Shinjuku-ku (10, 1,736), Chuo-ku, Tokyo (11, 1,595) and Hakata-ku, Fukuoka (8, 1,271). All are districts of contiguous commercial zoning, close to stations, with small individual plots. The first fact to establish is that the most floor-efficient format clusters where land is most expensive.
| Municipality | Facilities | Beds | Beds per facility | Official commercial land price (median) |
|---|---|---|---|---|
| Chuo-ku, Osaka | 14 | 2,687 | 192 | ¥2,385,000/㎡ (N=42 sites) |
| Taito-ku, Tokyo | 13 | 2,097 | 161 | ¥1,700,000/㎡ (N=47 sites) |
| Minato-ku, Tokyo | 14 | 1,755 | 125 | — |
| Shinjuku-ku, Tokyo | 10 | 1,736 | 174 | ¥2,900,000/㎡ (N=49 sites) |
| Chuo-ku, Tokyo | 11 | 1,595 | 145 | ¥4,535,000/㎡ (N=54 sites) |
| Hakata-ku, Fukuoka | 8 | 1,271 | 159 | ¥1,745,000/㎡ (N=24 sites) |
| Chuo-ku, Sapporo | 6 | 956 | 159 | — |
| Chiyoda-ku, Tokyo | 7 | 886 | 127 | ¥4,475,000/㎡ (N=52 sites) |
Source: MetroEngines Research & Consulting / MLIT Real Estate Information Library (official land prices as of January 1, 2026; median of sites classified as “commercial”)
10.2㎡ per bed — does 1,000㎡ of floor area become 98 beds or 38 rooms?
This is the core of the analysis. Dividing gross floor area by the number of sellable units for each format turns differences in floor use into numbers. Capsule facilities have a median of 10.2㎡ (N=16 facilities, interquartile range 7.1–14.2㎡). Business hotels come in at 26.6㎡ (N=472, 21.3–34.0㎡), city hotels at 99.5㎡ (N=160) and deluxe hotels at 129.0㎡ (N=46). Note that these figures divide total gross floor area — including common areas, large baths and lobbies — by the number of units; they do not represent the private area of a single capsule.
The capsule sample consists of the 16 facilities whose gross floor area could be confirmed (14 in Tokyo, 2 in Osaka), smaller than for other formats. The wide interquartile range of 7.1–14.2㎡ reflects a mix of purpose-built capsule buildings and facilities occupying part of a mixed-use building. The calculations below use the 10.2㎡ median as the base case, and a later section shows how this range moves the results.
Source: MetroEngines Research & Consulting (only facilities for which both gross floor area and number of sellable units could be confirmed)
Source: MetroEngines Research & Consulting
Converting makes it easy to grasp. Given 1,000㎡ of gross floor area, a capsule format yields 98 beds, a business hotel 38 rooms, a hostel 35 rooms and a city hotel 10 rooms. The capsule format extracts 2.6 times as many sellable units from the same floor as a business hotel. On a 100-tsubo (330.6㎡) plot with a 600% floor area ratio (FAR), the maximum planned floor area is 1,983㎡. Assuming 85% FAR utilization, that is 1,686㎡ — 165 beds as a capsule hotel versus 63 rooms as a business hotel.
| Format | Floor area per unit (median) | Interquartile range | Facilities | Per 1,000㎡ |
|---|---|---|---|---|
| Capsule | 10.2㎡ | 7.1–14.2㎡ | N=16 | 98 beds |
| Business hotel | 26.6㎡ | 21.3–34.0㎡ | N=472 | 38 rooms |
| Hostel | 28.3㎡ | 13.5–34.3㎡ | N=13 | 35 rooms |
| City hotel | 99.5㎡ | 52.5–141.8㎡ | N=160 | 10 rooms |
| Deluxe hotel | 129.0㎡ | 94.7–167.1㎡ | N=46 | 8 rooms |
Source: MetroEngines Research & Consulting. For hostels and dormitory formats the denominator is rooms; where multiple beds are placed in one room, floor area per bed is smaller still. Formats with N<20 are reference values.
Nightly rate per ㎡ of floor is ¥583 in Tokyo — above business hotels’ ¥533
Small floor area per unit is, by itself, offset if the rate falls. So we take the “rate per ㎡ of floor per night”: estimated settled ADR divided by gross floor area per unit. This indicator shows which format can load more revenue onto the same floor.
Using estimated settled ADR for September 2025–August 2026 (finalized months only), Tokyo capsule facilities come in at ¥5,950 (median number of target facilities N=38). Divided by 10.2㎡ per bed, that is ¥583/㎡. Tokyo business hotels over the same period average about ¥14,200 (N=914); divided by 26.6㎡ per room, that is ¥533/㎡. Capsules are 9% higher. City hotels, at about ¥27,400 (N=107) over 99.5㎡, come to ¥276/㎡ — less than half in terms of rate density per floor area.
The gap is widest in regional core cities. In Fukuoka, capsules earn ¥585/㎡ versus ¥410/㎡ for business hotels, a 43% gap; in Hokkaido, ¥556/㎡ versus ¥334/㎡ (67%); and in Aichi, ¥477/㎡ versus ¥294/㎡ (62%). The lower the overall rate level of a market, the more the floor-efficiency gap persists as a gap in floor productivity. Conversely, in Kyoto capsules earned ¥432/㎡ against ¥522/㎡ for business hotels — the only prefecture where capsules came in lower. Business hotel rates in Kyoto are around ¥13,900, close to Tokyo, making it a market where generous floor use can still be recouped.
Source: MetroEngines Research & Consulting (estimated settled ADR divided by the median gross floor area per unit for each format. Numbers of capsule facilities are monthly medians: Tokyo 38, Osaka 10, Kanagawa 6, Fukuoka 6, Kyoto 5, Hokkaido 4, Aichi 4, Hiroshima 3; prefectures with N<10 are reference values)
| Prefecture | Capsule ADR | Facilities | Per ㎡ of floor | Business ADR | Per ㎡ of floor | Gap |
|---|---|---|---|---|---|---|
| Fukuoka | ¥5,969 | N=6 (reference) | ¥585 | ¥10,900 | ¥410 | +43% |
| Tokyo | ¥5,950 | N=38 | ¥583 | ¥14,178 | ¥533 | +9% |
| Hokkaido | ¥5,673 | N=4 (reference) | ¥556 | ¥8,881 | ¥334 | +67% |
| Aichi | ¥4,862 | N=4 (reference) | ¥477 | ¥7,820 | ¥294 | +62% |
| Osaka | ¥4,504 | N=10 | ¥442 | ¥10,016 | ¥377 | +17% |
| Kanagawa | ¥4,495 | N=6 (reference) | ¥441 | ¥9,221 | ¥347 | +27% |
| Kyoto | ¥4,410 | N=5 (reference) | ¥432 | ¥13,892 | ¥522 | −17% |
| Hiroshima | ¥3,226 | N=3 (reference) | ¥316 | ¥7,700 | ¥289 | +9% |
Source: MetroEngines Research & Consulting (average of finalized months, September 2025–August 2026; November and December 2025 excluded because finalized values were not available)
7㎡ per room or 3.3㎡ per person — Article 1 of the Hotel Business Act Enforcement Order sets floor efficiency
This gap in floor efficiency stems not from design philosophy but from the different standards attached to each type of business license. Article 1 of the Enforcement Order of the Hotel Business Act (Cabinet Order No. 152 of 1957) sets separate structural and equipment standards for each license type.
Paragraph 1, Item 1 provides for hotel/ryokan business that “the floor area of one guest room shall be at least seven square meters (nine square meters for a guest room with beds).” For a room with beds, 9㎡ per room is the minimum. By contrast, Paragraph 2, Item 1 provides for simple lodging business (kan’i shukusho) that “the total floor area of guest rooms shall be at least thirty-three square meters (…where the number of guests is fewer than ten, the area obtained by multiplying 3.3 square meters by the number of guests).” The concept is 3.3㎡ per guest; there is no minimum area per guest room at all. In addition, Item 2 of the same paragraph provides that “where bunk-type beds are installed, the gap between the upper and lower tiers shall be approximately one meter or more,” so stacking capsules in two tiers is built into the text of the regulation.
In other words, in terms of the statutory minimum guest-room floor area per person, there is a 2.7-fold gap between 9㎡ per room with beds and 3.3㎡ per person. The measured 10.2㎡ for capsule facilities can be read as this 3.3㎡ minimum plus common areas, large baths, lobbies, corridors and mechanical space.
Looser Guest-room area under the Hotel Business Act
Simple lodging business requires total guest-room floor area of at least 33㎡ (3.3㎡ per person if fewer than 10 guests). There is no per-room minimum like the “7㎡ per room, 9㎡ for rooms with beds” of hotel/ryokan business, so floor efficiency can be pushed through design. Basis: Hotel Business Act Enforcement Order, Article 1, Paragraph 1, Item 1 and Paragraph 2, Item 1.
Same Use classification under the Building Standards Act
Even with a simple lodging license, the building is treated as a “hotel or ryokan” under the Building Standards Act. It cannot be built in Category 1 and 2 Low-rise Exclusive Residential Zones, Category 1 and 2 Mid/high-rise Exclusive Residential Zones, Industrial Zones or Exclusively Industrial Zones, and in Category 1 Residential Zones it is limited to a total floor area of 3,000㎡ or less (Building Standards Act, Appended Table 2). Siting flexibility does not increase.
Same Fire safety equipment requirements
Item (5)(a) of Appended Table 1 of the Fire Service Act Enforcement Order groups together “ryokan, hotels, lodging houses and similar facilities.” Automatic fire alarm systems are required regardless of floor area (Article 21, Paragraph 1, Item 1(a) of the same Order). Sprinklers are required for buildings with 11 or more floors excluding basements, or non-single-story buildings with a total floor area of 6,000㎡ or more (Article 12, Paragraph 1, Items 3 and 4). The use classification is identical, and the smaller the floor area, the lighter the equipment investment.
To sum up, the only rule that affects floor efficiency is the guest-room area standard under the Hotel Business Act; zoning restrictions under the Building Standards Act and fire equipment classification are exactly the same as for hotels and ryokan. The notion that “a simple lodging license lets you build in residential zones” is wrong — the set of eligible sites does not expand. What expands is the number of sellable units that can be extracted from the same site.
Viable land price line of ¥8.99M per tsubo — 1.28x the business hotel’s ¥7.00M
With these inputs, the land price ceiling can be reverse-engineered. The logic is simple: divide the annual GOP generated per bed by the target yield to obtain the allowable total investment, then subtract construction cost; the remainder is what can be paid for land. Dividing that by the site area per bed (floor area per bed ÷ FAR ÷ FAR utilization) gives the maximum land price per ㎡ of site.
■ Model assumptions
- Floor area per bed: 10.2㎡ for capsule, 26.6㎡ for business hotel (both are the medians from Section 2 of this article)
- Construction cost (Stage 1, based on 2024 actuals): ¥591,280/㎡ = ¥1.95M per tsubo. Calculated by dividing the 2024 national estimated construction cost for accommodation buildings of about ¥1.0384 trillion by their total floor area of 1,756,286㎡, from e-Stat’s Building Construction Starts Statistics (table ID 0003114490). The 2019 figure was ¥363,980/㎡ (¥1.20M per tsubo), a 62.4% rise over five years. For Tokyo alone, the 2024 figure was ¥608,730/㎡ (¥2.01M per tsubo, 67 buildings)
- Construction cost (Stage 2, incorporating inflation during construction): Assuming a 2029 opening with construction in 2027–2029, the midpoint is set at 2028. Compounding our assumed increases (assumptions for this model, not forecasts based on published statistics) of +5.6% in 2025, +5.3% in 2026, +5.0% in 2027 and +4.5% in 2028 on 2024 actuals gives a factor of 1.2201, or ¥721,425/㎡ = ¥2.38M per tsubo. The headline conclusions in this article use Stage 2
- Soft costs: 15% of construction cost added for design and supervision, FF&E and pre-opening expenses
- FAR utilization: 85% (allowing for setback-line restrictions, frontage setbacks and core efficiency)
- Floor area ratio (FAR): Assumes the typical designated FAR for commercial land in each ward (Taito-ku 600%, Shinjuku-ku 600%, Chuo-ku, Osaka 800%, Hakata-ku 500%). Taito-ku and Hakata-ku match the median FAR of commercial land-price sites; the medians for Shinjuku-ku and Chuo-ku, Osaka are 500% and 700% respectively
- ADR: Average estimated settled ADR for September 2025–August 2026 (capsule / business: Tokyo ¥5,950 / ¥14,178; Osaka ¥4,504 / ¥10,016; Fukuoka ¥5,969 / ¥10,900)
- Occupancy: Fixed at 80% for both formats. Set close to the 81.5% for Tokyo business hotels in the Japan Tourism Agency’s Overnight Travel Statistics Survey (2025 annual, final), and kept identical to hold all conditions other than floor efficiency constant
- GOP margin: 40% for both formats, set with reference to the GOP results (38.9% for the fiscal period ended December 2024) disclosed by Invincible Investment Corporation for its 91 operator-managed properties
- Target yield: 5.0% on a GOP basis relative to total investment
- This is a simplified model; actual investment decisions require a detailed feasibility study
Under Tokyo conditions (capsule ADR ¥5,950, business ADR ¥14,178, FAR 600%), the allowable total investment per capsule bed is about ¥13.90M; construction cost (including soft costs) is about ¥8.46M, leaving about ¥5.44M for land. Site area per bed is 10.2 ÷ 6.0 ÷ 0.85 = 2.0㎡, so the maximum land price is about ¥2.72M per ㎡ of site, or ¥8.99M per tsubo. Under the same conditions, a business hotel has an allowable total investment of about ¥33.12M per room, construction cost of about ¥22.07M and land capacity of about ¥11.05M, with 5.22㎡ of site per room, for a ceiling of about ¥2.12M per ㎡ of site = ¥7.00M per tsubo. The capsule format can tolerate land prices 28% higher than the business hotel format.
The key point here is that although floor efficiency differs by 2.6x, the viable land price differs by only 1.28x. Because capsule ADR is at 42% of business hotel ADR, the floor-efficiency advantage is largely offset by the rate gap. In markets like Tokyo, where the two formats’ rates per ㎡ of floor are close, floor efficiency alone does not make a decisive difference.
Source: MetroEngines Research & Consulting / MLIT Real Estate Information Library (official land prices as of January 1, 2026). Bars = maximum land price under the assumptions above; lines = median and first quartile of official commercial land prices in each ward
| Model | Format | Allowable investment per unit | Construction cost | Land capacity | Max land price | vs. official median | vs. 1st quartile |
|---|---|---|---|---|---|---|---|
| Taito-ku, Tokyo Ueno / Asakusa / Okachimachi; FAR 600% Official median ¥5.62M/tsubo | Capsule | ¥13,899,200 | ¥8,462,313 | ¥5,436,887 | ¥8.99M/tsubo | 160% | 228% |
| Business | ¥33,119,808 | ¥22,068,385 | ¥11,051,423 | ¥7.00M/tsubo | 125% | 178% | |
| Shinjuku-ku, Tokyo Shinjuku / Okubo / Yotsuya; FAR 600% Official median ¥9.59M/tsubo | Capsule | ¥13,899,200 | ¥8,462,313 | ¥5,436,887 | ¥8.99M/tsubo | 94% | 141% |
| Business | ¥33,119,808 | ¥22,068,385 | ¥11,051,423 | ¥7.00M/tsubo | 73% | 110% | |
| Chuo-ku, Osaka Shinsaibashi / Hommachi / Tanimachi; FAR 800% Official median ¥7.88M/tsubo | Capsule | ¥10,521,344 | ¥8,462,313 | ¥2,059,031 | ¥4.54M/tsubo | 58% | 83% |
| Business | ¥23,397,376 | ¥22,068,385 | ¥1,328,991 | ¥1.12M/tsubo | 14% | 20% | |
| Hakata-ku, Fukuoka Hakata Station / Gofukumachi; FAR 500% Official median ¥5.77M/tsubo | Capsule | ¥13,943,584 | ¥8,462,313 | ¥5,481,271 | ¥7.55M/tsubo | 131% | 372% |
| Business | ¥25,462,400 | ¥22,068,385 | ¥3,394,015 | ¥1.79M/tsubo | 31% | 88% |
Source: MetroEngines Research & Consulting / MLIT Real Estate Information Library / e-Stat Building Construction Starts Statistics. Construction cost uses Stage 2 (2028 basis, ¥721,425/㎡). Official median and first quartile are for commercial land-price sites in each ward (Taito N=47, Shinjuku N=49, Chuo-ku Osaka N=42, Hakata N=24)
Comparing the four models shows that floor efficiency works very differently depending on the market. In Tokyo, the capsule ceiling is 160% of the official median and the business hotel ceiling 125%, so there is room for new development in both formats. The median site in Taito-ku is Taito 1-chome (600m from Akihabara, FAR 500%, +18.9% YoY) at ¥5.62M per tsubo; at that level both formats are within reach.
In Shinjuku-ku the official median is high at ¥9.59M per tsubo, so the capsule format reaches only 94% and the business hotel 73%. However, at the first quartile of ¥6.38M per tsubo (the level of a site in Yamabukicho, 680m from Waseda Station, FAR 500%), the ratios become 141% for capsule and 110% for business hotel: a plot one block back from the prime station-front locations creates room for development. Within the same ward, the conclusion flips depending on which site is chosen.
In Chuo-ku, Osaka and Hakata-ku, Fukuoka, the gap is of a different order. In Chuo-ku, Osaka, the capsule ceiling is ¥4.54M per tsubo against ¥1.12M for business hotels, 4.04x; in Hakata-ku, Fukuoka, it is ¥7.55M versus ¥1.79M, 4.21x. In both cities, business hotel estimated settled ADR is only around 70% of Tokyo’s, while land prices have risen to levels approaching Tokyo’s major wards. In markets where rates have not kept pace, formats that use floor space generously are the first to lose room for new development, and the floor-efficiency advantage widens. In Hakata-ku, Fukuoka, the capsule format secures 131% of the official median, the clearest relative advantage for floor-efficient assets among the four models.
Occupancy and target yield move the line — sensitivity from ¥1.57M to ¥13.13M per tsubo
How far does the conclusion move when the assumptions change? For the capsule format in the Taito-ku model (FAR 600%, 2028-basis construction cost), varying occupancy from 65% to 85% and target yield from 4.5% to 6.0% produces a viable land price ranging more than eightfold, from ¥1.57M to ¥13.13M per tsubo.
Source: MetroEngines Research & Consulting (Taito-ku model, FAR 600%, 2028-basis construction cost)
Source: MetroEngines Research & Consulting (same assumptions)
| Assumption | Yield 4.5% | Yield 5.0% | Yield 5.5% | Yield 6.0% |
|---|---|---|---|---|
| Capsule, 65% occupancy | ¥6.75M/tsubo | ¥4.68M/tsubo | ¥2.98M/tsubo | ¥1.57M/tsubo |
| Capsule, 75% occupancy | ¥9.94M/tsubo | ¥7.55M/tsubo | ¥5.59M/tsubo | ¥3.96M/tsubo |
| Capsule, 85% occupancy | ¥13.13M/tsubo | ¥10.42M/tsubo | ¥8.20M/tsubo | ¥6.35M/tsubo |
| Business, 65% occupancy | ¥4.96M/tsubo | ¥3.07M/tsubo | ¥1.52M/tsubo | ¥0.23M/tsubo |
| Business, 75% occupancy | ¥7.88M/tsubo | ¥5.69M/tsubo | ¥3.90M/tsubo | ¥2.41M/tsubo |
| Business, 85% occupancy | ¥10.79M/tsubo | ¥8.32M/tsubo | ¥6.29M/tsubo | ¥4.60M/tsubo |
Source: MetroEngines Research & Consulting. Taito-ku model (FAR 600%, FAR utilization 85%, GOP margin 40%, 2028-basis construction cost ¥721,425/㎡, soft costs 15%)
Occupancy moves the conclusion most strongly. For the capsule format at a 5.0% yield, the difference between 65% and 85% occupancy is ¥4.68M versus ¥10.42M per tsubo, a 2.2-fold spread. A useful reference is the room occupancy rate by facility type in the Japan Tourism Agency’s Overnight Travel Statistics Survey (2025 annual, final). Nationally, simple lodging facilities stood at 29.6%, far below business hotels (75.3%) and city hotels (74.1%). By prefecture, however, the picture differs in urban areas: Osaka 73.6% (1st nationwide), Kyoto 52.0% (2nd), Tokyo 48.6% (3rd), Fukuoka 44.8% (4th) and Aichi 38.2% (5th). The simple lodging category includes many small guesthouses and minshuku, so actual performance of large capsule facilities in city centers is likely to exceed the category average. The 80% used in the model is a prime-location assumption close to the 81.5% for Tokyo business hotels, not a direct application of the national average by facility type.
Construction cost assumptions also move the conclusion. Using Stage 1 2024 actuals (¥1.95M per tsubo), the Taito-ku model yields ¥11.51M per tsubo for capsule and ¥9.53M for business hotels, 30–40% higher than the ¥8.99M and ¥7.00M under Stage 2 (¥2.38M per tsubo). The higher construction costs go, the less capacity remains for land, and the viable line falls. At the same time, rising construction costs work to curb new supply itself, carrying the upside of easing competition for existing properties.
An alternative use for high-priced plots — three conditions under which floor-efficient assets work
Translated into investment decisions, floor-efficient assets emerge as a real option when the following three conditions overlap.
Condition 1: Small plots where room-based formats cannot use up the FAR
Plots so small that a room-based format can fit only a limited number of rooms per floor. Capsule formats can be subdivided at 10.2㎡ per bed, extracting 2.6 times as many sellable units from the same floor area. On a 100-tsubo plot with 600% FAR, that means 165 beds versus 63 rooms.
Condition 2: Markets where land prices have outpaced rate growth
Markets like Chuo-ku, Osaka and Hakata-ku, Fukuoka, where commercial land prices are moving at +15.8% and +10.2% YoY (MLIT Real Estate Information Library, official land prices as of January 1, 2026) while business hotel estimated settled ADR remains at around 70% of Tokyo’s. The gap in viable land prices widens to around 4x, and the floor-efficiency advantage is at its largest.
Condition 3: Locations where city-center occupancy can be assumed
The viable land price reacts most strongly to occupancy. Because it moves 2.2x between 65% and 85% occupancy, the premise is a location near a station, in a commercial zone, with deep demand from solo travelers. Osaka, Kyoto, Tokyo and Fukuoka, where simple lodging occupancy is high in the Japan Tourism Agency statistics, meet this condition.
Conversely, a decision made on floor efficiency alone is unlikely to hold up. In Tokyo, the two formats’ rates per ㎡ of floor are close at ¥583 versus ¥533, and the difference in viable land price is only 1.28x. In markets where rates are high enough, room-based formats can also recoup their floor space. Floor-efficient assets truly pay off in markets with a low rate ceiling and high land prices — markets that at first glance look hard to develop.
It is also worth reiterating that the set of eligible sites does not expand. Even with a simple lodging license, the building is a “hotel or ryokan” under the Building Standards Act and cannot be built in exclusive residential zones, industrial zones or exclusively industrial zones. Fire equipment also falls under the same classification, Item (5)(a) of Appended Table 1. A floor-efficient asset is not “a way to build where you otherwise could not,” but “a way to change the economics of where you can build.”
Finally, the model in this article uses official land prices as a guide to land cost. Actual transaction prices commonly exceed official levels, so comparisons with the viable line should be read conservatively. In addition, the capsule floor area per bed is the median of 16 facilities whose gross floor area could be confirmed, and its interquartile range of 7.1–14.2㎡ translates directly into a range of viable land prices. At 7.1㎡, the Taito-ku model’s viable land price jumps into the ¥19M-per-tsubo range; at 14.2㎡, it falls to around ¥2.5M per tsubo. For individual projects, recalculation after fixing the floor efficiency of the actual design is a prerequisite.
References and Sources
■ Data sources
Facility counts, bed counts and gross floor area are from our property master (as of September 2026, limited to facilities confirmed as operating). Rates are our estimated settled ADR (average of finalized months, September 2025–August 2026; November and December 2025 excluded because finalized values were not available). Land prices are official land prices from the MLIT Real Estate Information Library (as of January 1, 2026; median and first quartile of sites classified as “commercial”). Construction costs are for accommodation buildings in e-Stat’s Building Construction Starts Statistics (table ID 0003114490). Actual occupancy figures are from the Japan Tourism Agency’s Overnight Travel Statistics Survey (2025 annual, final). Legal requirements are from statutory texts on e-Gov Law Search.
■ Model assumptions
The viable land price is calculated by dividing the annual GOP generated per sellable unit (ADR × 365 × occupancy × GOP margin) by the target yield to obtain allowable total investment, subtracting construction cost (hard cost + 15% soft costs), and dividing the remainder by site area per unit (floor area per unit ÷ FAR ÷ FAR utilization). Base values are 80% occupancy (an assumption: a full-year basis for a prime location as of September 2026, set close to the 81.5% for Tokyo business hotels in the Japan Tourism Agency’s Overnight Travel Statistics Survey, 2025 annual, final), 40% GOP margin, 5.0% target yield, 85% FAR utilization and a 2028-basis construction cost of ¥721,425/㎡. The same values are applied to both formats so that only differences in floor efficiency and ADR are reflected. The basis for each assumption is described in the model assumptions box in the body text.
■ Limitations
The capsule floor area per bed is the median of 16 facilities whose gross floor area could be confirmed, and its interquartile range of 7.1–14.2㎡ translates directly into a range of viable land prices. Estimated settled ADR is an estimate obtained by applying segment-specific adjustment factors to published prices and differs from each property’s actual settled prices and accounting figures. Prefecture-level rates with fewer than 10 target facilities are treated as reference values. Land cost is based on official land prices; because actual transaction prices commonly exceed official levels, comparisons with the viable line should be read conservatively. Future construction costs are assumptions based on our assumed rates of increase, not forecasts based on published statistics. This article is a simplified-model estimate; investment decisions on individual projects require a detailed feasibility study.
■ Market data
- MetroEngines Research & Consulting — property master (facility counts, bed counts and gross floor area by format), estimated settled ADR (September 2025–August 2026)
■ Government statistics and public data
- MLIT Real Estate Information Library — official land prices (as of January 1, 2026) and zoning
- e-Stat Building Construction Starts Statistics (table ID: 0003114490; use “accommodation,” builder “total,” 2011–2024)
- Japan Tourism Agency, Overnight Travel Statistics Survey (2025 annual, final; published July 6, 2026)
- Japan Tourism Agency, Overnight Travel Statistics Survey (2025 annual, final) press release (PDF, Japanese)
■ Laws and regulations (e-Gov Law Search, Japanese)
- Enforcement Order of the Hotel Business Act (Cabinet Order No. 152 of 1957), Article 1 — structural and equipment standards for hotel/ryokan business and simple lodging business
- Building Standards Act (Act No. 201 of 1950), Appended Table 2 — building restrictions by zoning district
- Fire Service Act Enforcement Order (Cabinet Order No. 37 of 1961), Articles 12 and 21 and Appended Table 1 — installation standards for sprinkler systems and automatic fire alarm systems
■ REIT and industry data