

The official land prices that feed site-acquisition decisions are updated only twice a year: the Land Price Publication (Koji Chika) as of January 1 (the 2026 edition was released on March 17), and the Prefectural Land Price Survey (Kijun Chika, or benchmark land prices) as of July 1. The 2026 edition of the latter was released on September 15, 2026. It covers 21,466 sites nationwide, and commercial land rose by a national average of +2.9% over the year. The subject of this article is not a quick “up or down” readout. It is a re-check of development decisions: as the land-price benchmark moved over six months, how much did the distance to the maximum viable land price change?
First, how this piece differs from our earlier coverage. One earlier article previewed resort-area land prices using the previous (2025) survey ahead of this release; another focused on the carrying costs incurred between site acquisition and opening; a third dealt with construction costs and the framework for back-solving break-even ADR itself. This article uses a different survey, the benchmark land price (as of July 1, conducted by prefectures), and restricts itself to sites that can be matched to the same location in the Land Price Publication, measuring the six-month change since January 1. We do not go into the gap between actual transaction prices and official prices.
Metric Definitions Used in This Article
- Land Price Publication (Koji Chika, official land prices): The normal price per ㎡ of standard sites as of January 1 each year, appraised and published by the Land Appraisal Committee of the Ministry of Land, Infrastructure, Transport and Tourism (MLIT) under the Land Price Publication Act. In 2026, it was conducted at 25,565 of 26,000 sites nationwide (435 sites, including 430 biennial sites, were suspended).
- Prefectural Land Price Survey (Kijun Chika, benchmark land prices): The price per ㎡ of benchmark sites as of July 1 each year, surveyed and published by each prefectural governor under the Enforcement Order of the National Land Use Planning Act. In 2026, 21,466 sites nationwide (10 of which were suspended).
- Common sites: Sites where a benchmark site and a standard site are at the same location, so that the January 1 and July 1 prices can be linked to calculate half-yearly changes. MLIT’s tally for the 2026 survey counts 1,589 such sites (1,086 residential and 503 commercial).
- First half / second half: First half (H1) = change from July 1, 2025 to January 1, 2026; second half (H2) = change from January 1, 2026 to July 1, 2026. This follows MLIT’s definition.
- ADR (Average Daily Rate): An estimated settled rate (tax-exclusive equivalent), calculated by applying category-specific adjustment factors to the lowest published plan rate (per room for two guests, tax-inclusive) that each property lists on OTAs and elsewhere. Checked against property-level results disclosed by listed hotel REITs (91 properties, most recent 3 months), the median error is about 7%. These are estimates and differ from each property’s actual settled prices and accounting figures. Area-level ADR is the median of the covered properties (the level of a typical property in the area). Where published prices are mentioned, they are per-room rates for two guests (tax-inclusive).
- Break-even ADR: The average daily rate required to achieve the target net operating income (NOI) yield on the sum of land, construction and soft costs. This is an estimate prepared for this article and does not guarantee the profitability of any specific project.
- Maximum viable land price: Taking the market ADR (12-month average of the estimated settled ADR) as given, the upper limit of land price per ㎡ at which break-even ADR is reached under the same assumptions. An estimate prepared for this article.
- Data sources: MLIT Prefectural Land Price Survey (2026), MLIT Land Price Publication (2026), MLIT Real Estate Information Library, MetroEngines Research & Consulting
- The 2026 Prefectural Land Price Survey was released on September 15, with a price date of July 1, covering 21,466 sites nationwide. Commercial land rose by a national average of +2.9% (previous year +2.8%). Gains widened in the Tokyo area (+8.9%) and Osaka area (+6.8%), and narrowed in the Nagoya area (+2.7%) and the four regional cities (+6.0%).
- At the 1,589 common sites (503 commercial) that MLIT matched to the Land Price Publication, the national average for commercial land was +3.1% in H1 and +2.8% in H2. Of the 6.0% annual rise, the most recent six months account for 2.8%.
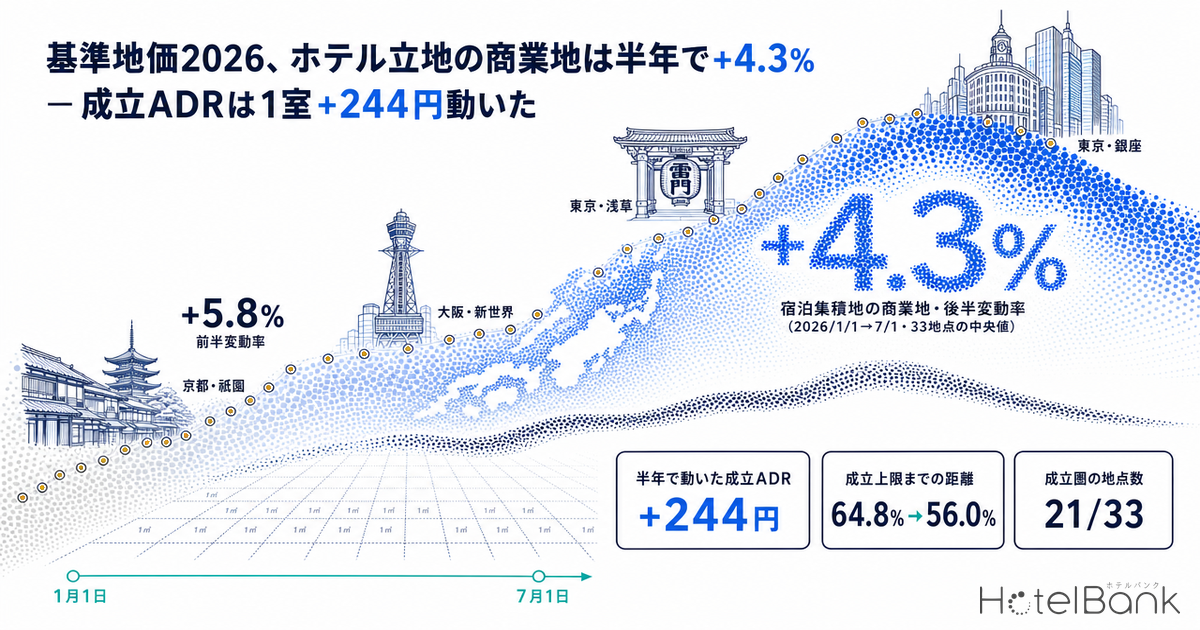
- At the 33 sites (14 markets) that this article matched, limited to commercial land in lodging clusters, the H2 median was +4.3%, 1.5 times the national common-site figure. This is a slight slowdown from +5.8% in H1.
- Under a standard limited-service hotel assumption (25.0㎡ of gross floor area per room), land accounts for a median 40.1% of total investment, and the six-month land-price rise moved break-even ADR by a median +¥244 (+2.0%), equal to 1.7% of market ADR.
- The headroom to the maximum viable land price narrowed by 8.8 points, from a median 64.8% to 56.0%. Of the 33 sites, 21 are within the viable zone; the only site that newly crossed the cap in these six months was in Ginza 7-chome (+7.5%→-0.0%).
- The 12 sites above the cap are concentrated in prime retail and office locations such as Marunouchi, Ginza, Shinsaibashi and Meieki. This means they exceed the viability line for a limited-service hotel; even within the same market, the conclusion can change one street back.
How Official Land Prices and Benchmark Land Prices Differ: Two Updates a Year and 1,589 Common Sites
We begin with the institutional framework. The Land Price Publication is appraised by the national government (MLIT’s Land Appraisal Committee) under the Land Price Publication Act as of January 1 and released in March. The Prefectural Land Price Survey is conducted by each prefectural governor under the Enforcement Order of the National Land Use Planning Act as of July 1 and released in September. The two differ in both the implementing body and the governing law, but MLIT positions them as “mutually complementary in terms of survey timing and survey sites.”
The practical implication is clear. Because there are two price dates, January 1 and July 1, the land-price benchmark for site decisions can be updated with official figures every six months. In addition, some benchmark sites and standard sites are set at the same location, and at these sites the two dates can be linked to calculate half-yearly changes. The 2026 survey has 1,589 common sites (1,086 residential and 503 commercial). If you look only at the annual figure, a second-half investment committee will be debating on the basis of a price date nine months old. Using common sites narrows that gap to two and a half months.
| Item | Land Price Publication (Koji Chika) | Prefectural Land Price Survey (Kijun Chika) |
|---|---|---|
| Governing law | Land Price Publication Act | Enforcement Order of the National Land Use Planning Act |
| Implementing body | MLIT Land Appraisal Committee | Each prefectural governor |
| Price date | January 1 each year | July 1 each year |
| 2026 release date | March 17, 2026 | September 15, 2026 |
| Number of sites (2026) | 26,000 standard sites (435 suspended; 25,565 surveyed) | 21,466 benchmark sites (10 suspended) |
| 2026 commercial land, national average | +4.3% (previous year +3.9%) | +2.9% (previous year +2.8%) |
| Common sites | 1,589 sites (1,086 residential and 503 commercial). Six-month change from January 1 to July 1 can be calculated | |
Source: Prepared by MetroEngines Research & Consulting from MLIT, “Overview of the 2026 (Reiwa 8) Land Price Publication” and “Overview of the 2026 (Reiwa 8) Prefectural Land Price Survey.” National average changes are each survey’s year-on-year change (the price dates are six months apart, so the levels are not directly comparable).
National Half-Year Changes: Commercial Land +3.1% in H1, +2.8% in H2
First, the half-yearly changes at common sites published by MLIT. Commercial land rose by a national average of +3.1% in H1 and +2.8% in H2, for +6.0% over the year. The three major metropolitan areas were +4.3% in H1 and +3.8% in H2, and the Tokyo area +5.0% and +4.5%. The gap between H1 and H2 stays within 0.3 to 0.5 points nationally and in the Tokyo and Osaka areas; the pattern is not “rose in the first half, stalled in the second.” In regional areas, H2 (+1.5%) actually slightly exceeds H1 (+1.4%).
The four regional cities (Sapporo, Sendai, Hiroshima and Fukuoka), on the other hand, were +3.4% in H1 and +2.3% in H2, the largest H2 slowdown at 1.1 points. On a year-on-year basis across all benchmark sites, commercial land in the four regional cities also rose by a smaller +6.0% (previous year +7.3%), consistent in direction with the half-year common-site data.
33 Sites in Lodging Clusters: H2 Median +4.3%, 1.5 Times the National Common-Site Figure
Now to our own tally. The procedure was as follows. For lodging-cluster areas in 14 major markets, we retrieved benchmark sites (as of July 1, 2026) and standard sites (as of January 1, 2026) within a 1.2km radius of each center from the Real Estate Information Library, and matched them as the same site where coordinates agreed within 8m. Limiting use to commercial land, 33 sites qualified. For each site we also show the number of hotels and ryokan (10+ rooms, within our coverage) and their rooms within a 500m radius.
The results first. The H2 change across the 33 sites was a median +4.3% (mean +5.3%, range +0.8% to +12.4%), 1.5 times the +2.8% for national commercial common sites published by MLIT. The H1 median was +5.8%, so lodging clusters are also slowing, but the level itself remains above the national average. Over the full year the median was +11.9%, nearly twice the +6.0% for national commercial common sites.
Looking at individual sites, the largest H2 gains were on the periphery of Umeda in Osaka (Oyodominami 1-chome, +12.4%), Nishi-Asakusa 2-chome in Asakusa, Tokyo (+11.5%), and Fukushima 6-chome in Osaka (+10.0%). What they share is that they are not in the top price band at the center but on its outer ring. Conversely, the smallest H2 gains were at Meieki 4-chome in Nagoya (+0.8%), Hakata-eki Higashi 1-chome in Fukuoka (+1.0%), Umeda 1-chome in Osaka (+1.5%) and Togiya-machi in Takamatsu (+1.9%). There are also several cases where sites that moved sharply in H1 slowed in H2 (Asakusa 5-chome +15.7%→+7.3%, Shinmonzen-dori in Kyoto +12.2%→+3.6%, Karasuma-dori in front of Kyoto Station +9.5%→+3.0%), so in six-month increments, sites within the same market move differently.
| Market | Benchmark site no. | Location (address, etc.) | Designated FAR | Jul 1, 2025 (¥/㎡) | Jan 1, 2026 Official (¥/㎡) | Jul 1, 2026 Benchmark (¥/㎡) | H1 | H2 | Annual | Lodging within 500m (properties / rooms) |
|---|---|---|---|---|---|---|---|---|---|---|
| Tokyo – Ginza | Chuo 5-5 | Ginza 7-11-14 | 700% | 8,850,000 | 9,390,000 | 10,100,000 | +6.1% | +7.6% | +14.1% | 35 / 6,265 |
| Tokyo – Ginza | Chuo 5-9 | Shintomi 1-9-1 | 600% | 3,190,000 | 3,440,000 | 3,700,000 | +7.8% | +7.6% | +16.0% | 50 / 5,738 |
| Tokyo – Ginza | Chuo 5-13 | Ginza 2-6-7 | 800% | 46,900,000 | 49,600,000 | 52,500,000 | +5.8% | +5.8% | +11.9% | 31 / 5,076 |
| Tokyo – Ginza | Chuo 5-14 | Ginza 6-8-3 | 700% | 33,000,000 | 35,000,000 | 37,000,000 | +6.1% | +5.7% | +12.1% | 40 / 7,523 |
| Tokyo – Ginza | Chiyoda 5-1 | Marunouchi 3-3-1 | 1300% | 27,300,000 | 27,500,000 | 28,200,000 | +0.7% | +2.5% | +3.3% | 3 / 473 |
| Tokyo – Ginza | Minato 5-5 | Shimbashi 1-18-16 | 800% | 14,600,000 | 15,100,000 | 15,400,000 | +3.4% | +2.0% | +5.5% | 35 / 4,544 |
| Tokyo – Asakusa | Taito 5-17 | Nishi-Asakusa 2-13-10 | 700% | 2,880,000 | 3,230,000 | 3,600,000 | +12.2% | +11.5% | +25.0% | 84 / 7,000 |
| Tokyo – Asakusa | Taito 5-21 | Misuji 2-24-8 | 600% | 1,650,000 | 1,800,000 | 1,970,000 | +9.1% | +9.4% | +19.4% | 32 / 2,449 |
| Tokyo – Asakusa | Taito 5-6 | Asakusa 5-37-6 | 500% | 854,000 | 988,000 | 1,060,000 | +15.7% | +7.3% | +24.1% | 28 / 1,052 |
| Tokyo – Shinjuku | Shinjuku 5-26 | Shinjuku 1-31-16 | 600% | 2,100,000 | 2,300,000 | 2,500,000 | +9.5% | +8.7% | +19.0% | 24 / 2,246 |
| Tokyo – Shinjuku | Shinjuku 5-10 | Shinjuku 3-5-4 | 800% | 21,500,000 | 22,000,000 | 23,200,000 | +2.3% | +5.5% | +7.9% | 45 / 3,621 |
| Tokyo – Shinjuku | Shinjuku 5-13 | Nishi-Shinjuku 2-6-1 | 1000% | 13,800,000 | 14,200,000 | 14,400,000 | +2.9% | +1.4% | +4.3% | 9 / 5,513 |
| Nagoya – Meieki | Nakamura 5-7 | Meieki 4-6-23 | 1300% | 12,200,000 | 12,300,000 | 12,400,000 | +0.8% | +0.8% | +1.6% | 33 / 6,104 |
| Osaka – Umeda | Kita 5-11 | Oyodominami 1-10-9 | 600% | 1,930,000 | 2,090,000 | 2,350,000 | +8.3% | +12.4% | +21.8% | 15 / 1,954 |
| Osaka – Umeda | Fukushima 5-3 | Fukushima 6-20-2 | 400% | 1,670,000 | 1,800,000 | 1,980,000 | +7.8% | +10.0% | +18.6% | 17 / 2,840 |
| Osaka – Umeda | Kita 5-5 | Nozakicho 9-13 | 800% | 2,350,000 | 2,550,000 | 2,770,000 | +8.5% | +8.6% | +17.9% | 61 / 6,291 |
| Osaka – Umeda | Kita 5-1 | Umeda 1-8-17 | 1000% | 19,300,000 | 19,600,000 | 19,900,000 | +1.6% | +1.5% | +3.1% | 23 / 8,747 |
| Osaka – Namba | Naniwa 5-2 | Motomachi 3-1-4 | 600% | 1,430,000 | 1,550,000 | 1,680,000 | +8.4% | +8.4% | +17.5% | 50 / 4,812 |
| Osaka – Namba | Chuo 5-3 | Soemoncho 7-2 | 500% | 24,100,000 | 25,000,000 | 25,800,000 | +3.7% | +3.2% | +7.1% | 133 / 14,444 |
| Kyoto – Shijo-Kawaramachi | Higashiyama 5-1 | Gion-machi Kitagawa 277 (Shijo-dori, east of Yamato-oji) | 600% | 4,900,000 | 5,300,000 | 5,600,000 | +8.2% | +5.7% | +14.3% | 72 / 2,056 |
| Kyoto – Shijo-Kawaramachi | Shimogyo 5-5 | Otabi-cho 51 and 11 other parcels (Shijo-dori, east of Teramachi) | 700% | 11,000,000 | 11,500,000 | 12,000,000 | +4.5% | +4.3% | +9.1% | 79 / 5,183 |
| Kyoto – Shijo-Kawaramachi | Nakagyo 5-5 | Yamazaki-cho 238 and 1 other parcel (Kawaramachi-dori, south of Sanjo) | 700% | 5,600,000 | 6,200,000 | 6,430,000 | +10.7% | +3.7% | +14.8% | 76 / 6,229 |
| Kyoto – Shijo-Kawaramachi | Higashiyama 5-3 | Nishino-cho 216-2 (Shinmonzen-dori, east of Yamato-oji) | 400% | 1,230,000 | 1,380,000 | 1,430,000 | +12.2% | +3.6% | +16.3% | 87 / 5,137 |
| Kyoto – Kyoto Station | Kyoto-Minami 5-3 | Nishikujo Kawarajo-cho 7 | 400% | 523,000 | 564,000 | 605,000 | +7.8% | +7.3% | +15.7% | 27 / 1,714 |
| Kyoto – Kyoto Station | Shimogyo 5-6 | Higashi-Shiokoji-cho 734 and 1 other parcel (Karasuma-dori, south of Shichijo) | 600% | 8,100,000 | 8,870,000 | 9,140,000 | +9.5% | +3.0% | +12.8% | 78 / 7,046 |
| Fukuoka – Hakata Station | Fukuoka-Hakata 5-1 | Hakata-eki Higashi 1-12-6 | 600% | 5,700,000 | 5,740,000 | 5,800,000 | +0.7% | +1.0% | +1.8% | 50 / 8,987 |
| Fukuoka – Tenjin | Fukuoka-Chuo 5-14 | Maizuru 1-4-30 | 400% | 1,430,000 | 1,490,000 | 1,550,000 | +4.2% | +4.0% | +8.4% | 22 / 3,041 |
| Sapporo – Susukino | Sapporo-Chuo 5-2 | Odori-Nishi 6-chome 6-1 | 800% | 3,100,000 | 3,250,000 | 3,450,000 | +4.8% | +6.2% | +11.3% | 47 / 6,577 |
| Naha – Kokusai-dori | Naha 5-4 | Izumizaki 2-chome 2-1 | 300% | 462,000 | 474,000 | 492,000 | +2.6% | +3.8% | +6.5% | 25 / 2,188 |
| Naha – Kokusai-dori | Naha 5-5 | Tsuboya 2-6-5 | 300% | 385,000 | 404,000 | 411,000 | +4.9% | +1.7% | +6.8% | 27 / 1,939 |
| Kanazawa – Kanazawa Station | Kanazawa 5-21 | Hirooka 1-1-18 | 600% | 795,000 | 830,000 | 865,000 | +4.4% | +4.2% | +8.8% | 31 / 5,837 |
| Kanazawa – Kanazawa Station | Kanazawa 5-29 | Honmachi 2-16-16 | 600% | 1,180,000 | 1,230,000 | 1,280,000 | +4.2% | +4.1% | +8.5% | 45 / 6,260 |
| Takamatsu – Takamatsu Station | Takamatsu 5-11 | Togiya-machi 2-6 et al. | 600% | 480,000 | 486,000 | 495,000 | +1.2% | +1.9% | +3.1% | 24 / 2,574 |
Table 1 | Source: Prepared by MetroEngines Research & Consulting from MLIT Prefectural Land Price Survey (as of Jul 1, 2026), Land Price Publication (as of Jan 1, 2026) and the Real Estate Information Library. N=33 sites (commercial common sites, 14 markets). Jul 1, 2025 prices are the previous-year prices in the 2026 survey. Lodging within 500m covers properties with 10+ rooms within our coverage (as of September 2026).
Converting to Break-even ADR: Land Is 40% of Total Investment, +¥244 per Room in Six Months
A land-price change rate on its own cannot be used in a business plan. What can be used is “the ADR at which a project breaks even at that land price.” Here we carry over, unchanged, the calculation framework from our earlier analysis of hotel construction costs (¥8.7M to ¥71.4M per room across three hotel tiers, with break-even ADR in 12 markets). The assumptions are shown in the table below; only the land cost is replaced with each site’s land price and designated FAR.
| Item | Assumption | Basis / notes |
|---|---|---|
| Hotel type | Limited-service, new build | 25.0㎡ of gross floor area per room (a conservative setting, above the observed median of 16.5㎡) |
| Construction cost | ¥641,000/㎡ = ¥16.03M per room | 2024 RC construction at ¥526,000/㎡ plus +22.0% construction inflation |
| Soft costs | 20% of construction cost = ¥3.21M per room | Design and supervision fees, FF&E, pre-opening expenses |
| Land cost | Benchmark land price ÷ designated FAR × 25.0㎡ | Uses each site’s July 1, 2026 price and designated FAR |
| Financing | Floating rate 2.25%, LTV 60%, DSCR 1.3x | 25-year level payment; loan constant 5.23% |
| Required NOI yield | 4.08% | Loan constant × DSCR × LTV |
| Operating assumptions | GOP margin 45%, FF&E reserve 3%, occupancy 82% | Occupancy is a modeling assumption, not a measured value |
| Break-even ADR | Total investment × 4.08% ÷ (82% × 365 days × 0.42) | 0.42 = GOP margin 45% − FF&E 3% |
Table 2 | Source: MetroEngines Research & Consulting (the same model as our earlier analysis of construction cost per room, ¥8.7M to ¥71.4M). All figures are modeling assumptions and do not guarantee the profitability of any specific project.
Running the 33 sites through this framework, land cost as a share of total investment came to a median 40.1% (range 9.7% to 89.5%). The lowest land shares were Togiya-machi in Takamatsu at 9.7%, Tsuboya 2-chome in Naha at 15.1% and Hirooka 1-chome in Kanazawa at 15.8%; the highest were Ginza 2-chome at 89.5%, Ginza 6-chome at 87.3% and Soemoncho in Shinsaibashi at 87.0%. Even within “commercial land,” the weight of land in a project differs by nearly ninefold.
Next, we compare break-even ADR calculated at January 1, 2026 prices with break-even ADR at July 1 prices. The median difference was +¥244 (+2.0%). Expressed as a share of market ADR (estimated settled ADR, 12-month average), that is equivalent to +1.73%. The largest was +¥2,941 in Ginza 2-chome, and the smallest +¥12 at Togiya-machi in Takamatsu. Even with land prices up 4.3% in six months, break-even ADR moves only 2.0%, because land is 40% of total investment. Put the other way, at sites where land approaches 90% of the total, land-price changes pass almost directly into the required rate.
Maximum Viable Land Price: 21 of 33 Sites Are Viable, Headroom Narrows to 56%
Now we flip the perspective. Taking market ADR as given, what is the maximum land price at which break-even ADR is reached under the same assumptions? Subtracting construction and soft costs from the maximum total investment and dividing back by the designated FAR gives the maximum price per ㎡. This is a guide to “how much can be paid for the site.”
Of the 33 sites, 21 had a July 1, 2026 benchmark land price within the cap. The median headroom to the cap was +56.0%. Running the same calculation at January 1, 2026 prices gives +64.8%, meaning 8.8 points of headroom were eaten up by rising land prices in six months. In markets where land prices move by around +9% a year, headroom to the cap narrows by roughly 8 to 9 points a year.
The remaining 12 sites are above the cap. They include Marunouchi 3-chome (-43.8%), Ginza 2-chome (-78.0%), Ginza 6-chome (-72.7%), Soemoncho in Shinsaibashi (-85.5%), Meieki 4-chome (-50.6%), Umeda 1-chome (-72.6%) and Shinjuku 3-chome (-60.1%). This is not a judgment that “land is too expensive.” The correct reading is that these sites are in a price band that a limited-service hotel with 25.0㎡ per room and a 4.08% yield cannot reach, and are locations where other uses such as retail or offices can offer higher returns. Of the 12 sites, 11 were already above the cap as of January 1, 2026; the only site that newly crossed the cap in these six months was in Ginza 7-chome (headroom of +7.5% as of January 1, -0.0% as of July 1).
Two sites on the borderline deserve individual attention. At Hakata-eki Higashi 1-chome in Fukuoka, market ADR is ¥14,096 against a break-even ADR of ¥14,088, a difference of +0.1%; in Ginza 7-chome, market ADR is ¥17,949 against a break-even ADR of ¥17,952, a difference of -0.0%. They sit where shifting one assumption by a notch reverses the conclusion, so for these two sites the fine-tuning of floor area per room and financing terms will decide the outcome.
| Market | Benchmark site no. | Land cost per room | Land share | Break-even ADR Jan 1, 2026 | Break-even ADR Jul 1, 2026 | Six-month change | Market ADR 12-month avg. | ADR cushion | Max. viable land price (¥/㎡) | Headroom to cap |
|---|---|---|---|---|---|---|---|---|---|---|
| Tokyo – Ginza | Chuo 5-5 | ¥36.07M | 65.2% | ¥17,129 | ¥17,952 | +¥823 | ¥17,949 | -0.0% | 10,097,191 | -0.0% |
| Tokyo – Ginza | Chuo 5-9 | ¥15.42M | 44.5% | ¥10,897 | ¥11,248 | +¥351 | ¥17,949 | +59.6% | 8,654,735 | +133.9% |
| Tokyo – Ginza | Chuo 5-13 | ¥164.06M | 89.5% | ¥56,553 | ¥59,494 | +¥2,941 | ¥17,949 | -69.8% | 11,539,647 | -78.0% |
| Tokyo – Ginza | Chuo 5-14 | ¥132.14M | 87.3% | ¥46,816 | ¥49,134 | +¥2,318 | ¥17,949 | -63.5% | 10,097,191 | -72.7% |
| Tokyo – Ginza | Chiyoda 5-1 | ¥54.23M | 73.8% | ¥23,409 | ¥23,846 | +¥437 | ¥16,135 | -32.3% | 15,845,653 | -43.8% |
| Tokyo – Ginza | Minato 5-5 | ¥48.12M | 71.4% | ¥21,560 | ¥21,864 | +¥304 | ¥16,801 | -23.2% | 10,407,800 | -32.4% |
| Tokyo – Asakusa | Taito 5-17 | ¥12.86M | 40.1% | ¥9,989 | ¥10,418 | +¥429 | ¥14,649 | +40.6% | 7,250,320 | +101.4% |
| Tokyo – Asakusa | Taito 5-21 | ¥8.21M | 29.9% | ¥8,679 | ¥8,909 | +¥230 | ¥14,649 | +64.4% | 6,214,560 | +215.5% |
| Tokyo – Asakusa | Taito 5-6 | ¥5.30M | 21.6% | ¥7,848 | ¥7,965 | +¥117 | ¥14,649 | +83.9% | 5,178,800 | +388.6% |
| Tokyo – Shinjuku | Shinjuku 5-26 | ¥10.42M | 35.1% | ¥9,355 | ¥9,626 | +¥271 | ¥15,640 | +62.5% | 6,947,352 | +177.9% |
| Tokyo – Shinjuku | Shinjuku 5-10 | ¥72.50M | 79.0% | ¥28,559 | ¥29,776 | +¥1,217 | ¥15,640 | -47.5% | 9,263,136 | -60.1% |
| Tokyo – Shinjuku | Shinjuku 5-13 | ¥36.00M | 65.2% | ¥17,767 | ¥17,929 | +¥162 | ¥15,640 | -12.8% | 11,578,920 | -19.6% |
| Nagoya – Meieki | Nakamura 5-7 | ¥23.85M | 55.3% | ¥13,922 | ¥13,984 | +¥62 | ¥10,068 | -28.0% | 6,125,498 | -50.6% |
| Osaka – Umeda | Kita 5-11 | ¥9.79M | 33.7% | ¥9,071 | ¥9,423 | +¥352 | ¥10,667 | +13.2% | 3,270,082 | +39.2% |
| Osaka – Umeda | Fukushima 5-3 | ¥12.38M | 39.1% | ¥9,896 | ¥10,261 | +¥365 | ¥12,731 | +24.1% | 3,197,534 | +61.5% |
| Osaka – Umeda | Kita 5-5 | ¥8.66M | 31.0% | ¥8,831 | ¥9,054 | +¥223 | ¥10,667 | +17.8% | 4,360,109 | +57.4% |
| Osaka – Umeda | Kita 5-1 | ¥49.75M | 72.1% | ¥22,148 | ¥22,392 | +¥244 | ¥10,667 | -52.4% | 5,450,136 | -72.6% |
| Osaka – Namba | Naniwa 5-2 | ¥7.00M | 26.7% | ¥8,341 | ¥8,517 | +¥176 | ¥11,294 | +32.6% | 3,733,715 | +122.2% |
| Osaka – Namba | Chuo 5-3 | ¥129.00M | 87.0% | ¥46,816 | ¥48,114 | +¥1,298 | ¥12,322 | -74.4% | 3,744,889 | -85.5% |
| Kyoto – Shijo-Kawaramachi | Higashiyama 5-1 | ¥23.33M | 54.8% | ¥13,412 | ¥13,818 | +¥406 | ¥18,057 | +30.7% | 8,734,596 | +56.0% |
| Kyoto – Shijo-Kawaramachi | Shimogyo 5-5 | ¥42.86M | 69.0% | ¥19,575 | ¥20,155 | +¥580 | ¥14,768 | -26.7% | 7,352,980 | -38.7% |
| Kyoto – Shijo-Kawaramachi | Nakagyo 5-5 | ¥22.96M | 54.4% | ¥13,432 | ¥13,698 | +¥266 | ¥15,868 | +15.8% | 8,301,937 | +29.1% |
| Kyoto – Shijo-Kawaramachi | Higashiyama 5-3 | ¥8.94M | 31.7% | ¥9,044 | ¥9,145 | +¥101 | ¥18,057 | +97.5% | 5,823,064 | +307.2% |
| Kyoto – Kyoto Station | Kyoto-Minami 5-3 | ¥3.78M | 16.4% | ¥7,389 | ¥7,472 | +¥83 | ¥13,905 | +86.1% | 3,776,274 | +524.2% |
| Kyoto – Kyoto Station | Shimogyo 5-6 | ¥38.08M | 66.4% | ¥18,240 | ¥18,605 | +¥365 | ¥14,768 | -20.6% | 6,302,554 | -31.0% |
| Fukuoka – Hakata Station | Fukuoka-Hakata 5-1 | ¥24.17M | 55.7% | ¥14,007 | ¥14,088 | +¥81 | ¥14,096 | +0.1% | 5,805,646 | +0.1% |
| Fukuoka – Tenjin | Fukuoka-Chuo 5-14 | ¥9.69M | 33.5% | ¥9,267 | ¥9,389 | +¥122 | ¥15,395 | +64.0% | 4,510,792 | +191.0% |
| Sapporo – Susukino | Sapporo-Chuo 5-2 | ¥10.78M | 35.9% | ¥9,541 | ¥9,744 | +¥203 | ¥13,777 | +41.4% | 7,426,350 | +115.3% |
| Naha – Kokusai-dori | Naha 5-4 | ¥4.10M | 17.6% | ¥7,527 | ¥7,575 | +¥48 | ¥9,448 | +24.7% | 1,184,348 | +140.7% |
| Naha – Kokusai-dori | Naha 5-5 | ¥3.42M | 15.1% | ¥7,337 | ¥7,356 | +¥19 | ¥9,448 | +28.4% | 1,184,348 | +188.2% |
| Kanazawa – Kanazawa Station | Kanazawa 5-21 | ¥3.60M | 15.8% | ¥7,367 | ¥7,414 | +¥47 | ¥8,833 | +19.1% | 1,913,936 | +121.3% |
| Kanazawa – Kanazawa Station | Kanazawa 5-29 | ¥5.33M | 21.7% | ¥7,908 | ¥7,976 | +¥68 | ¥8,833 | +10.7% | 1,913,936 | +49.5% |
| Takamatsu – Takamatsu Station | Takamatsu 5-11 | ¥2.06M | 9.7% | ¥6,902 | ¥6,914 | +¥12 | ¥7,956 | +15.1% | 1,265,441 | +155.6% |
Table 3 | Source: MLIT Prefectural Land Price Survey and Land Price Publication (2026, Real Estate Information Library) / MetroEngines Research & Consulting (estimated settled ADR, 12-month average Sep 2025–Aug 2026, municipality × business hotels). Number of properties covered: Chiyoda Ward 63, Chuo Ward 127, Minato Ward 95, Taito Ward 148, Shinjuku Ward 69, Nakamura Ward (Nagoya) 63, Naniwa Ward (Osaka) 45, Chuo Ward (Osaka) 155, Fukushima Ward (Osaka) 4, Kita Ward (Osaka) 53, Shimogyo Ward (Kyoto) 111, Nakagyo Ward (Kyoto) 76, Higashiyama Ward (Kyoto) 19, Minami Ward (Kyoto) 50, Hakata Ward (Fukuoka) 131, Chuo Ward (Fukuoka) 68, Chuo Ward (Sapporo) 99, Naha 103, Kanazawa 81, Takamatsu 52 (each the minimum over the 12 months). Fukushima Ward, Osaka has a thin sample of N=4, so the assessments for its two sites (Fukushima 6-chome and Oyodominami 1-chome) should be treated as indicative only. Break-even ADR and the maximum viable land price are estimates based on this article’s assumptions.
Sensitivity Analysis: Shifting Floor Area per Room by 5㎡ Changes the Viable Site Count by 7
We check how robust the assumptions are. Setting floor area per room at three levels (20.0㎡, 25.0㎡ and 30.0㎡) and moving market ADR by ±10%, we look at how many of the 33 sites remain in the viable zone and the median headroom to the cap.
| Floor area per room \ Market ADR | −10% | Base | +10% | Median break-even ADR |
|---|---|---|---|---|
| 20.0㎡ | 22 sites / +101.1% | 23 sites / +140.7% | 26 sites / +180.4% | ¥8,334 |
| 25.0㎡ (base) | 19 sites / +19.4% | 21 sites / +56.0% | 22 sites / +93.2% | ¥10,418 |
| 30.0㎡ | 9 sites / −38.4% | 14 sites / −6.4% | 20 sites / +25.8% | ¥12,501 |
Table 4 | Source: MetroEngines Research & Consulting. Each cell shows “number of sites in the viable zone (N=33) / median headroom to the cap.” Median break-even ADR is the median of the 33 sites. Same model as Table 2.
There are two ways to read this. First, narrowing floor area per room by 5㎡, from 25.0㎡ to 20.0㎡, increases viable sites from 21 to 23 and widens median headroom from +56.0% to +140.7%. Floor area per room moves construction cost, soft costs and land cost all at once, so its effect is far larger than the 8.8 points from six months of land-price gains. Second, at 30.0㎡ per room, even the base case drops to 14 viable sites with a median headroom of -6.4%. At the same land price, the shape of the concept decides whether a project is viable. A six-month change in land prices stays within the range that this design latitude can absorb.
Benchmark Sites in Resorts and Tourist Areas: Hakuba +35.6%, Yufuin +2.2%, Compared with Rate Growth
Tourist areas and resorts are treated in a separate table from urban areas, for two reasons. One is that common sites barely exist there. In Kutchan/Niseko, Furano, Hakuba, Nozawa Onsen, Yufuin and Miyakojima, we could not find a standard site with matching coordinates, and the six-month change could be calculated only for two sites in Karuizawa (Karuizawa 5-3: H1 +9.6%, H2 +9.6%; Karuizawa -1: H1 +6.6%, H2 +7.7%). The other is that floor area per room for resort hotels differs greatly from urban limited-service hotels, so the break-even ADR model above cannot be applied as is.
For tourist areas, therefore, we set the year-on-year change of benchmark sites for two years (the 2026 and 2025 surveys) side by side and compared them with the year-on-year change in our estimated settled ADR. Among the top commercial-land gains in the 2026 survey, two sites in Hakuba Village, Nagano ranked 1st (Hakuba 5-1, +35.6%) and 4th (Hakuba 5-2, +25.9%) nationwide, and Nozawaonsen Village ranked 2nd (+27.0%).
| Area | Benchmark site no. | Zoning | Jul 1, 2026 (¥/㎡) | 2026 change | 2025 change | Surroundings (as described in the survey) | Est. settled ADR YoY (N) |
|---|---|---|---|---|---|---|---|
| Niseko/Kutchan | Kutchan 5-1 | Commercial district | 192,000 | +15.0% | +15.2% | Commercial area along the station-front street lined with mid-sized shops, sales offices, etc. | +2.7% (21 properties) |
| Niseko/Kutchan | Kutchan 5-2 | Commercial district | 125,000 | +13.6% | +15.8% | Central commercial area lined with low-rise shop-houses, offices, etc. | Same as above |
| Niseko/Kutchan | Niseko 5-1 | Not designated | 32,500 | +10.2% | +11.3% | Commercial area along a prefectural road lined with retail shops, restaurants, etc. | +9.8% (10 properties, Niseko Town) |
| Furano | Furano 5-1 | Neighborhood commercial district | 56,800 | +5.0% | +5.0% | Commercial area with retail shops as well as large commercial facilities | +4.1% (13 properties) |
| Hakuba | Hakuba 5-1 | Not designated | 32,000 | +35.6% | +14.6% | Station-front commercial area lined with retail shops, restaurants, etc. | +16.6% (44 properties) |
| Hakuba | Hakuba 5-2 | Not designated | 85,000 | +25.9% | +29.3% | Commercial area along the Hosono road lined with lodging facilities, restaurants, etc. | Same as above |
| Nozawa Onsen | Nozawaonsen 5-1 | Not designated | 50,800 | +27.0% | +24.2% | Commercial area near the hot-spring town with many small and mid-sized shops, minshuku guesthouses, etc. | +3.2% (23 properties) |
| Karuizawa | Karuizawa 5-1 | Neighborhood commercial district | 435,000 | +16.0% | +10.3% | Commercial area along a prefectural road lined with specialty shops | +5.4% (52 properties) |
| Karuizawa | Karuizawa 5-3 | Neighborhood commercial district | 250,000 | +20.2% | +11.2% | Commercial area along a prefectural road lined with shops, restaurants, etc. | Same as above |
| Yufuin | Yufu 5-3 | Commercial district | 68,500 | +2.2% | +1.5% | Commercial area lined with shops, restaurants, ryokan, etc. | +0.8% (137 properties, Yufu City) |
| Miyakojima | Miyakojima 5-1 | Commercial district | 227,000 | +6.1% | +15.1% | Commercial area along Nishizato-odori lined with various shops | +12.4% (72 properties) |
| Miyakojima | Miyakojima 5-3 | Quasi-residential district | 150,000 | +12.8% | +14.7% | Commercial area near the beach with shop-and-apartment buildings as well as hotels | Same as above |
Table 5 | Source: MLIT Prefectural Land Price Survey (as of Jul 1, 2026 and Jul 1, 2025, Real Estate Information Library). Surroundings are translated from the survey’s descriptions. Estimated settled ADR from MetroEngines Research & Consulting (municipality level, all categories, 12-month average Sep 2025–Aug 2026 compared with the same period a year earlier; figures in parentheses are the median number of properties covered over the 12 months).
Three things can be read from this comparison. First, there are areas where land-price growth and rate growth line up in the same direction, and areas where they do not. Hakuba (land +35.6%, ADR +16.6%), Miyakojima (land +6.1%, ADR +12.4%) and Yufuin (land +2.2%, ADR +0.8%) all point the same way. Second, there are also areas where land-price growth far outpaces rate growth, such as Nozawa Onsen (land +27.0% / ADR +3.2%) and Kutchan (+15.0% / +2.7%). Here the land-price benchmark has moved first, so validating an acquisition price requires separate support from the rate side. Third, Miyakojima 5-1 slowed from +15.1% in the 2025 survey to +6.1% in the 2026 survey; even at the same site, momentum changes from year to year. Fixing a land-price benchmark on a single year’s change is risky.
Separately, one residential site in Furano City (Furano -3, ¥68,100/㎡) rose +32.0%, ranking 1st nationwide for residential land gains in the 2026 survey. The survey describes it as “a residential area near a ski resort with pensions and other lodging as well as ordinary houses,” and its zoning is Category 2 Medium-to-High-Rise Exclusive Residential District. Whether a lodging facility can be built is determined by zoning, so the site cannot be treated as a development candidate on the strength of its growth rate alone.
Constraints Land Prices Do Not Show: FAR, Zoning and Flood Risk
Finally, we overlay three constraints that do not appear in land-price figures. All were checked for the 33 matched sites using geospatial data from the Real Estate Information Library.
1. Designated FAR spans an eightfold range
Designated FAR at the 33 sites ranges from 300% to 1,300%. Because land cost is divided back by FAR, at the same land price the per-room burden moves inversely with FAR. The two sites on Kokusai-dori in Naha were at 300%, while Marunouchi and Meieki were at 1,300%. Note that designated FAR is subject to the base FAR limit imposed by front-road width, which must be checked separately at the planning stage.
2. All 33 sites are in commercial zoning
31 sites are in commercial districts and 2 in neighborhood commercial districts (the two Naha sites). No building restrictions apply to lodging facilities. On the tourist-area side, however, several sites in Hakuba, Nozawa Onsen and Niseko are “not designated” (outside zoning districts), so development feasibility must be confirmed through separate procedures.
3. 23 sites lie within assumed flood inundation zones
23 sites fall within flood inundation zones under the maximum assumed scale (4 of them in inundation depth rank 3 = 3.0m to under 5.0m). 16 sites are within storm-surge inundation zones and 2 within tsunami inundation zones (the two sites in Fukushima Ward, Osaka, with an assumed 1.0m to 2.0m). These factors affect design, insurance terms and collateral valuation.
Source: Prepared by MetroEngines Research & Consulting from the MLIT Real Estate Information Library (flood inundation zones [maximum assumed scale], storm-surge inundation zones, tsunami inundation zones, zoning). N=33 sites. Inundation depth ranks follow the National Land Numerical Information definitions (1 = 0 to under 0.5m, 2 = 0.5m to under 3.0m, 3 = 3.0m to under 5.0m).
On the FAR constraint, front-road width can pull the base FAR well below the designated FAR (in a separate analysis of 974 commercial sites, a 4m front road cut a 600% designated FAR to 240% and raised land cost per room 2.5-fold). On location-driven rate gradients, hotel ADR declines with distance from the station, by about 2.7% per 100m, an effect concentrated in major cities. Both should be considered alongside the results here.
Conclusion: What to Re-check at Each Half-Year Update Is “Headroom,” Not “Level”
Reading the 2026 Prefectural Land Price Survey with a focus on commercial land in lodging clusters, the H2 change (January 1→July 1, 2026) was a median +4.3%, 1.5 times the +2.8% national average for commercial common sites. Translated into business-plan terms, this means break-even ADR rose by a median +¥244 per room (equal to 1.7% of market ADR), and the headroom to the maximum viable land price narrowed by a median 8.8 points.
A three-step approach works well in practice. First, update second-half investment committees to the benchmark land price with a July 1 price date; relying on the annual official prices alone means using figures that are nine months old. Second, manage decisions not by the land-price level but by headroom to the viable cap. In markets where headroom narrows by 8 to 9 points a year, the later a concept is finalized, the more often its assumptions must be rebuilt. Third, at sites with thin headroom (in this article, Hakata-eki Higashi and Ginza 7-chome, within ±0.1%), the latitude that can be absorbed through the design of floor area per room exceeds the range of land-price movement. A decision to trim floor area per room by 5㎡ has the effect of fully offsetting six months of land-price gains.
The next official update is the Land Price Publication in March 2027 (price date January 1, 2027). Until then, the lightest way to keep checking is to run the same 33 sites through the same assumptions and track the pace at which headroom is narrowing.
References and Sources
■ Government statistics and public data
- MLIT, “National Land Prices Rise for the Fifth Consecutive Year on an All-Use Average: 2026 (Reiwa 8) Prefectural Land Price Survey” (released September 15, 2026, Japanese)
- MLIT, “Overview of the 2026 (Reiwa 8) Prefectural Land Price Survey” (PDF, Japanese; half-yearly changes at common sites and top-change rankings)
- MLIT, 2026 (Reiwa 8) Prefectural Land Price Survey: related data (Japanese)
- MLIT, “Overview of the 2026 (Reiwa 8) Land Price Publication” (PDF, March 2026, Japanese)
- MLIT Real Estate Information Library (individual sites of the Land Price Publication and Prefectural Land Price Survey, zoning, and flood, storm-surge and tsunami inundation zones)
- MLIT National Land Numerical Information, “Flood Inundation Zone Data (by river)” (definition of inundation depth ranks, Japanese)
■ Market data
- MetroEngines Research & Consulting: estimated settled ADR (by municipality × category, Sep 2025–Aug 2026), lodging property location and room-count master, and estimates of break-even ADR and maximum viable land price