

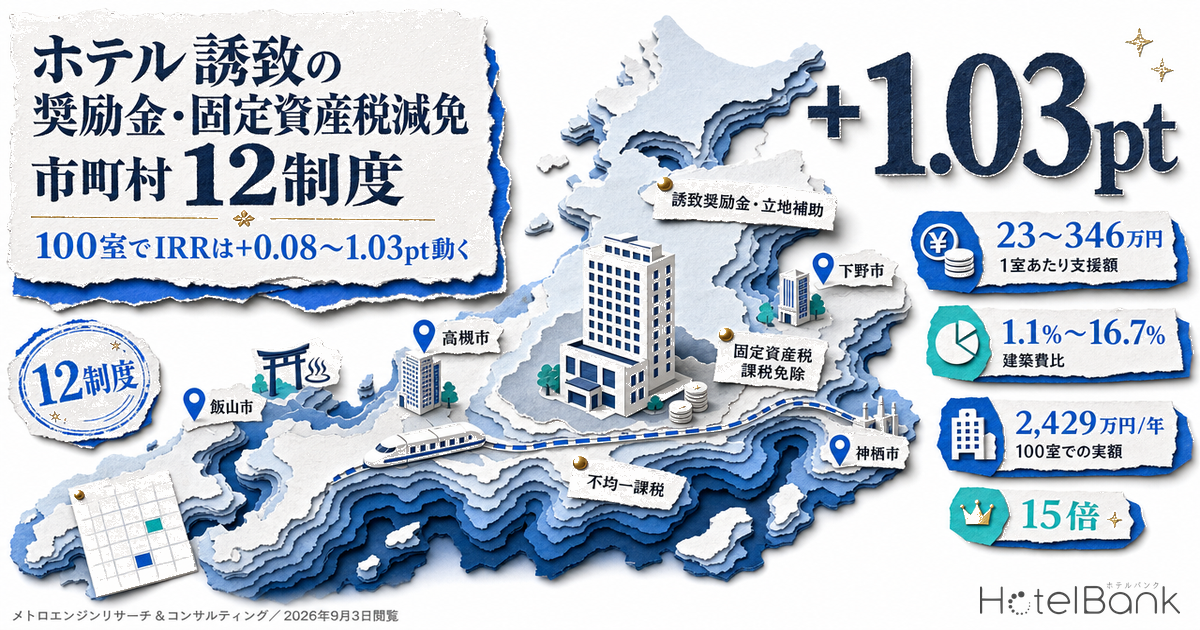
Once land, demand and construction cost are locked into a hotel business plan, one variable is still left to add: the attraction incentives that the host municipality offers on its own. Headline caps such as “¥100 million” look impressive, but what a developer actually receives depends on room count and property-tax level — for a 100-room hotel it comes to roughly ¥24 million a year. This article goes directly to municipal ordinances and grant guidelines to inventory 12 programs, converts each cap into a per-room figure, and then translates the results into how many points IRR moves and how many years simple payback shortens for a 100-room model.
Metric Definitions Used in This Article
- ADR (Average Daily Rate): an estimated settled rate (tax-excluded equivalent), calculated by applying a property-type correction factor to the lowest published plan price on OTAs and similar channels (per room, 2 guests, tax-included). Checked against property-level results disclosed by listed hotel REITs (91 properties, latest 3 months), the median error is about 7%. This is an estimate and differs from each property’s actual settled prices and accounting figures. Area-level ADR is the median of the properties covered (the level of a typical property in that area).
- Construction cost per room: a benchmark of ¥20.67 million, back-calculated from a unit floor area of 35.0㎡ per room across 31 planned projects (excluding land).
- Property tax per room: a benchmark range of ¥160,000–240,000 per year. Where city planning tax is included, the 0.3% cap rate is added and converted at 1.214x.
- Data sources: MetroEngines Research & Consulting; ordinances and grant guidelines of each municipality (primary sources, accessed September 3, 2026)
- — Municipal attraction incentives confirmed in ordinance text or grant guidelines: 12 programs. Two attraction grants/location subsidies, two tax exemptions and eight non-uniform (reduced-rate) taxation programs (plus two prefecture-level programs shown for reference).
- — Per room, support ranges from ¥0.23 million to ¥3.46 million, or 1.1%–16.7% of the ¥20.67 million construction cost per room. What creates this 15x spread is not the cap, but whether a fixed-percentage capital subsidy exists.
- — In a 100-room, 20-year hold model, IRR rises by +0.08–1.03pt and simple payback shortens by 0.20–2.27 years. The largest effect is the Shimotsuke type, the smallest the Kamisu type.
- — This effect range barely depends on ADR and occupancy assumptions. Flexing ADR by ±¥1,500 and occupancy by ±8pt, the non-uniform taxation type stays fixed at +0.08pt and the Shimotsuke type stays within +0.96–1.11pt. Base IRR, by contrast, moves 4.68pt, from 3.04% to 7.72%.
- — Takatsuki’s ¥100 million annual cap only starts to bind at roughly 343 rooms or more. For a 100- or 200-room plan, the number to use is not the cap but “your own property tax + city planning tax × number of eligible years.”
Conclusion — Incentives Move a 100-Room Model’s IRR by +0.08–1.03pt and Cut Payback by Up to 2.27 Years
Hotel and ryokan attraction incentives that municipalities set up through their own ordinances fall broadly into three types: (1) attraction grants and location subsidies under attraction ordinances; (2) property-tax exemptions under corporate attraction ordinances or lodging-facility utilization ordinances; and (3) non-uniform taxation (reduced tax rates) for facilities registered under the International Tourism Hotel Improvement Act. Type (1) has by far the largest monetary impact, and within it, capital subsidies that apply a fixed percentage to acquisition cost stand out. Type (3), by contrast, has a long history and many programs, but because it covers buildings only and the reduction rates are modest, it moves IRR in a 100-room model by only about +0.06–0.21pt.
The key point is that the size of the cap and the amount actually received do not match. Takatsuki City’s “Hotel Attraction Grant” has a cap of ¥100 million per fiscal year, but the grant is calculated as “an amount equivalent to the property tax and city planning tax on the specified fixed assets.” Adding city planning tax to a property-tax level of ¥160,000–240,000 per room per year gives ¥194,000–291,000 per room per year. The ¥100 million cap only starts to bind at roughly 343–515 rooms, so 100- or 200-room plans never reach it. The number to put in the business plan is not “¥100 million” but “your own property and city planning taxes × 5 years.”
Scope — This Article Covers Municipalities’ Own Ordinances Only
Hotel taxes and subsidies sit in separate layers, and mixing them leads to double-counting in business plans. We define the scope of this article up front.
National regional tax measures — out of scope
Accelerated depreciation in depopulated, remote-island and peninsula areas, and the national compensation for the resulting property-tax revenue loss, are nationwide programs based on statute. They are not analyzed here. This article looks only at municipalities’ own ordinances, which apply on top of those national measures.
Level of holding taxes — out of scope
The actual property-tax level of ¥160,000–240,000 per room per year was verified in a previous HotelBank analysis. This article covers the programs that reduce or offset that tax, and uses that level only as a benchmark for conversions.
National subsidies — out of scope
Subsidies for labor-saving investment or visitor-reception improvements funded by the Japan Tourism Agency budget are national programs that go through open calls and selection. This article covers local-government attraction incentives tied to the location itself, which differ in that they become a comparison axis for site selection.
Three Types of Programs — 12 Municipal Programs Confirmed in Ordinance Text and Grant Guidelines
We collected municipal programs that explicitly target lodging facilities through web searches and each local government’s ordinance database and official pages. The tables below include only programs whose ordinance text or grant guidelines we could confirm. Municipalities where the existence of a program could not be confirmed from published materials are not listed (this does not mean no program exists).
A. Attraction grants and location subsidies
| Municipality | Program / legal basis | Support and cap | Period | Key requirements |
|---|---|---|---|---|
| Takatsuki City, Osaka (大阪府高槻市) | Takatsuki City Ordinance on the Attraction of Hotels and Ryokan (Ordinance No. 14 of 2016; promulgated March 29, 2016, effective April 1, 2016; amended June 15, 2018) | Hotel Attraction Grant = amount equivalent to property tax and city planning tax on the specified fixed assets (capped at ¥100 million) / Conference Facility Grant = 10% of construction cost (capped at ¥100 million) | 5 fiscal years after the start of operations (conference facilities: one time) | New builds: hotels 50+ rooms, ryokan 20+ rooms. Expansions: new portion of 25+ rooms (hotels) or 10+ rooms (ryokan), and a total of 50+ (hotels) or 20+ (ryokan). Conference facilities: 300㎡+ floor area and able to serve food and drink from a kitchen or similar |
| Shimotsuke City, Tochigi (栃木県下野市) | Hotel Location Promotion Subsidy (established July 1, 2025) | New-build subsidy = 10% of acquisition cost (capped at ¥200 million) / Operating subsidy = amount equivalent to property and city planning taxes, 10% of land/building rent (annual cap ¥10 million), 50% of water charges (annual cap ¥2 million), 50% of sewer charges (annual cap ¥2 million) | New-build subsidy at opening / operating subsidy for 5 years | Hotel business under the Hotel Business Act with 50+ rooms. Must open within 3 years of land acquisition and operate continuously for 10+ years after opening. Priority area is around Jichi Medical University Station and the university, but the entire city is eligible |
| Kyoto Prefecture (prefecture-wide program, reference) | Kyoto Prefecture Grant Guidelines for the Lodging Facility Location Promotion Subsidy (Public Notice No. 656, November 24, 2017; latest amendment Public Notice No. 173, effective March 31, 2026) | 5% of invested fixed assets, etc. (7% if a food preparation facility is installed). Caps: ¥200 million (large), ¥66 million (medium), ¥20 million (small). Employment promotion incentive of ¥30 million for large facilities, among others | On completion (employment promotion is separate) | Large = 10+ rooms or 3,000㎡+ total floor area, and ¥200 million+ in invested fixed assets or 10+ employees. Applies to construction started on or after April 1, 2017 |
| Aichi Prefecture / Nagoya City (reference) | Aichi Prefecture Luxury Hotel Location Promotion Subsidy / Nagoya City Luxury Hotel Location Promotion Subsidy | 10% of eligible costs, up to ¥1 billion per project (up to ¥2 billion combined from prefecture and city for sites in Nagoya) | — | 150+ rooms (100+ if a banquet hall of 1,000㎡+ is installed), average room size of 45㎡+, suites at 5%+ of total rooms, a state-guest-class room (roughly 100㎡+), and more. Applications accepted May 1, 2025 – March 31, 2030 |
B. Tax exemptions under corporate attraction or utilization ordinances
| Municipality | Program / legal basis | Support | Period | Key requirements |
|---|---|---|---|---|
| Minamiawaji City, Hyogo (兵庫県南あわじ市) | Minamiawaji City Corporate Attraction Ordinance / tax special measures for depopulated areas / Regional Future Investment Promotion Act, among others | Property-tax exemption. The lodging business (excluding boarding houses, i.e. ryokan/hotel operations and simple lodging) is explicitly listed as an eligible industry | Corporate Attraction Ordinance: 5 or 3 fiscal years for both new builds and expansions / depopulated areas: 3 fiscal years / industrial parks: 5 fiscal years | Corporate Attraction Ordinance requires investment of ¥100 million+. Depopulated-area exemption for the lodging business: ¥5–20 million. Application deadline is January 31 of the year after the facility is put into use |
| Iiyama City, Nagano (長野県飯山市) | Iiyama City Lodging Facility Utilization Promotion Ordinance | Exemption from property tax and city planning tax | Up to 10 years | Acquire a hotel, ryokan or simple-lodging facility in the city that is operating or previously operated, and run a lodging, retail or restaurant business. At least 1 full-time employee and no delinquent city taxes. Applies to acquisitions on or after January 2, 2018. Acquisitions from relatives within the second degree are excluded |
C. Non-uniform taxation for facilities registered under the International Tourism Hotel Improvement Act
These ordinances use provisions of the Local Tax Act to reduce the property-tax rate for facilities registered under the International Tourism Hotel Improvement Act (Act No. 279 of 1949). According to the Japan Tourism Agency’s tally, registrations as of March 31, 2026 totaled 2,283 facilities: 924 hotels and 1,359 ryokan. Registration requires meeting facility standards such as room count as well as staffing standards, and the Japan Tourism Agency explains that registration allows “each local government, at its discretion, to apply non-uniform local taxation.” In other words, this type uses the national registration system as a vehicle onto which municipalities voluntarily layer a tax reduction.
| Municipality | Reduced tax rate | Standard rate | Eligible years | Ordinance / notes |
|---|---|---|---|---|
| Takachiho Town, Miyazaki (宮崎県高千穂町) | 0.8% | 1.4% | 10 fiscal years | Ordinance No. 3 of 1974 (promulgated March 25, 1974; amended and effective March 29, 1984). Filing required within 1 month of registration and by January 31 each year |
| Itako City, Ibaraki (茨城県潮来市) | 1.0% | 1.4% | Continues until registration is revoked | Ordinance No. 13 of 1963 (promulgated April 5, 1963; amended April 1, 2001). Applies from the fiscal year after registration |
| Hiraizumi Town, Iwate (岩手県平泉町) | 50% of the standard rate | 1.4% | 6 fiscal years | Ordinance No. 1 of 1982 (promulgated March 31, 1982). Covers buildings used for a registered ryokan business |
| Ureshino City, Saga (佐賀県嬉野市) | 0.7% | 1.4% | 5 fiscal years | Ordinance No. 54 (effective January 1, 2006). Applies from April 1 of the year after registration; application due by January 31 of that year |
| Matsue City, Shimane (島根県松江市) | One-third reduction of the tax amount | 1.4% | 5 fiscal years | Buildings only. Filing due 7 days before the payment deadline |
| Kamisu City, Ibaraki (茨城県神栖市) | 1.0% | 1.4% | 5 years | From the first fiscal year property tax is levied after registration. Registration certificate and floor plan required |
| Hachinohe City, Aomori (青森県八戸市) | 0.8% | 1.6% | 3 years | Ordinance on special measures of the Hachinohe City Tax Ordinance for the development of international tourism hotels. Extensions and renovations: 3 years on the increase in assessed value. Application due January 31 of the fiscal year before the tax year |
| Toba City, Mie (三重県鳥羽市) | 1.12% | 1.4% | Not confirmed in city’s published materials | City planning tax not covered. Only the portion used for the hotel business |
Note the wide variation in duration and reduction rate. Takachiho (10 fiscal years) and Itako (as long as registration continues) are long-term types, while Hachinohe’s ends after 3 years. Hachinohe’s standard rate is itself 1.6%, above the 1.4% standard, so its reduced 0.8% amounts to “half.” Even among programs that all offer “non-uniform taxation,” the amount that lands in a business plan can differ by nearly 10x.
Where the 12 Municipalities Are — Attraction Grants Cluster Near Cities, Non-Uniform Taxation in Tourist Areas
Color-coding the map shows that program type is tied to geographic character. Attraction grants and location subsidies (dark blue) are found in municipalities like Takatsuki and Shimotsuke that are close to metropolitan areas yet have extremely thin room stock. Takatsuki is a core city with a population of around 340,000, yet the room stock tracked by MetroEngines Research is only 12 properties and 382 rooms. Shimotsuke has 9 properties and 172 rooms. The pattern is cities with thin room stock actively courting hotels even at a fiscal cost.
Non-uniform taxation (light blue), by contrast, is common in municipalities that already have room stock as hot-spring or tourist destinations, such as Toba, Ureshino, Takachiho and Matsue. These ordinances also date back a long way — 1963 (Itako), 1974 (Takachiho) and 1982 (Hiraizumi) — and have long served as a standing reduction supporting tourism locations. Rather than influencing new development decisions, they are more realistically read as programs that matter when existing stock is renewed or rebuilt.
Converting to a Per-Room Basis — 1.1% to 16.7% of ¥20.67 Million Construction Cost
To compare programs side by side, caps and tax rates need to be normalized to “how much per room.” Assuming a 100-room hotel, we use two benchmarks: a construction cost of ¥20.67 million per room (back-calculated from a unit floor area of 35.0㎡ per room across 31 planned projects) and a property-tax level of ¥160,000–240,000 per room per year. For programs that include city planning tax, we add the 0.3% cap rate and calculate on ¥194,000–291,000 per room per year.
| Program | Type | Support per room | % of construction cost | 100-room total |
|---|---|---|---|---|
| Shimotsuke: 10% new-build subsidy (cap ¥200M) + 5-year operating subsidy | Subsidy | ¥2.97–3.46M | 14.4–16.7% | ¥297–346M |
| Iiyama: 10-year exemption from property and city planning taxes | Tax exemption | ¥1.94–2.91M | 9.4–14.1% | ¥194–291M |
| Takatsuki: Hotel Attraction Grant (equivalent to property and city planning taxes, 5 years) | Grant | ¥0.97–1.46M | 4.7–7.0% | ¥97–146M |
| Kyoto Prefecture: Lodging Facility Location Promotion (5% of invested fixed assets) | Subsidy | ¥1.03M | 5.0% | ¥103.35M |
| Minamiawaji: Corporate Attraction Ordinance, 5-year exemption | Tax exemption | ¥0.80–1.20M | 3.9–5.8% | ¥80–120M |
| Takachiho: 0.8% × 10 fiscal years | Non-uniform taxation | ¥0.69–1.03M | 3.3–5.0% | ¥69–103M |
| Minamiawaji: depopulated area, 3-year exemption | Tax exemption | ¥0.48–0.72M | 2.3–3.5% | ¥48–72M |
| Hiraizumi: 50% of standard rate × 6 fiscal years | Non-uniform taxation | ¥0.48–0.72M | 2.3–3.5% | ¥48–72M |
| Itako: 1.0% (while registered; modeled over 10 years) | Non-uniform taxation | ¥0.46–0.69M | 2.2–3.3% | ¥46–69M |
| Ureshino: 0.7% × 5 fiscal years | Non-uniform taxation | ¥0.40–0.60M | 1.9–2.9% | ¥40–60M |
| Matsue: one-third tax reduction × 5 fiscal years | Non-uniform taxation | ¥0.27–0.40M | 1.3–1.9% | ¥27–40M |
| Hachinohe: 0.8% (standard 1.6%) × 3 fiscal years | Non-uniform taxation | ¥0.24–0.36M | 1.2–1.7% | ¥24–36M |
| Kamisu: 1.0% × 5 fiscal years | Non-uniform taxation | ¥0.23–0.34M | 1.1–1.7% | ¥23–34M |
The range runs from ¥0.23 million to ¥3.46 million per room — a full 15x spread. It is tempting to be drawn to the size of the cap, but what creates the practical difference is “whether there is a fixed-percentage capital subsidy.” Shimotsuke’s new-build subsidy (10% of acquisition cost, capped at ¥200 million) and Kyoto Prefecture’s 5% of invested fixed assets apply directly to acquisition cost regardless of holding taxes, so the amount grows with scale. Programs based on property tax, on the other hand, never reach ¥3 million per room no matter how many years they run.
Three caveats apply. First, property tax on buildings declines every year through the age-based depreciation adjustment, so this estimate — which applies the first-year tax amount over 10 years — is biased upward. Second, most non-uniform taxation programs cover buildings only (Matsue and Toba explicitly limit it to buildings), so applying the reduction rate to total holding taxes, including land and depreciable assets, also leans toward the upper bound. Third, many programs require designation or certification plus an application every fiscal year, and a missed application immediately means no payment. When building these into a business plan, the conservative approach is to use the lower end of the ranges in the table above.
Sensitivity in a 100-Room Model — IRR +0.08–1.03pt, Payback 0.20–2.27 Years Shorter
Next, we translate these into investment metrics. The model assumes a new 100-room lodging-focused hotel in a regional core city. Assumptions are shown in the table below: construction cost of ¥20.67 million per room; ADR of ¥11,000, close to Takatsuki’s 12-month median estimated settled ADR; assumed occupancy of 80% (a business-plan model assumption as of September 2026, not an observed value); and a GOP margin of 50% (the low end of the 50–60% industry guideline for limited-service hotels).
| Assumption | Value | Basis / notes |
|---|---|---|
| Rooms | 100 rooms | Meets both Takatsuki’s 50-room new-build requirement and Shimotsuke’s 50-room requirement |
| Construction cost | ¥2.067 billion | ¥20.67 million per room (back-calculated from 35.0㎡ unit floor area across 31 planned projects) |
| Land acquisition cost | ¥500 million | Assumed value for a regional core city |
| Total investment | ¥2.567 billion | — |
| ADR (estimated settled basis) | ¥11,000 | Close to Takatsuki’s estimated settled ADR 12-month median of ¥10,800 (latest month N=7 properties) |
| Assumed occupancy | 80% | Business-plan assumption (not an observed value) |
| Total revenue (rooms + ancillary) | ¥353.32 million | Room revenue ¥321.2 million × 1.10 |
| GOP margin | 50% | Low end of the 50–60% industry guideline for limited-service hotels. GOP ¥176.66 million |
| Property tax and city planning tax | ¥24.29 million/yr | Property tax of ¥200,000 per room + city planning tax (0.3/1.4) |
| FF&E reserve | 3% of revenue | ¥10.60 million |
| NOI | ¥141.77 million | NOI yield 5.52% |
| Holding period / exit | 20 years / 5.5% cap rate | Net of 3% selling costs |
| Program | Type | Total support | IRR | vs. base | Simple payback | Reduction |
|---|---|---|---|---|---|---|
| No incentives (base) | — | — | 5.45% | — | 18.11 yrs | — |
| Shimotsuke: 10% new-build (cap ¥200M) + 5-year operating subsidy | Subsidy | ¥321.43M | 6.48% | +1.03pt | 15.84 yrs | 2.27 yrs |
| Iiyama: 10-year exemption from property and city planning taxes | Tax exemption | ¥242.86M | 6.06% | +0.61pt | 16.39 yrs | 1.71 yrs |
| Takatsuki: Hotel Attraction Grant (5 years) | Grant | ¥121.43M | 5.79% | +0.35pt | 17.25 yrs | 0.86 yrs |
| Kyoto Prefecture: Lodging Facility Location Promotion (5%) | Subsidy | ¥103.35M | 5.78% | +0.33pt | 17.38 yrs | 0.73 yrs |
| Minamiawaji: Corporate Attraction Ordinance, 5-year exemption | Tax exemption | ¥100M | 5.73% | +0.28pt | 17.40 yrs | 0.71 yrs |
| Takachiho: 0.8% × 10 fiscal years | Non-uniform taxation | ¥85.71M | 5.66% | +0.21pt | 17.50 yrs | 0.60 yrs |
| Minamiawaji: depopulated area, 3-year exemption | Tax exemption | ¥60M | 5.63% | +0.18pt | 17.68 yrs | 0.42 yrs |
| Hiraizumi: 50% of standard rate × 6 fiscal years | Non-uniform taxation | ¥60M | 5.61% | +0.17pt | 17.68 yrs | 0.42 yrs |
| Ureshino: 0.7% × 5 fiscal years | Non-uniform taxation | ¥50M | 5.59% | +0.14pt | 17.75 yrs | 0.35 yrs |
| Itako: 1.0% (modeled over 10 years) | Non-uniform taxation | ¥57.14M | 5.59% | +0.14pt | 17.70 yrs | 0.40 yrs |
| Matsue: one-third tax reduction × 5 fiscal years | Non-uniform taxation | ¥33.33M | 5.54% | +0.09pt | 17.87 yrs | 0.24 yrs |
| Hachinohe: 0.8% (standard 1.6%) × 3 fiscal years | Non-uniform taxation | ¥30M | 5.54% | +0.09pt | 17.89 yrs | 0.21 yrs |
| Kamisu: 1.0% × 5 fiscal years | Non-uniform taxation | ¥28.57M | 5.53% | +0.08pt | 17.90 yrs | 0.20 yrs |
Three takeaways stand out. First, non-uniform taxation alone is hard to justify as the deciding factor in site selection. The Kamisu, Hachinohe and Matsue types shorten payback by only 0.20–0.24 years and add +0.08–0.09pt to IRR — a level that disappears if ADR moves by ¥100. Second, capital subsidies and long-term exemptions are large enough to matter in an investment committee discussion. The Shimotsuke type’s +1.03pt and the Iiyama type’s +0.61pt carry an impact comparable to shifting the cap-rate view by 0.05–0.1pt. Third, programs should be ranked by “present value of total support,” not by “cap.” Shimotsuke (cap ¥200 million, +1.03pt) beats Takatsuki (cap ¥100 million, +0.35pt) not only because of the cap difference, but because Shimotsuke layers a capital subsidy on top of an operating subsidy. Support programs are not the only thing that varies by municipality: water and sewer costs differ 2.1x between municipalities, a ¥7.85 million annual gap for 100 rooms, and waste disposal fees differ 2.6x. Ranking sites on the presence of grants alone can see the order flipped by these running-cost differences.
Stress-Testing the Assumptions — ADR Moves the IRR Level, but Barely Moves the Incentive Effect
The IRRs so far rest on a single set of assumptions: ADR of ¥11,000, assumed occupancy of 80% (a model assumption as of September 2026), GOP margin of 50% and an exit cap rate of 5.5%. The first question an investment committee asks is: “If those assumptions miss, does that +1.03pt survive?” So we flexed ADR by ±¥1,500 and occupancy by ±8pt and recalculated, on a 5×5 grid, the base IRR without incentives and the IRR with the largest (Shimotsuke type) and smallest (Kamisu type) programs applied. All other assumptions (construction cost, land cost, GOP margin, cap rate, holding period) were held constant.
Base IRR (no incentives) — ADR × assumed occupancy
| ADR \ Occupancy | 72% | 76% | 80% | 84% | 88% |
|---|---|---|---|---|---|
| ¥9,500 | 3.04% | 3.55% | 4.03% | 4.50% | 4.95% |
| ¥10,250 | 3.76% | 4.27% | 4.76% | 5.23% | 5.69% |
| ¥11,000 | 4.43% | 4.95% | 5.45% | 5.93% | 6.40% |
| ¥11,750 | 5.06% | 5.59% | 6.10% | 6.60% | 7.08% |
| ¥12,500 | 5.67% | 6.21% | 6.73% | 7.23% | 7.72% |
IRR uplift from incentives (pt) — recalculated on the same 25 cells
| ADR \ Occupancy | 72% | 76% | 80% | 84% | 88% |
|---|---|---|---|---|---|
| Shimotsuke type (¥200M new-build subsidy + ¥24.29M operating subsidy × 5 years) | |||||
| ¥9,500 | +0.96pt | +0.97pt | +0.98pt | +1.00pt | +1.01pt |
| ¥11,000 | +1.00pt | +1.01pt | +1.03pt | +1.04pt | +1.06pt |
| ¥12,500 | +1.03pt | +1.05pt | +1.07pt | +1.09pt | +1.11pt |
| Kamisu type (non-uniform taxation at 1.0%, 5 fiscal years = ¥5.71M/yr) | |||||
| ¥9,500 | +0.08pt | +0.08pt | +0.08pt | +0.08pt | +0.08pt |
| ¥11,000 | +0.08pt | +0.08pt | +0.08pt | +0.08pt | +0.08pt |
| ¥12,500 | +0.08pt | +0.08pt | +0.08pt | +0.08pt | +0.08pt |
The result is clear. Base IRR moves 4.68pt, from 3.04% to 7.72%, while the incentive uplift stays within +0.96–1.11pt even for the largest program, and for the smallest it holds at +0.08pt in all 25 cells. The effect of non-uniform taxation is tied to the property-tax amount and is independent of revenue-side assumptions. The Shimotsuke type moves slightly because its operating subsidy is fixed at the property-and-city-planning-tax equivalent, while the relative weight of the ¥200 million capital subsidy changes with the level of base IRR.
This result shapes how this article should be used in two ways. First, the “+0.08–1.03pt” range of incentive effects can be used as-is in practice even if ADR and occupancy views are swapped out. Even if demand assumptions differ between Site A and Site B, the comparison of incentives can be done separately. Second, and conversely, incentives do not rescue the underlying business case. In the case of ADR ¥9,500 and assumed occupancy of 72% (the pessimistic model assumption in Table 8, as of September 2026), base IRR is 3.04%, and even with the full Shimotsuke-type capital subsidy it only reaches 4.00%. Simple payback at the base is 24.50 years, and incentives do not bring it back to the 16-year range.
Positioning across three scenarios
| Scenario | ADR | Assumed occupancy | NOI | NOI yield | Base IRR | Shimotsuke type | Kamisu type | Simple payback (base) |
|---|---|---|---|---|---|---|---|---|
| Pessimistic | ¥9,500 | 72% | ¥104.78M | 4.08% | 3.04% | 4.00% (+0.96pt) | 3.12% (+0.08pt) | 24.50 yrs |
| Base (this article) | ¥11,000 | 80% | ¥141.77M | 5.52% | 5.45% | 6.47% (+1.03pt) | 5.53% (+0.08pt) | 18.11 yrs |
| Optimistic | ¥12,500 | 88% | ¥183.29M | 7.14% | 7.72% | 8.83% (+1.11pt) | 7.81% (+0.08pt) | 14.01 yrs |
We also want to put a number on the earlier statement that the effect “disappears if ADR moves by ¥100.” Under the base assumptions, a ¥100 upside in ADR moves IRR by +0.089pt, and a 1pt upside in occupancy moves it by +0.122pt. The +0.08–0.09pt from non-uniform taxation in the Kamisu, Hachinohe and Matsue types is almost exactly one of those increments. Translated into site-selection practice, the presence or absence of non-uniform taxation carries only the same weight as a view on whether you can capture another ¥100 of ADR. The Shimotsuke type’s +1.03pt, on the other hand, is equivalent to about ¥1,150 of ADR or 8.4pt of occupancy — comparable to swapping out the demand assumptions entirely. Incentives should be treated as “a factor that decides the ranking” only for these capital-subsidy and long-term-exemption types.
Testing a Hypothesis — Do Municipalities with Generous Subsidies Have Lower Rates?
A common hypothesis about attraction incentives is that generous subsidies appear where rates are weak, with local government filling the viability gap. For the municipalities where programs were confirmed, we tested this by comparing the 12-month median estimated settled ADR with the room stock tracked by MetroEngines Research. As a benchmark, we use about ¥9,000, the median estimated settled ADR across the 47 prefectures (July 2026).
| Municipality | Program type | Estimated settled ADR (12-month median) | Latest month (N=properties) | Properties | Rooms |
|---|---|---|---|---|---|
| Takatsuki, Osaka | Grant | ¥10,800 | ¥10,900 (N=7) | 12 | 382 |
| Shimotsuke, Tochigi | Subsidy | ¥3,900 * | ¥3,800 (N=1) | 9 | 172 |
| Minamiawaji, Hyogo | Tax exemption | ¥20,400 | ¥20,700 (N=19) | 122 | 1,488 |
| Iiyama, Nagano | Tax exemption | ¥9,300 | ¥7,300 (N=9) | 178 | 2,732 |
| Ureshino, Saga | Non-uniform taxation | ¥20,200 | ¥18,700 (N=33) | 41 | 1,139 |
| Toba, Mie | Non-uniform taxation | ¥20,200 | ¥17,700 (N=79) | 214 | 4,308 |
| Takachiho, Miyazaki | Non-uniform taxation | ¥16,600 | ¥16,600 (N=13) | 42 | 452 |
| Matsue, Shimane | Non-uniform taxation | ¥12,500 | ¥11,200 (N=55) | 162 | 6,322 |
| Itako, Ibaraki | Non-uniform taxation | ¥9,500 | ¥8,000 (N=7) | 22 | 421 |
| Hachinohe, Aomori | Non-uniform taxation | ¥6,700 | ¥7,100 (N=31) | 73 | 3,634 |
| Kamisu, Ibaraki | Non-uniform taxation | ¥6,100 | ¥7,100 (N=22) | 99 | 3,824 |
| Hiraizumi, Iwate | Non-uniform taxation | ¥5,300 | ¥4,700 (N=5) | 10 | 121 |
As a result, no simple relationship of “the more generous the subsidy, the lower the rate” could be confirmed. Instead, the character splits by program type. Of the eight municipalities with non-uniform taxation under the International Tourism Hotel Improvement Act, five — Ureshino, Toba, Takachiho, Matsue and Itako — are above the national prefecture median of about ¥9,000, meaning rates as hot-spring and tourist destinations are already established. Because the registration system itself has facility standards, the eligible properties likely skew toward the core hotels and ryokan of tourist areas. Minamiawaji, a tax-exemption type, sits at a high ¥20,400 for the same reason; on Awaji Island as a whole, listed lodging supply rose about 1.4x while estimated ADR still increased by 7–11%.
Meanwhile, what the attraction-grant and location-subsidy municipalities of Takatsuki and Shimotsuke have in common is not rates but thin room stock. Takatsuki is a core city with a population in the 340,000s (343,141 as of the end of July 2026), yet has only 12 properties and 382 rooms; Shimotsuke has 9 properties and 172 rooms. This indicates that these programs are designed not to “fill a rate gap” but to “attract the first building into a market where supply has not emerged at all.” Put the other way, narrowing candidate sites by reading grants as compensation for low rates misaligns the program’s intent with the business plan’s assumptions.
The practical implication is this. When building in a tourist area with non-uniform taxation, treat the incentive as “a small bonus on top of an already established rate level.” In contrast, when building in a metropolitan fringe city with attraction grants, treat the incentive as “a mechanism in which the government shoulders part of the initial cost of entering a market with few competitors.” These two occupy completely different positions in a business plan.
Six Points to Check Before Going to the Investment Committee
1. Grants are, in principle, taxable income
Subsidies and grants from local governments are, in principle, included in taxable income for the fiscal year in which they are received. Subsidies used to acquire or improve fixed assets, where it is settled that no repayment is required, may qualify for deferral through the reduction-entry (compression) method under Article 42 of the Corporation Tax Act. However, operating subsidies such as those equivalent to property tax are generally treated as ineligible. On an after-tax comparison, a capital subsidy such as Shimotsuke’s new-build subsidy (10% of acquisition cost) can be more favorable than an operating subsidy of the same amount because of this deferral potential. Always confirm applicability individually with a tax professional.
2. Tax exemptions and grants are on equal footing after tax
A property-tax exemption reduces expenses and a grant increases revenue, but both raise taxable income by the same amount. The intuition that “a tax cut leaves you with more cash” does not hold. The real differences between the two lie in eligibility for the compression method, the time lag until payment, and the administrative burden of applications.
3. Ordinances change quickly
Kyoto City’s program to attract high-quality lodging facilities was established in May 2017, but new applications closed on March 31, 2022, and the policy itself was abolished at the end of FY2025 and folded into the “Kyoto Tourism and MICE Promotion Plan 2030.” The Aichi Prefecture / Nagoya City luxury hotel location subsidy also closed once and reopened on May 1, 2025. This article is based on ordinances and guidelines published as of September 3, 2026. At the final site-comparison stage, you must contact the municipality directly to confirm current requirements and budget availability.
4. Check the ordinance text to see whether the lodging business is eligible
Corporate location promotion tax programs often limit eligible industries to manufacturing. Miyagi Prefecture’s corporate location promotion tax program covers “equipment used for manufacturing businesses”; although it has a well-developed framework — a 3-fiscal-year property-tax exemption for acquisitions of ¥100 million or more — the lodging business is not included (the program runs until March 31, 2028). Do not judge by the program name alone; always check the eligible industries in the text.
5. Check room-count requirements for both the “new portion” and the “total”
For expansions of existing facilities, Takatsuki imposes a dual requirement: at least 25 hotel rooms in the new portion and at least 50 hotel rooms in total. For projects involving conversion or extension, confirm at the design stage that the plan meets the requirement under both counting methods. Shimotsuke also sets time-based requirements: opening within 3 years of land acquisition and continuous operation for at least 10 years after opening.
6. Do not write “none” for programs you could not confirm
The 12 programs in this article are limited to those confirmed in ordinance text or official municipal pages. We additionally researched designated cities and tourist-area municipalities, but a considerable number had no hotel or ryokan attraction incentive that could be confirmed from published materials. This does not mean no program exists. The lodging business may be included in the guidelines for general corporate location subsidies, or handled through individual consultation with the industrial promotion department, so contacting the municipality directly once candidate sites are narrowed down is the most reliable approach in practice.
Summary — Put “Your Own Property and City Planning Taxes × Years” in the Plan, Not “¥100 Million”
As the last variable added to a business plan, municipal attraction incentives are not small. In a 100-room model, total support ranges 11x, from ¥28.57 million to ¥321.43 million; the contribution to IRR spans +0.08pt to +1.03pt, and simple payback shortens by 0.20 to 2.27 years. When comparing two projects with no clear winner on land, this difference is easily enough to change the ranking.
That said, avoid putting the cap straight into the plan. Takatsuki’s ¥100 million annual cap is a ceiling that only begins to bind at roughly 343 to 515 rooms given a holding-tax level of ¥194,000–291,000 per room per year; for 100- or 200-room plans it is effectively irrelevant. What belongs in the plan is your own actual figure: “property tax + city planning tax on the specified fixed assets × 5 fiscal years.” When reading a program, read the calculation basis, not the cap.
With FY2027 budgets being drawn up, more municipalities are expected to move to attract lodging facilities as a response to population decline. As Shimotsuke’s program — established only in July 2025 — shows, new and expanded programs keep appearing. Before entering the final stage of site selection, the extra step of asking candidate municipalities “Do you have a location support program for lodging facilities?” is the most reliable way to capture that last 0.1pt in the business plan.
Related Articles
- Hotel Water & Sewer Costs Vary 2.1x by Municipality: ¥7.85mn NOI Gap
- Hotel Acquisition Costs 7.1%: A 6.5% Gross Yield Becomes 4.65% Net
References and Sources
■ Data Sources
Program contents, requirements and periods were confirmed directly against each municipality’s ordinance text, grant guidelines and official municipal pages (primary sources, accessed September 3, 2026). The number of facilities registered under the International Tourism Hotel Improvement Act is from the Japan Tourism Agency’s “List of Registered Hotels / Registered Ryokan” (as of March 31, 2026). Estimated settled ADR, room stock and property counts are from MetroEngines Research & Consulting’s city-level monthly aggregation (September 2025 – July 2026), with the number of properties covered in each municipality’s latest month shown as N= in the tables. The benchmarks of ¥20.67 million construction cost per room and ¥160,000–240,000 property tax per room per year are taken from values verified in previously published HotelBank articles.
■ Model Assumptions
The model assumes a 100-room, lodging-focused hotel in a regional core city: construction cost ¥2.067 billion + land acquisition ¥500 million = total investment ¥2.567 billion; ADR ¥11,000; assumed occupancy of 80% (model assumption as of September 2026); ancillary revenue at 10% of room revenue; GOP margin 50%; FF&E reserve at 3% of total revenue; and property and city planning taxes of ¥24.29 million/yr, giving NOI of ¥141.77 million (NOI yield 5.52%). IRR is calculated on a 20-year hold, 5.5% exit cap rate and 3% selling costs, with incentives allocated as capital subsidies at opening (year 1) and operating subsidies and tax exemptions over each program’s eligible years. Simple payback is a simplified calculation dividing total investment less total support by NOI. The sensitivity analysis flexes ADR by ±¥1,500 and assumed occupancy by ±8pt, holding all other assumptions constant.
■ Limitations
Because property tax on buildings declines each year through the age-based depreciation adjustment, this estimate — which carries the first-year tax amount through the eligible period — is biased upward. Most non-uniform taxation programs cover buildings only (Matsue and Toba explicitly limit it to buildings), but this estimate applies the reduction rate to total holding taxes, which also leans toward the upper bound. Grants and subsidies are in principle included in taxable income, so the IRRs in this article are pre-tax, and after-tax rankings may change depending on eligibility for the compression method. Ordinances and guidelines are amended frequently, and many programs require designation or certification plus annual applications. The 12 programs in this article are limited to those confirmed in published materials; municipalities where no program was confirmed may still have one. Estimated settled ADR is an estimate derived by applying corrections to published prices on OTAs and similar channels, and differs from each property’s actual settled prices and accounting figures.
■ Market Data
- MetroEngines Research & Consulting — Estimated settled ADR (city-level, monthly), room stock, new opening data
■ Municipal Ordinances and Grant Guidelines (primary sources, accessed September 3, 2026; Japanese)
- Takatsuki City: Hotel and Ryokan Location Promotion Program (Grants)
- Takatsuki City Ordinance on the Attraction of Hotels and Ryokan (Ordinance No. 14 of 2016)
- Shimotsuke City: Initiatives to Attract Lodging Facilities (Hotels) (established July 1, 2025)
- Kyoto Prefecture Grant Guidelines for the Lodging Facility Location Promotion Subsidy (Public Notice No. 656, November 24, 2017)
- Minamiawaji City: Property Tax Exemptions and Non-Uniform Taxation
- Iiyama City: Tax Incentives under the Lodging Facility Utilization Promotion Ordinance
- Takachiho Town: Ordinance on Non-Uniform Property Taxation for Registered Hotels and Ryokan under the International Tourism Hotel Improvement Act (Ordinance No. 3 of 1974)
- Itako City: Ordinance on Non-Uniform Property Taxation for Registered Hotels under the International Tourism Hotel Improvement Act (Ordinance No. 13 of 1963)
- Hiraizumi Town: Ordinance on Non-Uniform Property Taxation for Buildings Used for Registered Ryokan under the International Tourism Hotel Improvement Act (Ordinance No. 1 of 1982)
- Ureshino City: Ordinance on Non-Uniform Property Taxation for Registered Hotels, etc. under the International Tourism Hotel Improvement Act (Ordinance No. 54)
- Matsue City: International Tourism Hotels
- Kamisu City: Non-Uniform Property Taxation for International Tourism Hotels
- Hachinohe City: Non-Uniform Property Taxation for International Tourism Hotels and Ryokan
- Toba City: Non-Uniform Property Taxation for International Tourism Hotels and Ryokan
- Aichi Prefecture Luxury Hotel Location Promotion Subsidy
- Nagoya City: Reopening of Applications for the Luxury Hotel Location Promotion Subsidy
- Kyoto City Program to Attract High-Quality Lodging Facilities (new applications closed March 31, 2022)
- Miyagi Prefecture Corporate Location Promotion Tax Program (covers equipment used for manufacturing businesses)
- Takatsuki City Population (2026)
■ Government Statistics and Public Data
- Japan Tourism Agency: International Tourism Hotel Improvement Act
- Japan Tourism Agency: List of Registered Hotels under the International Tourism Hotel Improvement Act, 924 entries (as of March 31, 2026)
- Japan Tourism Agency: List of Registered Ryokan under the International Tourism Hotel Improvement Act, 1,359 entries (as of March 31, 2026)
- International Tourism Hotel Improvement Act (Act No. 279 of 1949)
- National Tax Agency: Application of the Compression Method to Fixed Assets Acquired with Indirectly Granted National or Local Government Subsidies
- Ministry of Land, Infrastructure, Transport and Tourism: Building Construction Statistics (basis for construction cost per tsubo)
Note on the estimates in this article: The IRRs and payback periods in this article are simplified estimates combining the requirements of published ordinances and guidelines with general business assumptions. Actual investment decisions require a detailed feasibility study and individual confirmation with the municipality concerned and tax professionals. Ordinances and guidelines are amended frequently, and the content here is based on information published as of September 3, 2026. Estimated settled ADR is an estimate derived by applying corrections to prices published on OTAs and similar channels at the time of research, and differs from each property’s actual settled prices and accounting figures.