

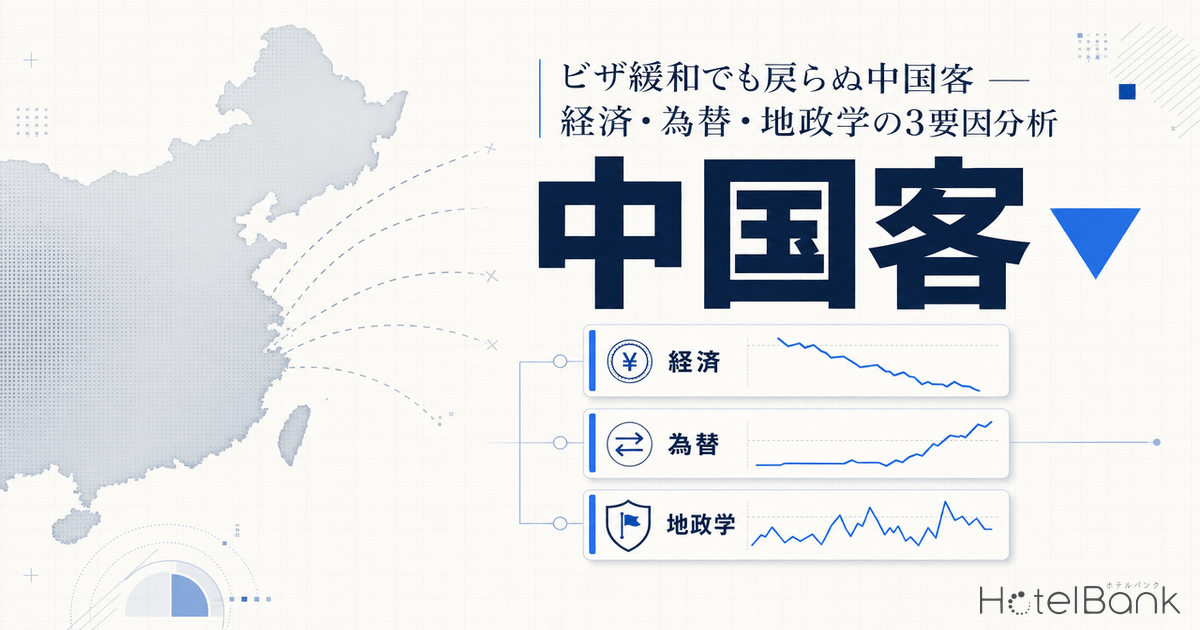
Following Prime Minister Takaichi’s “Taiwan contingency” remarks in November 2025, the Chinese government issued an advisory urging citizens to refrain from traveling to Japan. Forty percent of flights were suspended, and Chinese visitor arrivals plunged roughly 45% YoY in December and a steep 60.7% YoY in January 2026. Meanwhile, Japan’s 30-day visa exemption for Chinese travel remains in place through end of December 2026 — yet despite this surface-level “easing,” the flow of people has not returned. This article decomposes the recovery gap into four structural factors — visa, domestic economy, FX, and geopolitics — and quantitatively examines ADR sensitivity in Hokkaido, Fukuoka, and Okinawa (regions with high Chinese visitor exposure), comparison with Korea/Taiwan dependency risks, and three scenarios for 2026 H2.
Metric Definitions Used in This Article
- ADR (Average Daily Rate): Average of selling prices publicly listed on OTAs and other channels. Differs from actual transaction prices. Per-room rate for double occupancy (tax inclusive), averaged across all plans (room-only through meals-included).
- Data source: MetroEngines Research
Japan-China Visa Regime Map as of April 2026
The first thing to recognize is that the current Japan-China visa system has an asymmetric “one-side eased, one-side maintained” structure. On November 3, 2025, the Chinese government announced an extension of visa exemption for ordinary passport holders from 45 countries including Japan, valid through end of December 2026. The exemption covers stays of up to 30 days for business activity, tourism, family visits, and transit. By contrast, Japan continues to require short-stay visas for Chinese nationals — there is no reciprocal exemption agreement.
In other words, an asymmetry persists at the institutional level: “Japanese can easily travel to China” while “Chinese still need visas to come to Japan.” However, what matters is that Chinese visa policy has, since 2024, generally trended toward easing — including simplification of group tourism visas and expansion of multiple-entry visas. If Chinese visitors are still not returning despite this, then the bottleneck is not the visa regime but rather other structural factors.
Source: Compiled by HotelBank Editorial Team from Ministry of Foreign Affairs, Embassy of Japan in China, JETRO, and JNTO releases
JNTO Monthly Data: The Sharp Drop and Non-Recovery of Chinese Visitors
Lining up JNTO monthly data chronologically, total inbound Chinese visitors in 2025 reached 9,096,300 (+30.3% YoY), approaching an all-time high. Spending totaled ¥2,002.6 billion, accounting for 21.2% of the total — the largest among all countries and regions. However, this full-year positive number masks significant distortions. After PM Takaichi’s remarks in November 2025 and the subsequent travel advisory from the Chinese government, December Chinese visitors fell roughly 45% YoY, and January 2026 collapsed to 385,300 (-60.7% YoY). February recovered slightly to 396,400, but this largely reflects the Lunar New Year (Spring Festival) shifting from late January to mid-February versus the prior year — it cannot be classified as a genuine recovery.
Source: Compiled by HotelBank Editorial Team from Japan National Tourism Organization (JNTO) “Visitor Arrivals Statistics”
What’s noteworthy is that other major Asian markets (Korea and Taiwan) maintained double-digit growth during the same period. This means we can definitively classify this as a “China-specific shock” rather than a “structural change in inbound tourism overall.” From the lead-time perspective (the period from booking to actual travel), group tour cancellations occurred first — concentrated around end of December — and the impact has propagated with a lag to FIT (individual travelers) for the cherry blossom season (March–April). With Chinese carriers significantly reducing flight frequency, even if demand returns, the seat capacity available to absorb it has shrunk. A mechanical return to prior-year levels will likely require several quarters.
Three-Factor Decomposition: (a) China’s Domestic Economy (b) FX & Airfares (c) Geopolitics
The reasons Chinese visitors aren’t returning can be organized into three structural factors.
(a) Stagnation in China’s Domestic Economy: Multiple economic think tanks forecast China’s 2026 real GDP growth at 4.4–4.5%, making a deceleration below 5% nearly certain. Behind this lie the prolonged real estate downturn, post-stimulus consumption fatigue, and persistently high youth unemployment. Overseas travel is an extremely income-elastic good, and a slowdown in disposable income growth directly hits group tours and high-priced resort demand. Indeed, reports indicate that Beijing-based luxury travel agencies have seen “90% drops” in small-group tours, and Chengdu reports “over 70% of bookings expected to cancel” (Yamato Gokoro).
(b) Dual Cost Increase from FX and Airfares: As of March 2026, the CNY/JPY exchange rate stands at approximately 1 yuan = ¥23, more than 10% higher (yen weaker) compared to the early 2024 level of approximately 1 yuan = ¥20. While this superficially looks favorable for Chinese travelers, the actual sense of expenditure is offset by surging airfares. As of January 2026, roughly 40% of Chinese carrier services to Japan had been suspended, and the cheapest Shanghai-Osaka fare jumped fivefold from 100 yuan (about ¥2,200) in November 2025 to over 500 yuan (about ¥11,000). Reduced air seat supply will exert upward pressure on prices even as demand begins to return, delaying the recovery path.
(c) Geopolitical Pressure and Government Advisories: In Diet testimony on November 7, 2025, PM Takaichi stated that “China’s use of military force against Taiwan could constitute a survival-threatening situation for Japan.” China’s Ministry of Foreign Affairs responded with strong protest and the travel advisory. This can be positioned as the third wave of geopolitical shocks — following the 2012 Senkaku Islands issue and the 2023 treated water release — both of which produced major declines in inbound Chinese visitors lasting 1–2 quarters. The current recovery path is likely to follow the same pattern, with structural conditions making short-term rebound difficult absent rapprochement between the two governments.
Source: Compiled by HotelBank Editorial Team from JNTO, Bank of Japan, various media reports, and think tank publications
ADR Sensitivity in High China-Exposure Regions: Hokkaido, Fukuoka, Okinawa
From here, we examine — using MetroEngines Research data — the weight with which the sharp drop in Chinese visitors affects regional ADR. The comparison covers six prefectures with differing demand structures: Tokyo and Kyoto (multinational high-end demand), Osaka (multinational plus Kansai Expo effect), Hokkaido (Chinese + Korean/Taiwanese + Western ski resort demand including Niseko), Fukuoka (overwhelmingly high Korean visitor share), and Okinawa (high Taiwanese + Chinese resort share).
Looking at YoY ADR changes for January–June 2026, Tokyo (+6.4 to +39.0%) and Kyoto (+16.4 to +20.4%) posted double-digit growth reflecting overall inbound strength. By contrast, the three prefectures most directly hit by the Chinese demand shock show clearly suppressed growth rates. Hokkaido maintained double-digits at +7.5 to +17.1%, but growth dropped to the low single digits in some months after the Niseko season ended in March. Fukuoka recorded +0.8 to +6.4% — the lowest among the six prefectures — with February’s +0.8% essentially flat. Okinawa landed at +4.0 to +10.9%, mid-range overall but underwhelming relative to resort expectations.
Source: Compiled by HotelBank Editorial Team from MetroEngines Research
Next, comparing absolute monthly ADR levels, the gap between the six prefectures is in fact widening. April 2026 ADR shows Tokyo at ¥42,600 and Kyoto at ¥50,300, versus Fukuoka ¥29,700, Okinawa ¥27,300, and Hokkaido ¥29,600 — a gap of 1.4 to 1.7 times. This indicates that while overall inbound demand is rising, the benefit accrues disproportionately to “cities with low Chinese exposure that hold a multinational portfolio of Western, Korean/Taiwanese, and domestic luxury demand.”
| Prefecture | April 2026 ADR | YoY | Primary Demand Mix |
|---|---|---|---|
| Tokyo | ¥42,600 | +17.4% | Multinational high-end |
| Kyoto | ¥50,300 | +18.6% | Western + luxury segment |
| Osaka | ¥26,800 | +8.4% | Asia + Kansai Expo |
| Hokkaido | ¥29,600 | +11.2% | Chinese + Korean/Taiwanese + Western |
| Fukuoka | ¥29,700 | +5.2% | Korean (largest) + Taiwanese + Chinese |
| Okinawa | ¥27,300 | +7.0% | Taiwanese + Chinese + Korean |
N=8,000+ properties/month. Source: Compiled by HotelBank Editorial Team from MetroEngines Research
Comparison with Korea/Taiwan Share-Dependency Risk
Ironically, the absence of Chinese visitors highlights other dependency risks. In full-year 2025, Korea (approximately 9.45 million) held the top share of inbound visitors, followed by China (9.096 million, 21.2% share) and Taiwan (6.76 million). China’s share has fallen from 30% in 2019 to 21% in 2025 — structural diversification is underway. However, Korea and Taiwan share the same vulnerability in the sense that they “can change overnight due to a political event.”
Fukuoka is a textbook example: Korean visitors represent the largest volume of foreign overnight stays, followed by Taiwan, China, and Hong Kong — an East Asia-heavy structure. Under this composition, any friction in Japan-Korea relations could trigger a sharp drop similar to the China shock. Okinawa has high Taiwan dependency and bears the geopolitical “Taiwan contingency risk” itself. Hokkaido — centered on the Niseko area — has higher shares of Western and Oceanic visitors and is therefore relatively diversified, though the loss of Chinese luxury repeat skiers (a deep segment drawn by snow quality) still hurts.
Source: Compiled by HotelBank Editorial Team from JTA “Overnight Travel Statistics” and JNTO releases (dependency ratios are illustrative)
As we have argued previously, hotels that depend on a single country or region for more than 30% of revenue are exposed to policy risk across all three layers — geopolitics, FX, and domestic economy. The current China shock has put concrete numbers on that lesson.
Three Scenarios for 2026 H2: May Day Holiday → October National Day → Year-End
Finally, we sketch three scenarios for Chinese visitor recovery in 2026 H2. The decision axes are: (1) timing of withdrawal of the travel advisory, (2) pace of Chinese carrier flight resumption, and (3) degree of recovery in China’s domestic economy.
Scenario A (Optimistic) — Phased Recovery from May Day Holiday (May 1–5): Bilateral dialogue accelerates ahead of schedule, and the travel advisory is effectively lifted by the May Day holiday. Chinese carriers gradually resume service; by National Day (October 1–7), volume recovers to 85–90% of prior-year levels, and by year-end returns to prior-year parity. In this case, ADR YoY in Hokkaido, Okinawa, and Fukuoka returns to roughly +15% in H2, and full-year 2026 inbound Chinese visitors land around 8.5 million.
Scenario B (Mid / Most Likely) — Bottoming at National Day, Gradual Recovery: May Day passes at roughly -50% YoY low levels. Air supply constraints and domestic economic deceleration weigh on summer growth. October National Day marks the bottom, with phased recovery into year-end, but still -20 to -30% YoY at year-end. Annual inbound Chinese visitors land in the 5.5–6.5 million range, roughly -30% versus 2025. Regional ADR continues at a slowed +5 to +10% growth pace through H2.
Scenario C (Pessimistic) — Stalemate Through Year-End, Confirmed Structural Share Decline: Geopolitical tensions become protracted, and Chinese carriers’ reduction of Japan routes becomes entrenched. The Chinese share of inbound Japan declines from 21% to the mid-15% range. Korea, Taiwan, Southeast Asia, and the West/Oceania fill the gap; total inbound headcount is maintained but the per-guest spending mix shifts (group → individual, resort → urban concentration). ADR YoY in Hokkaido, Okinawa, and Fukuoka decelerates to the +0 to +5% range in H2.
Source: Compiled by HotelBank Editorial Team (scenarios are based on assumptions; future projections benchmarked against JNTO published values)
Our view as of late April 2026 is that Scenario B (Mid) carries the highest probability, followed by Scenario C (Pessimistic). The reasons are: no notable progress in dialogue between the two governments has been publicly announced, no concrete schedule for Chinese carrier service resumption has been disclosed, and tangible drivers of recovery in Chinese domestic consumption remain scarce.
Conclusion — Implications for Hotel Operators
The phenomenon of “Chinese visitors not returning despite visa easing” is not driven by the surface-level institutional variable of visas, but rather by the structural variables of (a) stagnation in China’s domestic economy, (b) the dual cost of FX and airfares, and (c) geopolitical tension. The implications for hotel operators boil down to three points.
First, accelerate diversification of demand sources. Properties with Chinese exposure exceeding 30% in particular face an urgent need to strengthen sales toward the West/Oceania, Southeast Asia, and domestic luxury segments. Second, ADR levels are showing downward stickiness even in the absence of Chinese demand, so rushed discounting is to be avoided. A more effective strategy is reclaiming share through diversification of distribution channels (direct booking, wholesale, FIT). Third, for 2026 H2, business plans and cash reserves should be built around Scenario B as the baseline, with Scenario C kept in view. Continuous monitoring of three indicators is recommended: progress in bilateral dialogue, restoration of air services, and Chinese economic indicators.
Note on Forward-Dated ADR: ADR figures in this article reflect average selling prices publicly listed on OTAs at the time of survey, and fluctuate as the check-in date approaches. Prices currently set high may decline through last-minute discounting. Please interpret accordingly.