

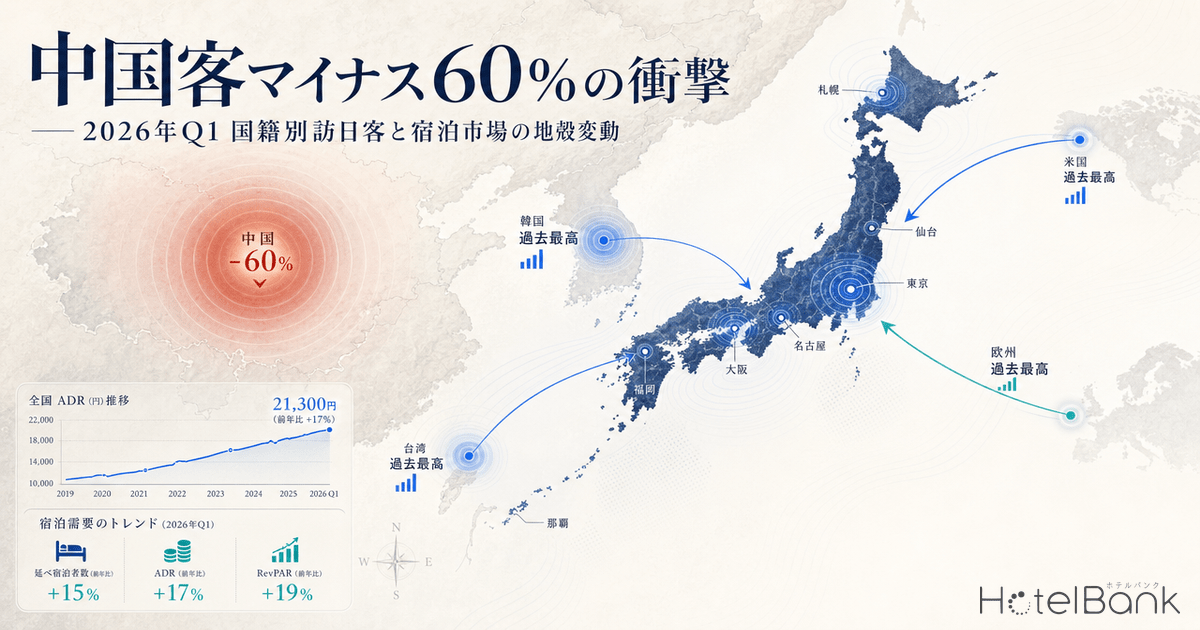

In Q1 2026 (January–March), total inbound visitor arrivals to Japan reached 10,683,500 — surpassing the 10-million mark in the first three months for the second consecutive year. Yet beneath the headline number, the composition has shifted dramatically: arrivals from mainland China have collapsed to roughly half of last year’s level, while South Korea, Taiwan, the United States, and key European markets are setting consecutive monthly records. This article quantitatively unpacks the structural realignment of demand and what it means for regional hotel pricing and Golden Week 2026 demand, drawing on JNTO nationality data, the Japan Tourism Agency’s accommodation statistics, and our own publicly listed price data.
Metric Definitions Used in This Article
- ADR (Average Daily Rate): Mean of publicly listed sale prices on OTAs and similar platforms. May differ from actual transacted prices. Per-room rate (tax included) for two-person occupancy, averaged across all plan types (room-only through dining-included).
- Data source: MetroEngines Research
Scale of the China Drop — Three Consecutive Months of -45% to -60% YoY
According to JNTO’s nationality-level inbound figures for January–March 2026, mainland Chinese arrivals were 385,300 in January (-60.7% YoY), 396,400 in February (-45.2%), and 291,600 in March (-55.9%) — three consecutive months of sharp double-digit decline. The Q1 cumulative total stood at 1,073,500, meaning roughly 1.29 million visitors disappeared compared with the 2.365 million in Q1 2025. The contraction rate was -54.6%, and China’s share of total inbound also pulled back substantially.
JNTO’s monthly press releases cite “the Chinese government’s advisory to avoid travel to Japan” and “reduced flight capacity” as the main drivers. While the Lunar New Year (Spring Festival), which fell in late January last year, shifted to mid-February this year — providing some seasonal explanation — the fact that the advisory and capacity cuts have persisted for three months suggests this should be regarded as a structural slowdown.
Source: Compiled by HotelBank Editorial Team from Japan National Tourism Organization (JNTO) monthly estimates
Compared with the peak, the scale of the decline becomes even starker. In 2024, mainland China hit a recovery peak of 6.981 million arrivals for the full year, with a single-month high of 777,000 in July (the first post-COVID month in which China was the No. 1 source market). However, China’s YoY growth plateaued from H2 2025, falling -45.3% in December, followed by three consecutive months of large declines.
| Month | Mainland China Arrivals | YoY | Key Context |
|---|---|---|---|
| July 2024 | 776,500 | +138.1% | 2024 monthly peak; first post-COVID No. 1 source |
| December 2024 | 571,000 | +82.7% | Recovery momentum maintained |
| December 2025 | 312,400 | -45.3% | Cooling Japan-China relations; flight cuts |
| January 2026 | 385,300 | -60.7% | Chinese government travel advisory |
| February 2026 | 396,400 | -45.2% | Sharp decline despite Spring Festival month |
| March 2026 | 291,600 | -55.9% | No recovery even into cherry-blossom season |
Source: Compiled by HotelBank Editorial Team from Japan National Tourism Organization (JNTO) monthly estimates
In other words, compared with the July 2024 peak, China’s March 2026 arrivals have shrunk by roughly 63% — to about one-third of the peak level. While total inbound is hitting record highs, the largest single source market has contracted rapidly, making Q1 an extraordinarily skewed quarter.
What’s Replacing China — Korea, Taiwan, the U.S., and Europe Setting Records Month After Month
Which markets are filling the gap left by China? Sorting JNTO’s nationality data for the cumulative Q1 2026 (Jan–Mar) by YoY growth, the strength of Korea, Taiwan, the U.S., Australia, and major European countries stands out clearly.
Source: Compiled by HotelBank Editorial Team from Japan National Tourism Organization (JNTO) monthly estimates
Korea posted a record-setting 1,176,000 in January — the first time any single source market exceeded 1.1 million in a single month — and continued double-digit growth through February and March. Q1 cumulative reached 3,058,000 (+22.0% YoY), reinforcing Korea’s standing as Japan’s largest-volume inbound source. Taiwan, supported by sustained popularity of Japan travel and added Taipei–Tokyo flight capacity, hit 2,041,000 in Q1 (+25.7%), setting new monthly records for three consecutive months.
Turning to Europe, the U.S., and Australia: the U.S. was buoyed by both winter sports and cherry-blossom season demand, hitting 803,000 in Q1 (+12.1%) and remaining solidly on its growth path. Most striking are European growth rates — Germany +24.2%, the U.K. +16.7%, France +15.1%, Italy +22.8%, Spain +27.2%, and the Nordic region +32.0%, all in double-digit territory. These reflect a combination of more diverse connecting routes, increased cruise port calls, and rising travel appetite among younger travelers, with JNTO press releases explicitly highlighting these markets as setting “all-time monthly highs” or “all-time March highs.”
| Country / Region | 2026 Q1 | 2025 Q1 | YoY | Notes |
|---|---|---|---|---|
| South Korea | 3,058,100 | 2,506,183 | +22.0% | Single month exceeded 1.1M (January) |
| Taiwan | 2,041,500 | 1,623,663 | +25.7% | 3 consecutive monthly records |
| China (Mainland) | 1,073,500 | 2,365,261 | -54.6% | Travel advisory; capacity cuts |
| United States | 803,400 | 716,802 | +12.1% | Winter sports & cherry-blossom demand |
| Hong Kong | 650,200 | 647,599 | +0.4% | Flat amid slight seat-capacity decline |
| Australia | 344,700 | 313,713 | +9.9% | Snow demand drives growth |
| United Kingdom | 135,300 | 115,926 | +16.7% | All-time March high |
| Germany | 98,700 | 79,444 | +24.2% | All-time March high |
| France | 91,500 | 79,511 | +15.1% | Younger-traveler demand expanding |
| Italy | 55,700 | 45,343 | +22.8% | More cruise port calls |
| Spain | 44,600 | 35,054 | +27.2% | More diverse connecting routes |
Source: Compiled by HotelBank Editorial Team from Japan National Tourism Organization (JNTO) monthly estimates
Importantly, these substitute markets are not merely replacing volume — they have higher per-traveler spend than China. JTA’s consumption surveys show European, U.S., and Australian per-night accommodation spend is clearly higher than China’s, with major European source markets exceeding Chinese spend by 30–50%. As inbound composition shifts from China to Western markets and Australia, a structure is emerging in which volume declines do not necessarily translate into accommodation revenue declines.
Which Areas Were Most China-Dependent — Prefectural Composition Based on JTA’s 2024 Final Figures
The impact of the China decline differs sharply by region. According to the JTA’s “Overnight Travel Statistics” (2024 final figures), mainland China accounted for roughly 25.19 million overnight stays nationwide (18.2% of all foreign overnights), with concentration particularly heavy in the Kinki (Kansai) region. Prefectural data published by the Kinki District Transport Bureau shows China’s share of foreign overnight stays at 31.9% in Nara, 25.6% in Hyogo, 25.9% in Wakayama, 25.3% in Osaka, and 19.3% in Kyoto — high levels concentrated in Kansai.
Source: Compiled by HotelBank Editorial Team from JTA “Overnight Travel Statistics” 2024 final figures (Kinki District Transport Bureau)
Conversely, prefectures with high European and U.S. share are Kyoto (U.S. 14.4%, Europe combined 13.6%) and Hyogo (Europe combined 10.0%), reflecting cherry-blossom, heritage, and Kansai International Airport-routed circuit demand. Hokkaido has long been known for high Australian, U.S., and Taiwanese share during the snow season; in 2024 overnight statistics, Australia recorded its largest national footprint there.
The implication is that the impact of China’s decline is asymmetric across regions. Major cities like Osaka and Kyoto have a deep substitute-demand mix from Western markets, Australia, Taiwan, and Korea, so the China hit is relatively cushioned. By contrast, in regions where China made up roughly 30% of inbound — such as Nara and Wakayama — total demand could visibly contract if substitute demand isn’t successfully captured.
ADR Continues to Climb — YoY Trends in 6 Major Cities
Per our publicly listed price data (OTA-based), ADR in the six major cities continued to rise year-on-year through Q1 2026 despite the China collapse. As of March 2026, YoY growth was +18.6% in Kyoto, +11.1% in Tokyo, +9.5% in Osaka, +8.5% in Okinawa, +7.5% in Hokkaido, and +2.7% in Fukuoka — all positive. The fact that Kyoto and Osaka, where China’s share had been highest, are still posting double-digit ADR gains demonstrates that demand substitution is being realized in pricing as well.
Source: Compiled by MetroEngines Research and HotelBank Editorial Team from publicly listed price data (OTA, etc.). N = research-target hotels in the 6 major cities (as of March 2026)
Behind Kyoto’s outsized growth lies not only the higher rate tolerance of Western and Australian guests, but also constrained room supply. Driven in part by stricter regulation of new hotel development inside Kyoto City, our research-target hotel count fell from 1,683 in March 2024 to 1,550 in March 2026 — a roughly 8% decline. Demand is effectively maintained through the inbound mix shift, while supply has slightly contracted — a configuration that pushes ADR higher.
| Area | Mar 2024 ADR | Mar 2025 ADR | Mar 2026 ADR | 2025→2026 YoY | China share (2024) |
|---|---|---|---|---|---|
| Kyoto | ¥38,900 | ¥39,200 | ¥46,500 | +18.6% | 19.3% |
| Tokyo | ¥32,000 | ¥33,100 | ¥36,800 | +11.1% | (Reference: nat’l 18.2%) |
| Osaka | ¥21,700 | ¥22,700 | ¥24,900 | +9.5% | 25.3% |
| Okinawa | ¥23,200 | ¥24,800 | ¥26,900 | +8.5% | — |
| Hokkaido | ¥30,000 | ¥27,600 | ¥29,700 | +7.5% | — (high AU / TW share) |
| Fukuoka | ¥26,100 | ¥28,500 | ¥29,300 | +2.7% | — (high Korea share) |
Source: Compiled by MetroEngines Research and HotelBank Editorial Team from publicly listed price data (OTA, etc.). Prices are per-room rates (tax included) for two-person occupancy
Osaka’s ADR is also holding a +9.5% YoY gain. The fact that Osaka has held up despite a 25.3% China share — higher than Kyoto’s — is because, after the April–October 2025 Expo demand peak ran its course, continued Korean and Taiwanese demand is providing a floor. Meanwhile, the research-target hotel count in Osaka fell modestly from 924 in March 2024 to 872 in March 2026, suggesting that smaller operators may be exiting the market as the demand structure shifts.
Hokkaido moved from a slightly negative YoY ADR in Q1 2025 to a rebound in Q1 2026. This was supported by inbound snow-season demand — particularly the strength of Australia (Q1 +9.9%) and Taiwan (+25.7%). Hokkaido has historically had a high Australian share in the 2024 overnight statistics, making it a prime example of a region with limited direct exposure to the China decline.
Note on data switching: This article uses both OTA publicly listed prices (sale-price basis) and REIT monthly operating data (transacted-price basis). The two have a structural level gap, so please focus on YoY change rates rather than direct absolute-value comparisons.
REIT Data Confirms the Premium — Rate Gains Visible at JHR and Hoshino Resorts REIT
Drilling down into individual properties, hotel REIT disclosures also corroborate the qualitative shift in demand. Japan Hotel REIT (8985) reported portfolio-wide ADR +3.1%, occupancy +2.4 ppt, and RevPAR +6.1% in February 2026 operating results — both volume and rate improving. JHR holds top-tier properties in Kansai including Hyatt Regency Osaka and Kobe Meriken Park Oriental Hotel, showing that even in regions where the China decline was sharpest, capturing Western and Australian demand has lifted RevPAR.
Hoshino Resorts REIT (3287), centered on regional resorts, also posted ADR +8.6%, occupancy +1.9 ppt, and RevPAR +10.5% in February 2026 — double-digit growth. Snow and resort properties such as Niseko, Karuizawa, and the Hoshinoya brand absorbed strong demand from Australian, U.S., and Taiwanese guests. Invincible Investment Corporation (8963), with a high business-hotel mix, posted ADR +0.9% — a more modest gain — but occupancy +2.0 ppt indicates that supply-demand remains firm.
On the other hand, Japan Hotel & Residential Investment (3472) shows ADR -12.1% and RevPAR -11.9%, which appears to be a major decline at first glance. This is primarily due to temporary dilution from rebranding and renovations of certain properties starting in 2025, and does not reflect market contraction. Differences in portfolio composition can lead to meaningful differences in how each REIT appears.
* The seven REITs referenced for monthly operating data are: Ichigo Hotel REIT (3463), Invincible Investment Corporation (8963), Japan Hotel & Residential Investment (3472), Japan Hotel REIT (8985), Hoshino Resorts REIT (3287), Mori Trust Hotel REIT (8961), and Kasumigaseki Hotel REIT (401A).
Golden Week 2026 Outlook — Double-Digit YoY Gains in Major Cities Despite China’s Absence
For the May 2026 Golden Week period, our publicly listed price data shows Kyoto +20.4%, Tokyo +14.2%, Hokkaido +13.1%, Osaka +12.5%, Okinawa +10.9%, and Fukuoka +6.4% — all major cities solidly higher YoY. Even with China essentially absent, GW demand has not weakened: tourism, post-snow-season demand, and extended cherry-blossom demand from Western markets, Australia, Korea, and Taiwan are pushing prices higher.
Source: Compiled by MetroEngines Research and HotelBank Editorial Team from publicly listed price data (OTA, etc.) — sale prices as of April 2026
Kyoto’s +20.4% is the largest gain among the six cities, reflecting both a high Western-guest share and the supply contraction. By contrast, Fukuoka’s +6.4% is more restrained — Korea’s extremely high share in Fukuoka means that while Korean demand growth (Q1 +22.0%) is supporting volume, Korean guests’ relatively higher price sensitivity is naturally putting a brake on rate increases.
In short, behind the headline of “China -60%” lies a far more complex demand structure — one in which the accommodation market overall is actually benefiting on the rate side. For GW operating decisions, three points stand out. First, redesign target-customer language and booking pathways on the assumption that the dominant source markets in each region have shifted. Second, in regions where the China share exceeded 25% — Osaka, Nara, Wakayama — repackage plans previously tailored to Chinese guests, while assessing the right substitute-demand mix. Third, while ADR gains do reflect a tighter supply-demand balance, moving too fast risks driving away U.S. and European bookings — making price-elasticity-aware dynamic pricing more important than ever.
Summary
Q1 2026 was an extraordinarily skewed quarter: total inbound continued setting records, while mainland Chinese arrivals halved YoY (-54.6%). Filling the gap were higher-spending Western, Australian, and short-haul Asian markets — Korea (+22.0%), Taiwan (+25.7%), the U.S. (+12.1%), Germany (+24.2%), the U.K. (+16.7%), Spain (+27.2%) — and as a result, ADR in Kyoto (+18.6%), Tokyo (+11.1%), and Osaka (+9.5%) continued to rise.
For Golden Week 2026, double-digit YoY gains are confirmed across all major cities except Fukuoka, with the qualitative shift in demand starting to show up in pricing. Rather than viewing the China decline only as “market contraction,” the question of how to adapt operating strategy to the changing source-market composition will be the key competitive issue in H2 2026. Going forward, it will be necessary to continuously monitor price elasticity through GW results and into the June–summer period, the recovery scenario for Chinese arrivals from autumn onward, and the upper bound of pricing tolerance among Western markets.
Note on forward-dated ADR: The ADR figures in this article are averages of sale prices publicly listed on OTAs at the time of research and will fluctuate as check-in dates approach. Be aware that prices currently set high may be cut just before stay dates.