

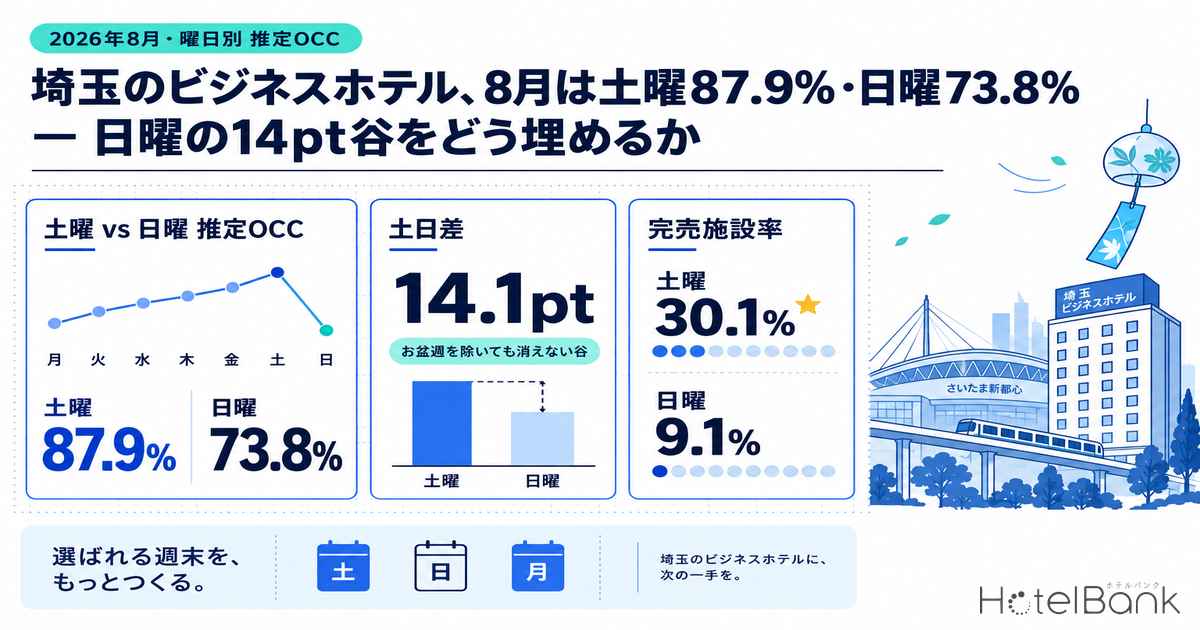
Breaking August 2026 down by day of week for business hotels in Saitama, estimated OCC averaged 82.7% for the month, while Saturday ran 87.9% and Sunday 73.8%. The gap is 14.1 points, and unsold listed inventory on a Sunday night swelled to roughly 2.2 times the Saturday figure (about 1,500 rooms on average versus about 692). Looking only at the monthly average, August reads as a month running above 80%; in practice, one day every week reliably fails to fill. This article breaks the daily August data down along two axes — day of week and calendar week — checks whether the same shape reappears in the forward booking curve for October 2026, and then sets out the practical revenue moves available against the Sunday trough.
Scope: Saitama Prefecture, business hotels, N=57-59 properties (varies by stay date; 5,653-5,740 rooms, based on inventory listed on major booking sites). The price metric in this article is the settled ADR estimate (the transaction price level estimated from OTA and other sales data, tax-excluded equivalent); occupancy is an estimate based on OTA-listed inventory. Both definitions appear at the end of the article. Data as of September 19, 2026.
- — 14.1 points day-of-week gap — Saitama business hotels in August 2026 ran 87.9% on Saturday and 73.8% on Sunday. The 82.7% monthly average is only that swing averaged out.
- — It is not an Obon effect — Excluding Obon week (August 10-16), the Saturday-Sunday gap widens to 14.7 points across the remaining 24 days. The Sunday trough repeats as a weekly structure.
- — The outcome is set 45 days out — In the forward curve for October 2026, the Saturday-Sunday gap stands at 10.7 points 45 days before the stay date. Pickup through to 30 days out barely differs by day of week, and the gap edged up to 11.5 points.
- — The sell-out rate differs more than threefold — 30.1% on Saturday against 9.1% on Sunday. Listed unsold rooms on a Sunday average about 1,500 per night, roughly 2.2 times the Saturday figure (about 692).
- — About 2,545 rooms a month — the arithmetic conversion if Sunday were lifted to the monthly average. That said, the settled ADR estimate is down 3.9% year on year, so a discount-led assumption is hard to justify.
Estimated OCC by Day of Week in August — Sat 87.9%, Sun 73.8%, a 14.1pt Gap
Estimated OCC (based on OTA-listed inventory) for Saitama business hotels across the 31 days of August 2026 averaged 82.7% for the month. Every observation is the cross-section immediately before the stay date (lead time of one day), and observation coverage was 100% across all 31 days. Averaged by day of week, the ranking runs Sat 87.9% > Thu 85.5% > Wed 85.2% > Tue 84.5% > Fri 83.6% > Mon 79.8% > Sun 73.8%.
What stands out is that this distribution does not match the common picture of strong weekends and weak weekdays. At Saitama business hotels, the 21 weekdays averaged 83.5%, above the monthly average, and the only weak day of the weekend is Sunday. Weekday occupancy driven by business demand forms the base, Saturday adds leisure and event demand on top, and Sunday alone falls outside both — that structure shows up in the numbers. For the shape of the week in the same market aligned on a single cross-section 39 days before the stay date, see Saitama Business Hotels: Sat 77.2% vs Sun 70.1%, Gap Widens to 11pt.
Layering on the sell-out rate (the estimated share of properties whose listed inventory can no longer be found on OTAs and similar channels) sharpens the contrast further. Against a monthly average of 16.5%, Saturday ran 30.1% and Sunday only 9.1%. On Saturday one property in three sells out its allotment, while on Sunday fewer than one in ten does. The single highest day in the month was Saturday August 8 at 95.1% with a 52.8% sell-out rate; the lowest was Sunday August 16 at 66.2% with 7.0% — a swing of nearly 29 points inside one month.
Source: MetroEngines Research and the HotelBank Editorial Team
| Day of week | Days covered | Estimated OCC | Estimated OCC excl. Obon week | Sell-out rate (est.) |
|---|---|---|---|---|
| Monday | 5 | 79.8% | 79.3% | 12.0% |
| Tuesday | 4 | 84.5% | 86.1% | 16.9% |
| Wednesday | 4 | 85.2% | 87.3% | 19.4% |
| Thursday | 4 | 85.5% | 86.7% | 15.8% |
| Friday | 4 | 83.6% | 83.4% | 11.9% |
| Saturday | 5 | 87.9% | 90.3% | 30.1% |
| Sunday | 5 | 73.8% | 75.7% | 9.1% |
| Monthly average | 31 | 82.7% | 83.8% | 16.5% |
Scope: Saitama business hotels, N=57-59 properties, August 2026. Source: MetroEngines Research and the HotelBank Editorial Team
Obon Week Pulled the Monthly Average Down — August by Calendar Week
August 2026 includes Obon week (August 10-16). Against the 82.7% monthly average that includes that week, the 24 days excluding Obon week averaged 83.8%, 1.1 points higher. Lined up week by week, only Obon week is clearly depressed.
| Week (Monday start) | Estimated OCC | Sell-out rate (est.) | Lowest day that week |
|---|---|---|---|
| 8/3-8/9 | 84.7% | 20.4% | Mon 8/3, 79.2% |
| 8/10-8/16 (Obon week) | 78.7% | 13.4% | Sun 8/16, 66.2% |
| 8/17-8/23 | 82.9% | 13.5% | Sun 8/23, 75.5% |
| 8/24-8/30 | 85.3% | 19.2% | Sun 8/30, 68.6% |
Scope: Saitama business hotels, N=57-59 properties, August 2026. Source: MetroEngines Research and the HotelBank Editorial Team
Obon week’s 78.7% sits 4.2 to 6.6 points below the other three weeks (84.7% / 82.9% / 85.3%). In an area where business demand is the mainstay, Obon is the week when corporate travel stops, and with the weekday base removed the weekly average falls. Indeed, weekdays in Obon week ran 79.6% on Tuesday and 78.8% on Wednesday, 6.5 to 8.5 points below the same weekdays outside Obon week (Tuesday 86.1%, Wednesday 87.3%). Friday (8/14), by contrast, was the strongest day of Obon week at 84.1%, suggesting the peak of homecoming and leisure travel sat in the back half of the week.
What matters is that excluding Obon week does not remove the Sunday trough — it deepens it. Outside Obon week, Saturday runs 90.3% and Sunday 75.7%, a gap of 14.7 points, slightly wider than the 14.1 points for the month as a whole. The Sunday drop is therefore not a specific holiday effect but a weekly structure embedded in the Saitama business hotel market. Managed on monthly or weekly averages, that structural trough is flattened out of view. The same pattern appears in business hotels in other prefectures: in Aichi, the gap between Sunday and Thursday runs to 14.5 points, almost exactly the width seen in Saitama.
The October Forward Curve — The Weekend Gap Is Already Open 45 Days Out
Does the shape seen in the August results reappear in a month still being sold? For the 14 stay nights from October 12 to 25, 2026, we checked the booking curve from 45 days before the stay date up to the most recent cross-section (scope: N=63 properties, 6,036 rooms, based on inventory listed on major booking sites).
Day-of-week averages at the 45-days-out cross-section run Sat 64.5% > Fri 58.6% > Sun 52.2% > Wed 52.1% > Thu 51.8% > Tue 49.8% > Mon 48.1%. Saturday leads by a clear margin, and Monday and Tuesday sit furthest back — a ranking consistent with the August results. Note that October 12 in the covered period is a public holiday falling on a Monday; its 45-days-out figure of 47.3% was close to the following week’s ordinary Monday (October 19, 49.0%).
To look at the shape of the curve more closely, the chart below lines up three stay dates — Saturday October 17, Wednesday October 14 and Sunday October 18 — from 45 days out to 30 days out. At 45 days out, Saturday is 60.1%, Wednesday 51.3% and Sunday 49.4%: the Saturday-Sunday gap is already 10.7 points wide. Pickup over the following 15 days was almost identical — Saturday +8.5pt (68.6%), Wednesday +8.8pt (60.1%), Sunday +7.7pt (57.1%) — and the weekend gap at 30 days out had in fact edged up to 11.5 points.
That the pickup pace barely varies by day of week is a significant practical point. The Sunday trough is not something that fills naturally through the final 15 days of pickup; it is largely decided by how much base has been built by 45 days out. Sunday measures therefore need to be designed as a question of timing rather than last-minute dumping. Sell-out rates say the same: Saturday October 17 reached 7.9% at the most recent cross-section and the following Saturday, October 24, reached 19.0%, while Sunday October 18 stood at 3.2% and Sunday October 25 at 1.6% — very few properties sell out their Sunday allotment at any point in the lead-up.
Scope: Saitama business hotels, N=63 properties, 6,036 rooms. Based on observations from 45 days before the stay date up to the most recent cross-section. Source: MetroEngines Research and the HotelBank Editorial Team
| Stay date | Day of week | 45 days out | 40 days out | 35 days out | 30 days out | 45 to 30 days out |
|---|---|---|---|---|---|---|
| October 12, 2026 | Monday | 47.3% | 48.9% | 50.9% | 53.3% | +6.0pt |
| October 13, 2026 | Tuesday | 47.6% | 50.0% | 52.2% | 54.1% | +6.5pt |
| October 14, 2026 | Wednesday | 51.3% | 54.5% | 56.9% | 60.1% | +8.8pt |
| October 15, 2026 | Thursday | 52.1% | 55.4% | 60.2% | 62.5% | +10.4pt |
| October 16, 2026 | Friday | 57.8% | 59.9% | 63.7% | 67.2% | +9.4pt |
| October 17, 2026 | Saturday | 60.1% | 62.6% | 65.7% | 68.6% | +8.5pt |
| October 18, 2026 | Sunday | 49.4% | 51.8% | 54.4% | 57.1% | +7.7pt |
Scope: Saitama business hotels, N=63 properties, 6,036 rooms. Source: MetroEngines Research and the HotelBank Editorial Team
Seen along these two axes, the ranking at 45 days out (Sat 60.1% > Fri 57.8% > Thu 52.1% > Wed 51.3% > Sun 49.4% > Tue 47.6% > Mon 47.3%) largely holds at 30 days out. Pickup from 45 to 30 days out falls within a range of +6.0pt (Monday) to +10.4pt (Thursday), and no cross-section shows Sunday gaining unusually. The weekend gap in fact edged up from 10.7 points at 45 days out to 11.5 points at 30 days out. Note that October 12, 2026 is a public holiday falling on a Monday, so as a representative Monday it differs in character from an ordinary one.
Monthly Settled ADR Estimate Is Down 3.9% Year on Year — The Backdrop for Any Fix
Before considering how to fill the day-of-week trough, it is worth fixing the market’s price level on a monthly basis. The settled ADR estimate (confirmed months) for Saitama business hotels was ¥7,600 in August 2026 (N=147 properties). The same month a year earlier, August 2025, was ¥7,900 (N=148 properties), putting the year-on-year change between confirmed months at −3.9%. August 2024 was ¥7,500 (N=147 properties), so the level has returned to slightly above where it stood two years ago.
Overlaying the monthly shape by year, the settled ADR estimate for Saitama business hotels traces a similar seasonal profile in all three years: high from March to May, falling in June and July, recovering in August and rising again in November and December. In 2026, January reached ¥7,800 — the highest January of the three years — while June came in at ¥7,400, below the same month a year earlier (¥7,500). This is not a market rising in a straight line through the year; the balance against the prior year flips from month to month, which is worth bearing in mind when building a pricing calendar.
Settled ADR estimate (tax-excluded equivalent), confirmed months only. Scope: Saitama business hotels, N=143-150 properties. Source: MetroEngines Research and the HotelBank Editorial Team
What Filling the Sunday Trough Is Worth — Three Levels of Arithmetic
Turning the sense that Sunday is weak into an investment decision requires converting the depth of the trough into rooms. August 2026 had five Sundays, carrying 28,594 room-nights in total. The table below sets out the rooms that would move if estimated OCC of 73.8% were lifted to other day-of-week levels, at three target levels.
| Level | Target | Sunday estimated OCC | Gap vs current (73.8%) | Monthly rooms | Per Sunday |
|---|---|---|---|---|---|
| Conservative | Same as Monday | 79.8% | +6.0pt | About 1,716 rooms | About 343 rooms |
| Mid | Same as the monthly average | 82.7% | +8.9pt | About 2,545 rooms | About 509 rooms |
| Upside | Same as the 21-weekday average | 83.5% | +9.7pt | About 2,774 rooms | About 555 rooms |
Source: MetroEngines Research and the HotelBank Editorial Team
At the mid level — lifting Sunday to the monthly average of 82.7% — that is about 2,545 rooms a month. Multiplied simply by the market settled ADR estimate (about ¥7,600, August 2026, confirmed), it comes to a scale approaching ¥20 million a month across the area. That figure, however, is an arithmetic conversion of an observed occupancy gap into rooms, not a forecast. Whether that demand actually exists on Sunday, and whether it can be captured while holding rate, are separate judgements; given a price environment down 3.9% year on year, moving occupancy alone through discounting does not necessarily raise revenue. At the property level, the work is to decide first which of these three levels is a realistic target, and only then translate it into groundwork placed earlier than 45 days out.
For Revenue Managers Running Business Hotels in Saitama — Implications and an Action Plan
1. Move the unit of management from the month to the day of week. The 82.7% monthly average is nothing more than the mean of Saturday’s 87.9% and Sunday’s 73.8%. If your own reporting only looks monthly and weekly, start by recutting the last three months by day of week. Where your ranking diverges from the market’s (Sat > Thu, Wed, Tue > Fri > Mon > Sun), that divergence is itself the entry point for action. Friday at 83.6%, below Tuesday through Thursday, is particularly worth checking: it is a prompt to review whether Friday is being managed inside a single weekend-price bucket. For how to read a Friday that sinks between the weekdays and Saturday, Hyogo business hotels — Thursday 90.8%, Friday 85.0% — offer a useful comparison.
2. The Sunday trough is structural, not seasonal. Excluding Obon week, the weekend gap is 14.7 points — wider, not narrower. Unsold Sunday rooms average about 1,500 against about 692 on Saturday, more than double. Rather than attributing it to one-off factors such as Obon or the summer lull, build inventory and pricing on the assumption of a weekly trough that persists year-round.
3. The outcome is decided by 45 days out. In the October forward curve, the weekend gap stands at 10.7 points 45 days out, and pickup from there to 30 days out was near-identical at +8.5pt for Saturday and +7.7pt for Sunday. Since the gap does not close in the final 15 days, measures to lift Sunday belong earlier than 45 days out. Put the other way: if your own Sunday sits well below the market’s 52.2% (the October day-of-week average) at the 45-days-out cross-section, that is the earliest warning signal available.
4. There is room to fill it through length of stay. Saturday at 87.9% against Sunday at 73.8% means guests staying Saturday are not extending into Sunday. Monday at 79.8% is also the weakest of the weekdays, so Sunday and Monday are weak back to back. Rather than discounting Sunday in isolation, connecting demand from two directions — a Saturday extension, and a Sunday-in pre-stay ahead of Monday business travel — fits the market structure better.
| Time frame | Move | Decision trigger (figures in this article) | Purpose |
|---|---|---|---|
| Today to this week | Recut your last three months of results by day of week and line them up against the market ranking | If your own weekend gap is wider than the market’s 14.1pt | Quantify the depth of the trough |
| Today to this week | Separate Sunday inventory allocation and floor settings onto a calendar distinct from Saturday and Monday | If Sunday and Saturday are run under the same weekend rule | Create the ability to act at the day-of-week level |
| Within two weeks | Build the Saturday-to-Sunday extension and the Sunday-in / Monday-out pre-stay as separate products | If Sunday at 73.8% and Monday at 79.8% both sit below the 82.7% monthly average back to back | Fill through length of stay rather than standalone discounting |
| Within two weeks | Re-examine how Friday is handled and check it is not priced as aggressively as Saturday | The market’s Friday is 83.6%, below Tuesday to Thursday (84.5-85.5%) | Reduce leakage from managing the weekend as a single bucket |
| Looking to next month | Add the 45-days-out cross-section to your standing monitoring set and track Sunday separately | If your own Sunday at 45 days out stays below the market’s 52.2% | Detect early a trough that cannot be filled at the last minute |
| Looking to next month | Compare your monthly average rate against the market settled ADR estimate and redesign the day-of-week price range | If your own setting stays below the market’s roughly ¥7,600 (August 2026, confirmed) | Clarify the budget and the ceiling for filling the trough |
Source: MetroEngines Research and the HotelBank Editorial Team
Summary — Three Yardsticks
Reading the Saitama business hotel market along the day-of-week axis, three yardsticks are worth reusing.
1. The gap between the monthly average and the weakest day of the week. In August 2026 the monthly average was 82.7% against Sunday’s 73.8%, a gap of 8.9 points. The wider that gap, the more opportunity loss is hidden from monthly management. Tracking this single metric each month is enough to follow how the depth of the trough moves.
2. The day-of-week ranking at the 45-days-out cross-section. In the October forward curve, the ranking was already settled at 45 days out, with Saturday at 64.5% and Sunday at 52.2%. Because pickup barely differs by day of week, the ranking at 45 days out tends to become the ranking on arrival. That makes it straightforward to evaluate groundwork at 45 days out and confine the final stretch to fine-tuning.
3. The day-of-week spread in the sell-out rate. Saturday 30.1% against Sunday 9.1%. Days with a high sell-out rate are days the whole market moves toward selling out; days with a low rate are days inventory stays on the shelf to the end. If your property sells out on Sunday earlier than others, there is room to revisit price; if it is still holding rooms to the end, there is room to work on product design.
Whether the month includes the special factor of Obon week or excludes it, the Sunday trough held steady in the 14-point range. That reproducibility is the reason to invest in day-of-week management.
Frequently Asked Questions
Is estimated OCC the same thing as actual room occupancy?
No. The estimated OCC in this article is derived from how listed inventory on OTAs and similar channels is taken up, and because rooms that are not listed are counted on the sold side, it reads higher than actual room occupancy. When comparing with your own results, we recommend using it for differences and rankings between days of the week rather than for the level itself.
Are the August 2026 figures distorted by Obon?
We also aggregated the 24 days excluding Obon week (August 10-16). The monthly average rises from 82.7% to 83.8%, but Saturday at 90.3% and Sunday at 75.7% widen the gap to 14.7 points. The Sunday trough cannot be explained by Obon.
Why is no year-on-year comparison of occupancy shown?
Estimated OCC is an estimate based on listed inventory, and because the composition of covered properties and their listing status change from year to year, a year-on-year comparison from the same source is not stable as a metric. Year-on-year change is shown using the settled ADR estimate between confirmed months.
Is data from earlier than 45 days out unavailable?
Observations more than 45 days before the stay date can include the state before selling allotments have been loaded, so they may not represent booking progress. This article uses only observations from 45 days out up to the most recent cross-section.
How many rooms move if Sunday is lifted to the monthly average?
The five Sundays in August 2026 carried 28,594 room-nights in total. Lifting estimated OCC from 73.8% to the monthly average of 82.7% (+8.9 points) corresponds arithmetically to about 2,545 rooms a month, or about 509 rooms a day. Lifting it to Monday’s 79.8% would be about 1,716 rooms. This converts an observed occupancy gap into rooms; whether that demand actually exists, and whether it can be captured while holding price, are separate judgements.
About the Data in This Article
• Definition of estimated OCC (OTA-listed inventory basis): OTA-listed-inventory occupancy = 100 – 100 × OTA-listed unsold rooms ÷ total rooms. Coverage is a fixed cohort of properties listing at least 30% of their total rooms on OTAs (the same property set for each stay date; the number of covered properties is shown with each aggregation in this article). It is an estimate based on the take-up of inventory sold on OTAs and differs in definition from actual room occupancy (it reads higher because rooms that are not listed are counted on the sold side).
• Booking curve: Based on observations from 45 days before the stay date up to the most recent cross-section.
• Definition of the settled ADR estimate: The transaction price level (tax-excluded equivalent) estimated from OTA and other sales data (lowest-plan level × segment coefficient, ensembled across multiple channels). Past months are confirmed values; the current and future months are estimates based on sales conditions at this point. Median error against published operating results is 6.6%. This article uses confirmed months only.
• Breakdown of covered N: The day-of-week and weekly aggregations for August 2026 cover Saitama business hotels, N=57-59 properties (varies by stay date; 5,653-5,740 rooms), with 100% observation coverage across all 31 days, every observation taken at the cross-section immediately before the stay date. The October 2026 booking curve covers N=63 properties, 6,036 rooms. The settled ADR estimate covers N=143-150 properties (varies by month). Sell-out rate is an estimate of the share of properties whose listed inventory cannot be found on OTAs and similar channels.
• Data as of September 19, 2026. Sales conditions and inventory change daily, so the figures in this article are a snapshot as at the time of retrieval.
References and Sources
■ Data sources
The estimated OCC, sell-out rate and listed unsold rooms in this article are aggregated for Saitama Prefecture business hotels from listed-inventory data we collect continuously from major booking sites. August 2026 covers N=57-59 properties (varies by stay date; 5,653-5,740 rooms); the October 2026 forward curve covers N=63 properties, 6,036 rooms. The settled ADR estimate is the transaction price level estimated from the same data, N=143-150 properties (varies by month). Prepared by MetroEngines Research and the HotelBank Editorial Team. Data as of September 19, 2026.
■ Calculation assumptions
Day-of-week and weekly values are simple averages of the applicable stay dates. Obon week is defined as August 10-16. All August observations are the cross-section immediately before the stay date (lead time of one day), with 100% observation coverage across all 31 days. The booking curve uses only observations from 45 days before the stay date up to the most recent cross-section; cross-sections earlier than 45 days are excluded because they can include the state before selling allotments have been loaded. The day-of-week × lead-time table is limited to the seven stay dates observed at every cross-section from 45 to 30 days out (October 12-18, 2026, one date per day of week). The Sunday effect range is the arithmetic conversion of the occupancy gap applied to the 28,594 total room-nights across the five Sundays in August 2026.
■ Limitations and notes
Estimated OCC is an estimate based on listed inventory and reads higher than actual room occupancy because rooms that are not listed are counted on the sold side. It is intended for comparing differences and rankings between days of the week rather than the level itself. The number of covered days per day of week is small, at four to five, so single-month values are affected by swings on individual dates. October 12, 2026 is a public holiday falling on a Monday and differs in character from an ordinary Monday as a representative value. The Sunday effect range is an arithmetic conversion of an observed occupancy gap into rooms, not a forecast; whether that demand exists, and whether it can be captured while holding rate, require separate judgement. A year-on-year comparison of estimated OCC is not stable as a metric because the composition of covered properties and their listing status change from year to year, and it is not used in this article.