

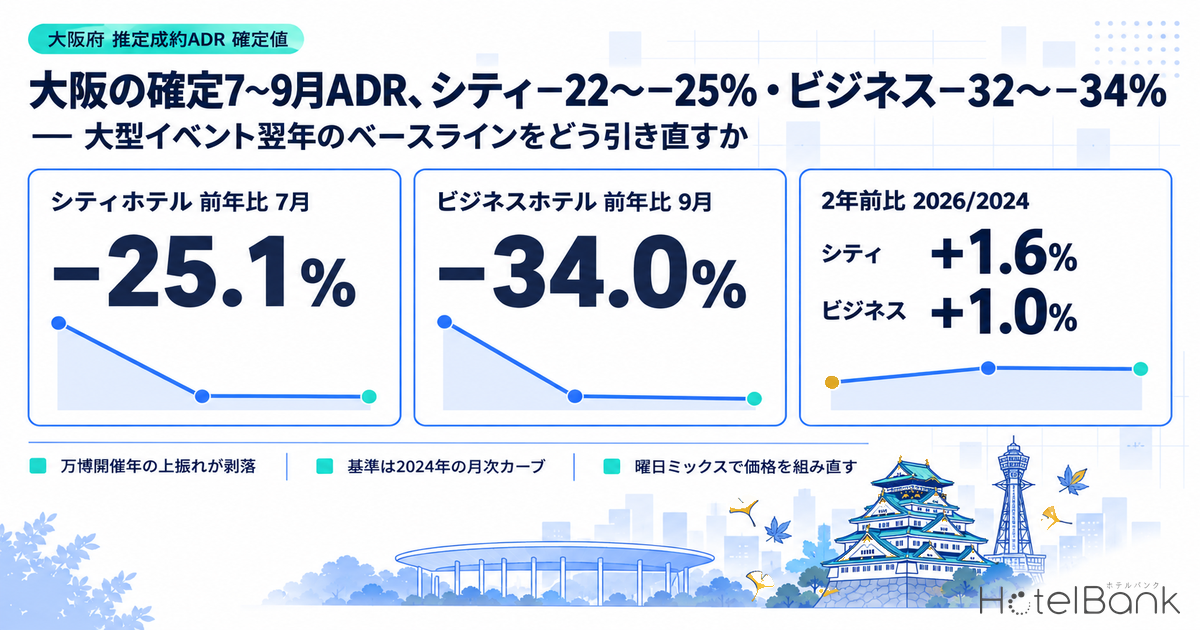
Estimated settled ADR (tax-exclusive equivalent) for July to September 2026 has now been finalized for the Osaka hotel market. Comparing finalized months with the same months a year earlier, city hotels came in at -25.1% in July, -24.4% in August and -21.8% in September, while business hotels posted -31.9% in July, -33.6% in August and -34.0% in September: three straight months of steep declines. The comparison year, however, is 2025, when Expo 2025 Osaka, Kansai ran from April 13 to October 13. Set against the same months of 2024, city hotels were at +1.6% in July, -0.9% in August and +15.4% in September, and business hotels at -3.1% in July, -5.1% in August and +1.0% in September, which shows the market had essentially returned to normal-year levels. This article looks at how to read this “steep year-on-year decline” and what to use as the reference when rebuilding prices for autumn and winter 2026 and beyond, from three angles: the monthly base ADR, the minimum rate and the day-of-week mix.
Scope: Osaka Prefecture city hotels N=97 properties and business hotels N=504 properties (the sample for the finalized September 2026 values). The price metric in this article is estimated settled ADR (the transacted price level estimated from OTA and other sales data, tax-exclusive equivalent); occupancy is an estimate based on OTA-listed inventory. Both are defined at the end of the article. Data as of October 8, 2026.
- — YoY: city hotels -21.8% to -25.1%, business hotels -31.9% to -34.0%. Osaka’s estimated settled ADR (tax-exclusive equivalent, finalized months compared with finalized months) fell sharply in all three months of July to September 2026.
- — Versus two years earlier: city hotels -0.9% to +15.4%, business hotels -5.1% to +1.0%. Against 2024 the market is back at normal-year levels, so the decline reads as the unwinding of the Expo-year (2025) uplift.
- — The 2025 uplift was unique to Osaka. Over July to September combined, Osaka ran +37.6% (city) and +46.1% (business) above 2024, whereas Tokyo, Kyoto, Hyogo, Fukuoka and Hokkaido were at +2.8% to +17.7%.
- — Demand concentrates on Saturdays and long weekends. Estimated OCC (OTA-listed inventory basis) for July to September was 90.0% on Saturdays versus 80.0% on Mondays for city hotels, and 86.7% on Saturdays versus 74.2% on Sundays for business hotels, which makes pricing by day-of-week band effective.
- — November will still show a YoY decline. Even with 8% added to the same month of 2024, November comes out at -5.7% for city hotels and -6.2% for business hotels; YoY only narrows to around zero from December.
The Finalized July-September Numbers: What City -22% to -25% and Business -32% to -34% Mean
Start with the finalized values. Estimated settled ADR for Osaka Prefecture city hotels (N=97) was approx. ¥12,600 in July 2026, approx. ¥13,100 in August and approx. ¥13,100 in September. The same months a year earlier (N=90-91) were approx. ¥16,800, approx. ¥17,300 and approx. ¥16,700 respectively, giving declines of -25.1%, -24.4% and -21.8%. Business hotels (N=497-504) recorded approx. ¥8,400 in July, approx. ¥8,800 in August and approx. ¥8,900 in September, against approx. ¥12,400, approx. ¥13,200 and approx. ¥13,500 a year earlier (N=498-502), for declines of -31.9%, -33.6% and -34.0%, deeper still than city hotels. For the three months combined, the YoY change is -23.8% for city hotels and -33.2% for business hotels.
It would be premature, though, to read these figures alone as “the Osaka market shrank by 20-30%.” The comparison period, July to September 2025, sits in the middle of the Expo 2025 Osaka, Kansai run (April 13 to October 13, 2025). Comparing those 2025 months with 2024, city hotels were up +35.6% in July, +31.0% in August and +47.6% in September, and business hotels up +42.3% in July, +42.9% in August and +53.1% in September, an uplift of 30-50% in a single year. The 2026 decline can be read as that uplift falling away almost in full.
| Segment / month | 2024 (N) | 2025 (N) | 2026 (N) | YoY 2026/2025 | vs. two years earlier 2026/2024 |
|---|---|---|---|---|---|
| City, July | ¥12,384 (88) | ¥16,798 (90) | ¥12,582 (97) | -25.1% | +1.6% |
| City, August | ¥13,203 (88) | ¥17,291 (91) | ¥13,078 (97) | -24.4% | -0.9% |
| City, September | ¥11,336 (88) | ¥16,733 (91) | ¥13,077 (97) | -21.8% | +15.4% |
| Business, July | ¥8,698 (496) | ¥12,380 (502) | ¥8,429 (497) | -31.9% | -3.1% |
| Business, August | ¥9,247 (495) | ¥13,211 (499) | ¥8,772 (503) | -33.6% | -5.1% |
| Business, September | ¥8,784 (494) | ¥13,450 (498) | ¥8,872 (504) | -34.0% | +1.0% |
Estimated settled ADR (tax-exclusive equivalent, finalized monthly values). (N) is the number of properties in the sample. Source: MetroEngines Research, compiled by the HotelBank Editorial Team
What stands out in the table is the rightmost column, “vs. two years earlier.” Overlaying the three finalized months of 2026 on the same months of 2024, city hotels were almost level at +1.6% in July and -0.9% in August, with only September coming out higher at +15.4%. Business hotels were at -3.1% in July, -5.1% in August and +1.0% in September, likewise back at the 2024 level. The six-month average for April to September tells the same story: city hotels were at approx. ¥12,100 in 2024, approx. ¥16,100 in 2025 and approx. ¥12,600 in 2026, and business hotels at approx. ¥9,000, approx. ¥12,800 and approx. ¥8,900, so 2026 resembles the shape of 2024 rather than 2025. In other words, the YoY decline is not telling us the market has contracted; it is a matter of timing, namely “the year after an exceptional year.”
Monthly Curves Overlaid Across Three Years: Only 2025 Has a Different Shape
Next, we overlay monthly estimated settled ADR for 2024, 2025 and 2026 to compare their shapes. For city hotels, 2024 was a low-volatility year, rising gently from approx. ¥11,000 in January to approx. ¥13,200 in August and ending at approx. ¥12,600-12,900 in November and December. In 2025 the level stepped up from approx. ¥13,200 in March to approx. ¥16,000 in April, held a plateau of approx. ¥16,700-17,300 through July to September, then came down to approx. ¥14,500 in November and approx. ¥14,000 in December. 2026 started high at approx. ¥14,000 in January (+25.0% YoY), ran about 3% below the prior year in February and March at approx. ¥11,400-12,800, tracked the 2024 shape in April and May at approx. ¥12,900-13,100, dropped to approx. ¥10,800 in June (-26.3% YoY, -6.0% versus two years earlier), and then moved at approx. ¥12,600-13,100 from July to September.
Osaka Prefecture city hotels, estimated settled ADR (tax-exclusive equivalent, monthly). October-December 2026 (dotted line) is an estimate based on current sales conditions and may change. N=83-97 properties. Source: MetroEngines Research, compiled by the HotelBank Editorial Team
For business hotels the difference in amplitude across the three years is even more pronounced. 2024 stayed within a band of approx. ¥8,200-10,000 all year. In 2025, April at approx. ¥12,900 and May at approx. ¥13,400 were already 30-50% above the same months of 2024 in spring, the plateau continued through to approx. ¥13,500 in September, and the level then came down to approx. ¥10,500-11,600 in November and December. 2026 opened at approx. ¥9,100 in January (+3.9% YoY) and ran around 10% below the prior year in February and March at approx. ¥8,400-9,300, yet the gap to the same months of 2024 was only -0.9% to -5.0%. From April onward it moved at approx. ¥7,900-9,800, hit a year-to-date low of approx. ¥7,900 in June, and was close to flat at approx. ¥8,400-8,900 from July to September.
Osaka Prefecture business hotels, estimated settled ADR (tax-exclusive equivalent, monthly). October-December 2026 (dotted line) is an estimate based on current sales conditions and may change. N=484-504 properties. Source: MetroEngines Research, compiled by the HotelBank Editorial Team
What the two charts have in common is that only the 2025 line jumps up like a step in April, holds a plateau until October, and returns to the band of the other two years from November. Put differently, 2026 YoY is structurally negative from April through October and narrows naturally from November as the comparison base approaches a normal year. Cutting prices another notch in response to the July-September declines, without building in this premise, risks dragging low rates into November and beyond, when comparisons should recover on their own. For October 2026, estimates based on current sales conditions stand at approx. ¥15,700 for city hotels and approx. ¥10,900 for business hotels (N=97 and 497 respectively), but a straightforward comparison with finalized values should wait until the month closes.
Lining Up YoY by Month: The Decline Began in April, with a Segment Gap of Up to 12pt
Lining up the finalized January-September 2026 values by month on a YoY basis shows when the decline began and how deep it went. City hotels moved at +25.0% in January, -3.0% in February and -3.1% in March, then -18.1% in April, -16.6% in May, -26.3% in June, -25.1% in July, -24.4% in August and -21.8% in September, with the decline widening a notch from April. Business hotels went from +3.9% in January, -11.1% in February and -8.9% in March to -23.8% in April, -27.5% in May, -32.8% in June, -31.9% in July, -33.6% in August and -34.0% in September; the decline widened from the same month, April, and deepened into the summer.
Year-on-year change in estimated settled ADR (tax-exclusive equivalent, finalized months compared with finalized months). Shading marks months that overlapped the prior year’s major event period (April 13 to October 13, 2025). Source: MetroEngines Research, compiled by the HotelBank Editorial Team
The point to note is the difference between segments. YoY for April to September was -16.6% to -26.3% for city hotels and -23.8% to -34.0% for business hotels, with business hotels 5.7-12.2pt deeper in every month (the smallest gap was 5.7pt in April, the largest 12.2pt in September). This mirrors the difference in the size of the 2025 uplift. The increase in April-September 2025 over the same months of 2024 was +27.6% to +47.6% for city hotels and +35.6% to +53.1% for business hotels: the lower the rate level of the segment, the larger the uplift in percentage terms. As a result, the August gap between the two segments was almost constant in yen terms, at approx. ¥4,000 in 2024, approx. ¥4,100 in 2025 and approx. ¥4,300 in 2026, yet the swing in percentage terms is larger when seen from the business hotel side. When translating YoY into targets for your own property, this “percentage amplification” needs to be adjusted for by segment.
Side by Side with Other Major Prefectures: Only Osaka Jumped in 2025
Whether Osaka’s YoY decline is “the Expo unwinding” or “a nationwide rate correction” is easier to separate out by lining it up against other prefectures on the same yardstick. Table 2 compares city hotels and business hotels in Tokyo, Kyoto, Hyogo, Fukuoka and Hokkaido using the same estimated settled ADR (tax-exclusive equivalent) for finalized months, combined over the three months of July to September.
| Segment / prefecture | July-September 2026 average (N) | YoY 2026/2025 | vs. two years earlier 2026/2024 | 2025 uplift 2025/2024 |
|---|---|---|---|---|
| City, Osaka | ¥12,912 (97) | -23.8% | +4.9% | +37.6% |
| City, Tokyo | ¥22,783 (107-110) | -15.9% | -2.3% | +16.2% |
| City, Kyoto | ¥19,087 (58-61) | -13.8% | -7.6% | +7.2% |
| City, Hyogo | ¥12,745 (47) | -8.0% | +8.3% | +17.7% |
| City, Fukuoka | ¥17,878 (40-43) | +10.1% | +13.2% | +2.8% |
| City, Hokkaido | ¥17,368 (75) | -6.0% | +6.9% | +13.8% |
| Business, Osaka | ¥8,691 (497-504) | -33.2% | -2.5% | +46.1% |
| Business, Tokyo | ¥12,408 (913-915) | -3.9% | +4.4% | +8.7% |
| Business, Kyoto | ¥10,641 (325-327) | -10.3% | +0.6% | +12.2% |
| Business, Hyogo | ¥7,868 (166-168) | +2.1% | +9.3% | +7.1% |
| Business, Fukuoka | ¥10,726 (340-342) | +5.2% | +11.9% | +6.5% |
| Business, Hokkaido | ¥11,108 (432-438) | +5.1% | +14.2% | +8.7% |
Comparison of estimated settled ADR (tax-exclusive equivalent, finalized monthly values) combined over the three months of July to September. (N) is the number of properties in the sample for July-September 2026. Aichi is excluded because the 20th Asian Games were held there from September 19 to October 4, 2026, which puts a major event on the current-year side as well. Source: MetroEngines Research, compiled by the HotelBank Editorial Team
The biggest difference is in the rightmost column, “2025 uplift.” In Osaka, July-September 2025 exceeded the same period of 2024 by +37.6% for city hotels and +46.1% for business hotels, whereas the other five prefectures stayed at +2.8% to +17.7% for city hotels and +6.5% to +12.2% for business hotels. On a YoY basis too, against Osaka’s -23.8% for city hotels and -33.2% for business hotels, the five prefectures fall within a range of -15.9% to +10.1%, so a 20-30% decline is specific to Osaka. Restated against two years earlier, however, Osaka is at +4.9% for city hotels and -2.5% for business hotels, inside the five prefectures’ band of -7.6% to +14.2%. The deep YoY decline is not a market-wide correction but the flip side of the prior year’s uplift having been concentrated in Osaka, and it supports the decision to place the baseline on the 2024 side.
Where the Day-of-Week Mix Stands: July-September Estimated OCC Peaks on Saturdays, with Troughs on Mondays and Sundays
When redrawing the baseline, the day-of-week composition of demand deserves a check alongside price. Averaging Osaka Prefecture’s estimated OCC (OTA-listed inventory basis) by day of week over the 92 days of July to September 2026, city hotels (34-40 properties / 7,848-9,042 rooms in the sample, based on listings on major booking sites) were at 90.0% on Saturdays against 80.0% on Mondays and 81.1% on Sundays, a Saturday-Monday gap of 10.0pt. Business hotels (282-300 properties / 47,378-49,130 rooms in the sample) were at 86.7% on Saturdays and 83.4% on Thursdays against 75.6% on Mondays and 74.2% on Sundays, with the drop from the weekend to the start of the week opening up to 12.5pt.
| Day of week | City hotels estimated OCC | Business hotels estimated OCC | Segment gap (city minus business) |
|---|---|---|---|
| Monday | 80.0% | 75.6% | +4.4pt |
| Tuesday | 81.7% | 80.8% | +0.9pt |
| Wednesday | 82.0% | 81.7% | +0.3pt |
| Thursday | 83.3% | 83.4% | -0.1pt |
| Friday | 84.3% | 80.3% | +4.0pt |
| Saturday | 90.0% | 86.7% | +3.3pt |
| Sunday | 81.1% | 74.2% | +6.9pt |
Average of estimated OCC (OTA-listed inventory basis, latest observation) by day of week for stay dates from July 1 to September 30, 2026 (92 days). City hotels: 34-40 properties in the sample; business hotels: 282-300 properties. Source: MetroEngines Research, compiled by the HotelBank Editorial Team
By monthly average, city hotels were at 83.9% in July, 83.6% in August and 82.0% in September, and business hotels at 81.1% in July, 80.1% in August and 80.0% in September. Both were stable in the 80% range, which means that while rates returned to the 2024 level, occupancy held its depth. The highest individual days for city hotels were Saturday, July 11 at 93.7%, Saturday, August 1 at 94.1% and Sunday, September 20 at 100.0%; for business hotels, Saturday, July 11 at 92.0%, Saturday, August 8 at 88.3% and Sunday, September 20 at 100.0%. During the five-day holiday stretch of September 19-23, both segments recorded more than 98% on Monday, September 21, a public holiday. (The 100.0% on September 20 is an observation in which listed remaining rooms fell to almost zero; because the definition counts listings withdrawn through stop-sells as consumed inventory, it is not a value that indicates the ceiling of actual room occupancy.) The lowest days, by contrast, were Monday, August 31 at 65.3% for city hotels, and Monday, August 31 at 64.2% and Sunday, September 6 at 65.4% for business hotels: the start of the week after the summer holidays and a Sunday with no long weekend attached form the troughs. This pattern, with demand concentrated on Saturdays and long weekends and softening on Mondays and Sundays, is the basis for repricing “by day-of-week band” rather than “uniformly across all days.”
Where to Set the Base ADR for November-December: Sensitivity of Same-Month 2024 x Uplift Rate
Before moving on to the insights, Table 4 shows where the base ADR for November and December would land, by uplift rate, if the decision is to “redraw using 2024 as the reference.” It gives each level obtained by adding 0-8% to the finalized value for the same month of 2024, together with the YoY percentage that level represents against the finalized value for the same month of 2025.
| Segment / month | Same month 2024 +/-0% | +3% | +5% | +8% | Reference 2025 finalized | Reference 2026 current estimate |
|---|---|---|---|---|---|---|
| City, November | ¥12,643 (-12.7%) | ¥13,022 (-10.1%) | ¥13,275 (-8.3%) | ¥13,654 (-5.7%) | ¥14,484 | ¥15,233 |
| City, December | ¥12,886 (-7.6%) | ¥13,273 (-4.9%) | ¥13,530 (-3.0%) | ¥13,917 (-0.2%) | ¥13,951 | ¥13,802 |
| Business, November | ¥10,035 (-13.1%) | ¥10,336 (-10.5%) | ¥10,537 (-8.8%) | ¥10,838 (-6.2%) | ¥11,554 | ¥10,951 |
| Business, December | ¥9,940 (-5.7%) | ¥10,238 (-2.9%) | ¥10,437 (-1.0%) | ¥10,735 (+1.8%) | ¥10,546 | ¥10,167 |
Estimated settled ADR (tax-exclusive equivalent). Uplift rates are assumptions for the purpose of the calculation. The 2026 current estimate is based on sales conditions as of October 8, 2026 and may change before the month is finalized. Source: MetroEngines Research, compiled by the HotelBank Editorial Team
What Table 4 shows is that YoY looks very different in November and December. In November, some of the uplift still remained in 2025 (approx. ¥14,500 for city hotels, approx. ¥11,600 for business hotels), so even adding 8% to the same month of 2024 leaves YoY negative at -5.7% for city hotels and -6.2% for business hotels. In December, by contrast, the 2025 uplift had almost entirely gone: the same month of 2024 as it stands gives -7.6% for city hotels and -5.7% for business hotels, but adding 8% brings YoY to around zero, at -0.2% for city hotels and +1.8% for business hotels. So although “YoY narrows naturally from November,” targets for November still need to assume a decline of a few percent to just over 10%. Note that the current estimate for November stands at ¥15,233 for city hotels, above the 2025 finalized value, while business hotels are below it at ¥10,951. The further out the month, the more the estimate moves with sales conditions, so finalized values should be used to set the baseline, with current estimates kept for checking progress.
For Revenue Managers Running City and Business Hotels in Osaka: Implications and Action Plan
Insight 1: Replace YoY targets with a “vs. two years earlier” check. The three finalized months in this article were at -21.8% to -25.1% for city hotels and -31.9% to -34.0% for business hotels YoY, yet within -0.9% to +15.4% and -5.1% to +1.0% respectively against two years earlier. Continuing to evaluate your property’s monthly results on a YoY basis makes even results that are healthy on a normal-year basis look like a “miss.” Budgets, targets and evaluation should be re-anchored once to 2024 actuals (or to the average of 2024 and finalized 2026 values).
Insight 2: The YoY decline is structured to continue through October and narrow naturally from November. The 2025 line jumps in April, holds a plateau until October, and returns to the band of the other years in November (approx. ¥14,500 for city hotels, approx. ¥11,600 for business hotels) and December (approx. ¥14,000 and approx. ¥10,500). Lowering base rates for November-December or the new year on the strength of October’s YoY alone means carrying low rates into the period when the comparison base returns to a normal year. Monthly base ADR should be set after first judging, month by month, “whether the prior year was an exceptional month or a normal month.”
Insight 3: Redraw the minimum rate from finalized 2024 and 2026 values, not from 2025 results. Leaving floor prices at the level they were raised to in 2025 loses occupancy at normal-year demand levels; conversely, cutting too far in reaction to YoY breaks below the 2024 band (April-September average of approx. ¥12,100 for city hotels and approx. ¥9,000 for business hotels). The fact that the finalized 2026 values (approx. ¥12,600 and approx. ¥8,900 on the same basis) sit in almost the same band as 2024 is a reference point that can be used directly to reset the floor.
Insight 4: Build the day-of-week mix on a “capture on Saturdays and long weekends, fill on Mondays and Sundays” pattern. Estimated OCC for July to September showed wide gaps: 90.0% on Saturdays versus 80.0% on Mondays for city hotels, and 86.7% on Saturdays versus 74.2% on Sundays for business hotels. Instead of lowering base ADR across the board, holding the Saturday and pre-holiday bands at the upper end of the normal-year range while moving only the Monday and Sunday bands closer to the floor leaves room to fill the occupancy troughs while protecting the overall average rate.
| Time frame | Action | Decision trigger (tied to figures in this article) | Aim |
|---|---|---|---|
| Today to this week | Re-tabulate your property’s July-September ADR on both a YoY basis and against two years earlier | If your property’s YoY is shallower than the market (city -21.8% to -25.1% / business -31.9% to -34.0%) and its change against two years earlier exceeds the market (city -0.9% to +15.4% / business -5.1% to +1.0%), it can be judged healthy on a normal-year basis | Remove the misalignment in the evaluation axis and avoid unnecessary rate cuts |
| Today to this week | Separate selling-rate bands for Mondays and Sundays from those for Saturdays and long weekends | If your property’s day-of-week occupancy gap is wider than the market band (city: Saturday 90.0% / Monday 80.0%; business: Saturday 86.7% / Sunday 74.2%), adjust only the trough days toward the floor | Fill the troughs while protecting the average rate |
| Within two weeks | Reset monthly base ADR for November-December and the new year from 2024 actuals and finalized 2026 values | If the current baseline still references November-December 2025 (city approx. ¥14,500 and approx. ¥14,000 / business approx. ¥11,600 and approx. ¥10,500), reposition it in the middle band between those and the same months of 2024 (city approx. ¥12,600 and approx. ¥12,900 / business approx. ¥10,000 and approx. ¥9,900) | Shape prices to match the period when the comparison base returns to a normal year |
| Within two weeks | Review the minimum rate against the segment’s normal-year band | If your property’s floor is well below the market’s April-September averages for 2024 and 2026 (city approx. ¥12,100-12,600 / business approx. ¥8,900-9,000), consider the room to raise the floor | Protect the rate floor even under normal-year demand |
| Looking to next month | Once the October finalized value is out, lock in April-October 2026 as a single “normal-year baseline” | If the October finalized value deviates substantially from the current estimate (city ¥15,668 / business ¥10,876), fine-tune the baseline by also cross-checking the autumn demand shape against October 2024 (city approx. ¥12,500 / business approx. ¥9,300) | Align the base for the 2027 budget with a normal year rather than an exceptional year |
| Looking to next month | Build the April-September 2027 budget as “finalized 2026 values x seasonal factors” and demote YoY targets to a supporting metric | If April-September 2025 (city average approx. ¥16,100 / business approx. ¥12,800) remains in the budget assumptions, replace it with the 2026 average (approx. ¥12,600 / approx. ¥8,900) | Avoid repeating the same “YoY shock” next year |
Source: MetroEngines Research, compiled by the HotelBank Editorial Team
Summary: Three Yardsticks for Reading ADR in the Year After a Major Event
To sum up, Osaka Prefecture’s finalized ADR for July to September 2026 looks deeply negative on a YoY basis, at -21.8% to -25.1% for city hotels and -31.9% to -34.0% for business hotels, yet against two years earlier it was back in the normal-year band at -0.9% to +15.4% for city hotels and -5.1% to +1.0% for business hotels. There are three yardsticks for bringing this reading to your own property. First, for months in which a major event fell in the prior year, make “vs. two years earlier” the primary metric and demote YoY to a supporting one. Second, redraw monthly base ADR and the minimum rate from the band formed by a normal year (2024) and the latest finalized values (2026), not from the results of an exceptional year. Third, taking the day-of-week gap in estimated OCC (10.0-12.5pt between Saturdays and Mondays or Sundays) as given, reprice by day-of-week band. Before reacting to a YoY figure by cutting prices uniformly across all days, first check what kind of year the comparison year was.
Frequently Asked Questions
Q. Did hotel ADR in Osaka fall in 2026?
A. Year on year, it fell sharply: -21.8% to -25.1% for city hotels and -31.9% to -34.0% for business hotels (July-September 2026, estimated settled ADR, finalized months compared with finalized months). Compared with the same months of 2024, however, city hotels were at -0.9% to +15.4% and business hotels at -5.1% to +1.0%, so the reasonable reading is that the market returned to normal-year levels.
Q. Why look at the comparison with two years earlier rather than YoY?
A. The comparison period of April 13 to October 13, 2025 was the run of Expo 2025 Osaka, Kansai, and estimated settled ADR for July-September 2025 exceeded the same period of 2024 by +37.6% for city hotels and +46.1% for business hotels. Using an exceptional year as the reference makes even results that are healthy for a normal year look like a “miss,” so for months in which a major event fell in the prior year, the comparison with two years earlier is used as the primary metric.
Q. Is the same decline happening in other prefectures?
A. The July-September combined YoY for Tokyo, Kyoto, Hyogo, Fukuoka and Hokkaido ranges from -15.9% to +10.1%; a decline of 20-30% is specific to Osaka. Against two years earlier, Osaka (city +4.9%, business -2.5%) also falls within the five prefectures’ band (-7.6% to +14.2%).
Q. How long will the YoY decline continue?
A. The 2025 uplift lasted from April to October and narrowed from November. Even with a baseline of 8% added to the same month of 2024, November still shows a YoY decline of -5.7% for city hotels and -6.2% for business hotels; it only narrows to around zero from December.
Q. What should the minimum rate be redrawn against?
A. Reference the band of finalized 2024 and 2026 values, not the floor that was raised in 2025. The April-September average was approx. ¥12,100 in 2024 and approx. ¥12,600 in 2026 for city hotels, and approx. ¥9,000 and approx. ¥8,900 for business hotels; the fact that both years sit in almost the same band is the reference point for resetting the floor.
About the Data
| Estimated OCC (OTA-listed inventory basis) | OTA-listed inventory-based occupancy = 100 – 100 x OTA-listed remaining rooms / total rooms. The cohort consists of properties that list at least 30% of their total rooms on OTAs (the number of properties varies slightly by stay date, so it is shown as a range). It is an estimate based on how inventory sold on OTAs is being consumed, and its definition differs from actual room occupancy (it runs higher because unlisted rooms are counted as consumed). The day-of-week figures in this article cover stay dates from July 1 to September 30, 2026, and comprise 34-40 Osaka Prefecture city hotels (7,848-9,042 rooms) and 282-300 business hotels (47,378-49,130 rooms). |
| Booking curve | Based on observations from 45 days before the stay date up to the most recent. Estimated OCC in this article uses the latest observation for each stay date. |
| Estimated settled ADR | The transacted price level (tax-exclusive equivalent) estimated from OTA and other sales data (lowest-plan level x segment-specific coefficients, an ensemble across multiple channels). Past months are finalized values; current and future months are estimates based on current sales conditions. The median error when checked against published operating results is 6.6%. All YoY and two-year comparisons in this article are between finalized months; only the values for October-December 2026 are shown separately as current estimates. |
| Number of properties (N) | Estimated settled ADR: Osaka Prefecture city hotels, 83-88 properties in 2024, 89-91 in 2025 and 91-97 in 2026; business hotels, 484-499 properties in 2024, 487-503 in 2025 and 487-504 in 2026 (varies by month; monthly N is shown in the tables). Segment classification follows HotelBank’s category classification. |
| Data as of | Data as of October 8, 2026. Sales conditions and inventory change daily, so the figures in this article are a snapshot at the time of retrieval. |
References and Sources
■ Data sources
Estimated settled ADR (tax-exclusive equivalent, monthly) was aggregated for city hotels and business hotels in Osaka Prefecture and five comparison prefectures (Tokyo, Kyoto, Hyogo, Fukuoka and Hokkaido), covering finalized months from January 2024 to September 2026 and current estimates for October-December 2026. Estimated OCC (OTA-listed inventory basis) is the latest observation for Osaka Prefecture stay dates from July 1 to September 30, 2026 (92 days). The dates of Expo 2025 Osaka, Kansai were confirmed on its official website, and the dates of the Asian Games on the official website of the Games.
■ Calculation assumptions
All YoY and two-year comparisons are between finalized months. The July-September combined figure is the ratio between simple sums of estimated settled ADR for the three months. The April-September average is the simple average of the six months. The base ADR sensitivity in Table 4 uses assumed values obtained by adding 0, 3, 5 and 8% to the finalized value for the same month of 2024, and YoY there is the ratio to the finalized value for the same month of 2025. Estimated OCC by day of week is the simple average, by day of week, of the value for each stay date.
■ Limitations and caveats
Estimated settled ADR is an estimate derived from sales data, with a median error of 6.6% when checked against published operating results. The number of properties in the sample (N) varies by month. Estimated OCC is on an OTA-listed inventory basis and runs higher than actual room occupancy because listings withdrawn through stop-sells are also counted as consumed. Values for October-December 2026 are current estimates and may change before each month is finalized. The five comparison prefectures were selected for contrast with Osaka and do not represent a national average.
| Expo 2025 Osaka, Kansai, Japan official website — held April 13 to October 13, 2025 | https://www.expo2025.or.jp/ |
| 20th Asian Games (Aichi-Nagoya) official website — held September 19 to October 4, 2026 | https://www.aichi-nagoya2026.org/ |
| Estimated settled ADR and estimated OCC (Osaka Prefecture and five comparison prefectures) | Source: MetroEngines Research, compiled by the HotelBank Editorial Team |