

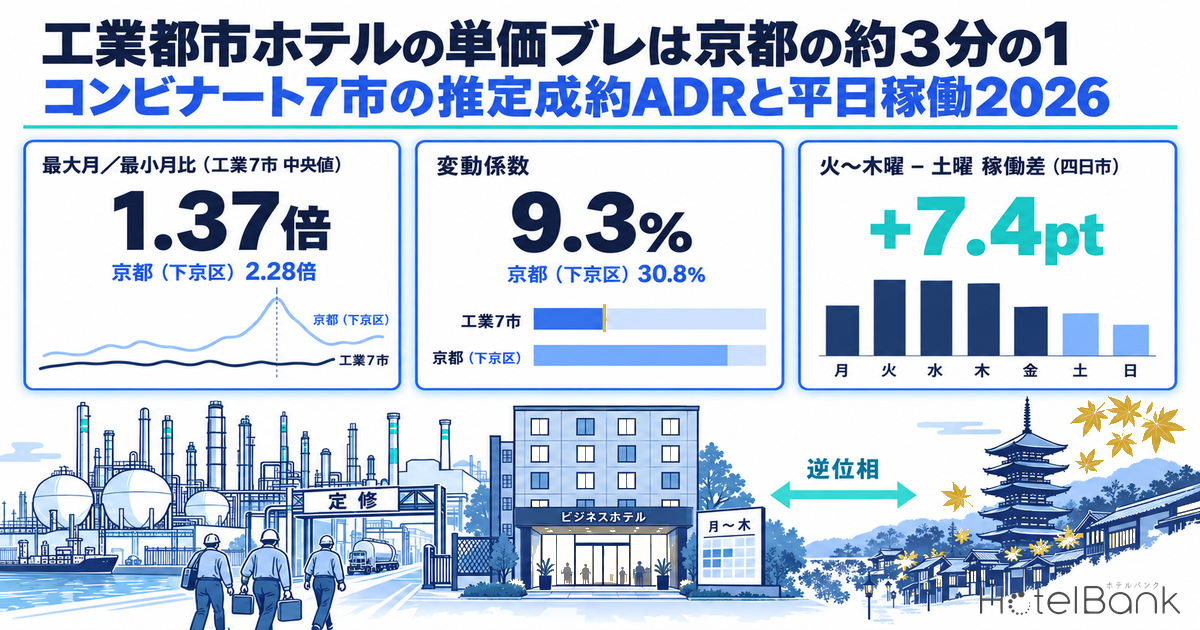
MetroEngines Research compiled 24 months of estimated settled ADR (October 2024–September 2026) for business hotels in seven industrial cities that host petrochemical or steel complexes — Yokkaichi, Ichihara, Shunan, Oita, Sakai, Kurashiki and Kamisu. Laid out month by month, the ratio of each city’s peak month to its trough month has a median of just 1.37×, far shallower than the 2.28× seen in tourism-led Kyoto (Shimogyo Ward). Cutting inventory absorption for June–September 2026 by day of week, Tuesday–Thursday occupancy exceeded Saturday in all six of the industrial cities where occupancy could be estimated, while in all three tourism cities — Kyoto, Kanazawa and Beppu — Saturday exceeded Tuesday–Thursday. This article quantifies how much stability this weekday demand, running in the opposite phase to tourism demand, brings to both rate and occupancy, and checks against primary sources the seasonality of plant turnarounds (scheduled maintenance shutdowns) that is often cited as its driver.
Metric Definitions Used in This Article
- ADR (average daily rate): An estimated settled rate (tax-excluded equivalent), calculated by applying a hotel-type-specific adjustment factor to the lowest plan price each property publishes on OTAs and other channels (per room, 2 guests per room, tax included). Checked against property-level results disclosed by listed hotel REITs (91 properties, most recent 3 months), the median error is about 7%. These are estimates and differ from each property’s actual transaction prices and accounting figures. Area-level ADR is the median of the properties covered (the level of a typical property in the area); this article aggregates business hotels only (the number of properties per city is N in Table 1).
- Peak/trough month ratio: For the 12 months from October 2025 to September 2026, the maximum monthly ADR divided by the minimum. The closer to 1.00×, the flatter the annual curve and the shallower the “trough.” For reference, the ratio excluding the single peak month (second-highest ÷ minimum) and the coefficient of variation (standard deviation ÷ mean) are also shown.
- OCC (occupancy rate): Rooms sold as a share of total rooms in the area (an estimate based on OTA sales inventory). This article averages daily estimates from 10 June to 30 September 2026 by day of week. It is an estimate based on the absorption of inventory sold on OTAs and differs from a property’s actual overall occupancy.
- Data source: MetroEngines Research (tracks about 168,000 properties in Japan, of which about 27,000 properties with confirmed activity on major booking sites are analyzed)
- — Median peak/trough ratio of 1.37× — Estimated settled ADR for business hotels in the seven industrial-complex cities (October 2025–September 2026). Kyoto (Shimogyo Ward) is 2.28×, Kanazawa 1.69× and Beppu 1.47×.
- — Coefficient of variation about one-third of Kyoto’s — A median of 9.3% across the seven industrial cities versus 30.8% for Kyoto (Shimogyo Ward). Yokkaichi (1.63×) and Kamisu (1.87×), however, swing as much as Kanazawa.
- — Weekday-type demand: Tue–Thu beats Saturday — In estimated occupancy by day of week for 10 June–30 September 2026, this holds for all six industrial cities where occupancy could be estimated (Yokkaichi +7.4pt). In all three tourism cities, Saturday is higher (Beppu −10.4pt).
- — Peak months scattered city by city — The seven industrial cities peak in February, March, June, September and October, while the three tourism cities all peak in November–December 2025. Combined, peaks and troughs tend to offset each other.
- — Spring (May–June) turnaround concentration confirmed in public documents; autumn remains a hypothesis — Safety inspections are annual and major turnarounds run on 2–4-year cycles, generating construction demand on a logic separate from production volume.
The 10 Cities Studied — Seven Industrial-Complex Cities and Three Tourism Cities
First, the setup. For industrial cities we chose seven cities where large oil refining, petrochemical and steel plants cluster along the coast, and limited ADR to business hotels. For Sakai we used Sakai Ward — where hotels concentrate among the city’s seven wards — and for Kyoto we used Shimogyo Ward, which contains Kyoto Station, each as a municipal-level aggregation unit. As tourism-led comparison cities we chose Kyoto (Shimogyo Ward), where rates jump in the autumn-foliage season; Kanazawa, the regional tourism hub of Hokuriku; and Beppu, driven by hot-spring demand. Beppu and Oita are neighbors in the same prefecture, giving a pairing that compares “tourism-led” and “industry-led” curves within a single prefecture.
| City | Prefecture | Main plant cluster / comparison role | Business hotels N (properties) |
|---|---|---|---|
| Yokkaichi (四日市) | Mie | Yokkaichi complex (oil refining, petrochemicals) | 18 |
| Ichihara (市原) | Chiba | Keiyo coastal zone (Goi, Anesaki and Ichihara districts) | 13 |
| Shunan (周南) | Yamaguchi | Shunan complex (Tokuyama, Shin-Nanyo) | 15 |
| Oita (大分) | Oita | Oita coastal industrial zone (steel, oil refining, petrochemicals) | 33 |
| Sakai (Sakai Ward, 堺区) | Osaka | Sakai-Senboku coastal industrial zone | 13 |
| Kurashiki (倉敷) | Okayama | Mizushima coastal industrial zone | 24 |
| Kamisu (神栖) | Ibaraki | Kashima coastal industrial zone | 14 |
| Kyoto (Shimogyo Ward, 下京区) | Kyoto | Comparison: tourism-led (Kyoto Station area) | 116 |
| Kanazawa (金沢) | Ishikawa | Comparison: tourism-led | 82 |
| Beppu (別府) | Oita | Comparison: tourism-led (hot springs) | 21 |
Table 1. Source: MetroEngines Research; compiled by HotelBank Editorial Team. N is the median number of business hotels used to calculate estimated settled ADR from October 2025 to September 2026.
Monthly Curves — The Industrial-City Median Stays Within ¥6,000–¥7,400 All Year
Taking the median of monthly ADR across the seven industrial cities, 2025 stayed within a range from about ¥6,100 in January to about ¥7,200 in June, and January–September 2026 moved within a band of about ¥6,400–¥7,400. The median of the three tourism cities, by contrast, rose to about ¥12,200 in November 2025 and then fell to about ¥7,200 in June 2026. The tourism-city median has a peak/trough ratio of 1.69× and a coefficient of variation of 13.9%, versus 1.18× and 4.5% for the industrial-city median. Comparing the January–September 2026 average with the same period a year earlier, the industrial-city median was about ¥6,800, up 3.6% YoY, and the tourism-city median about ¥9,100, up 1.9%: tourism cities are higher in rate level, but industrial cities grew faster.
Figure 1. Median estimated settled ADR for business hotels, seven industrial cities vs three tourism cities (monthly, years overlaid). Source: MetroEngines Research; compiled by HotelBank Editorial Team.
One caveat: the industrial curve looks flat partly because it is a median. Looked at individually, some cities have event-driven spike months. We examine those next.
Depth of the Trough by City — Peak/Trough Ratios of 1.25–1.87× in Industrial Cities vs 2.28× in Kyoto
Lining up the peak/trough ratio for October 2025–September 2026 by city, the seven industrial cities range from 1.25× in Oita to 1.87× in Kamisu, with a median of 1.37×. The three tourism cities are Kyoto (Shimogyo Ward) at 2.28×, Kanazawa at 1.69× and Beppu at 1.47×. By coefficient of variation, too, the industrial-city median of 9.3% compares with 30.8% for Kyoto, so rate dispersion in industrial cities is only about one-third of Kyoto’s. Within the industrial group, however, Yokkaichi (1.63×) and Kamisu (1.87×) show ratios equal to or above tourism-city Kanazawa — not every industrial city is flat.
Figure 2. Peak/trough month ratio by city (October 2025–September 2026, business-hotel estimated settled ADR). Source: MetroEngines Research; compiled by HotelBank Editorial Team.
| City | Type | 12-month average | Peak month | Trough month | Peak / trough | Excl. peak month | Coefficient of variation | Sep 2026 YoY |
|---|---|---|---|---|---|---|---|---|
| Yokkaichi | Industrial | ¥7,560 | Mar 2026 (¥10,214) | Feb 2026 (¥6,274) | 1.63× | 1.49× | 15.6% | +31.1% |
| Ichihara | Industrial | ¥6,818 | Feb 2026 (¥7,928) | Dec 2025 (¥6,208) | 1.28× | 1.18× | 7.0% | +11.2% |
| Shunan | Industrial | ¥5,554 | Sep 2026 (¥6,326) | Mar 2026 (¥4,925) | 1.28× | 1.26× | 7.2% | +10.7% |
| Oita | Industrial | ¥6,505 | Mar 2026 (¥7,457) | Jun 2026 (¥5,969) | 1.25× | 1.20× | 6.6% | +8.7% |
| Sakai (Sakai Ward) | Industrial | ¥7,413 | Oct 2025 (¥8,998) | Feb 2026 (¥6,410) | 1.40× | 1.22× | 9.3% | -30.6% |
| Kurashiki | Industrial | ¥7,568 | Sep 2026 (¥9,104) | Jun 2026 (¥6,628) | 1.37× | 1.29× | 9.9% | +27.4% |
| Kamisu | Industrial | ¥7,112 | Jun 2026 (¥10,823) | Oct 2025 (¥5,802) | 1.87× | 1.63× | 20.6% | +6.8% |
| Kyoto (Shimogyo Ward) | Tourism | ¥14,701 | Nov 2025 (¥22,408) | Jun 2026 (¥9,846) | 2.28× | 2.21× | 30.8% | -6.2% |
| Kanazawa | Tourism | ¥8,955 | Nov 2025 (¥12,186) | Feb 2026 (¥7,190) | 1.69× | 1.48× | 18.3% | +16.1% |
| Beppu | Tourism | ¥8,618 | Dec 2025 (¥10,379) | Jun 2026 (¥7,050) | 1.47× | 1.42× | 11.2% | +13.6% |
Table 2. Source: MetroEngines Research; compiled by HotelBank Editorial Team. Period covers closed months from October 2025 to September 2026 only. The YoY figure for Sakai (Sakai Ward) includes the Expo 2025 Osaka, Kansai period (13 April–13 October 2025) in its comparison base.
Yokkaichi’s spike month is March 2026 (about ¥10,200), which coincides with the Formula 1 Japanese Grand Prix — traditionally held in autumn — being run at Suzuka Circuit in spring, on 27–29 March 2026. In 2025, April (about ¥8,300) was the first-half peak (the full-year high was August at about ¥8,600), so the spring peak moved along with the F1 race month as it shifted from April to March. Kamisu’s spike month is June 2026 (about ¥10,800), and in 2025 May (about ¥8,300) was also a peak. This overlaps with the turnaround season discussed below, but there is no evidence that pins it to a single cause. Kurashiki and Shunan both peaked in September 2026, each showing double-digit YoY gains (Kurashiki +27.4%, Shunan +10.7%).
Sakai (Sakai Ward) alone shows a steep YoY decline of −30.6%, because September 2025 fell within the Expo 2025 Osaka, Kansai period and the comparison base was inflated by Expo demand. Its peak month for October 2025–September 2026 was likewise October 2025 (about ¥9,000), the month the Expo closed, so Sakai’s curve should not be read as the underlying seasonality of an industrial city. Since February 2026, after the Expo closed, it has moved within a range of about ¥6,400–¥7,800, which can be considered Sakai’s normal level.
Peak Months Scatter in Industrial Cities and Align in Tourism Cities
The other thing that stands out in Table 2 is the month of the peaks and troughs. In the three tourism cities, the peak months align in autumn–winter — November 2025 for both Kyoto and Kanazawa and December 2025 for Beppu — and the trough months align in the rainy season and winter: June 2026 for Kyoto and Beppu, February 2026 for Kanazawa. In other words, tourism-led cities move on the same calendar. The seven industrial cities, by contrast, peak in March (Yokkaichi, Oita), February (Ichihara), June (Kamisu), September (Shunan, Kurashiki) and October (Sakai), and their troughs are likewise spread across February, March, June, October and December. In a portfolio combining several industrial cities, peaks and troughs therefore tend to offset one another. Tourism cities command higher rates, but because tourist destinations nationwide peak in the same months, month-to-month income swings across a portfolio tend to be larger.
Figure 3. Business-hotel estimated settled ADR in Yokkaichi and Kamisu (monthly, 2025 and 2026 overlaid). Source: MetroEngines Research; compiled by HotelBank Editorial Team.
Inventory Absorption by Day of Week — Tue–Thu Beats Saturday in Six Industrial Cities; the Reverse in Three Tourism Cities
After the rate curves, we cut occupancy by day of week. We took MetroEngines Research’s daily estimated occupancy (based on OTA-listed inventory) for 10 June–30 September 2026 and averaged it by weekday. The base is business hotels; for Ichihara, Sakai (Sakai Ward) and Kamisu, where business hotels alone did not meet the aggregation threshold, we substituted the all-types estimate (marked * in Table 3). Shunan is excluded from this comparison because the number of properties eligible for occupancy estimation did not meet the threshold.
The result splits cleanly in two. In Yokkaichi (11 business hotels, 1,307 rooms), average Tuesday–Thursday occupancy was 92.5% against 85.1% on Saturday, so weekdays exceed Saturday by 7.4pt. Kurashiki (16 properties, 1,973 rooms) was 88.3% vs 84.0%, +4.3pt; Oita (12 properties, 1,606 rooms) 88.4% vs 87.2%, +1.2pt; and Ichihara, Sakai and Kamisu +0.9 to +1.6pt — in all six industrial cities where occupancy could be estimated, Tuesday–Thursday beat Saturday. By contrast, Kyoto (Shimogyo Ward; 70 business hotels, 7,858 rooms) was 83.5% Tuesday–Thursday against 88.0% on Saturday, −4.5pt; Kanazawa (56 properties, 8,063 rooms) 83.8% vs 89.8%, −6.0pt; and Beppu (13 properties, 1,166 rooms) 76.4% vs 86.8%, −10.4pt — Saturday is higher in all three tourism cities. Sunday is the low point of the week everywhere, but Sundays in industrial cities (65.7–75.9%) are slightly lower than in tourism cities (72.9–78.4%), indicating that industrial-city demand is of the business-trip and construction type: “stay Monday to Thursday, go home Friday.” Breaking down business hotels across Kyoto Prefecture by day of week also shows the last three days of the week running level; for details, see Kyoto Day-of-Week OCC: Thursday Edges Friday.
Figure 4. Estimated occupancy by day of week (Tue–Thu average, Saturday, Sunday; 10 June–30 September 2026). * = all hotel types. Source: MetroEngines Research; compiled by HotelBank Editorial Team.
| City | Hotel type | Coverage | Tue–Thu | Sat | Sun | Tue–Thu minus Sat | Days observed |
|---|---|---|---|---|---|---|---|
| Yokkaichi | Business | 11 properties / 1,307 rooms | 92.5% | 85.1% | 75.9% | +7.4pt | 113 days |
| Ichihara | All types* | 15 properties / 732 rooms | 87.4% | 86.3% | 65.7% | +1.1pt | 96 days |
| Oita | Business | 12 properties / 1,606 rooms | 88.4% | 87.2% | 70.9% | +1.2pt | 113 days |
| Sakai (Sakai Ward) | All types* | 13 properties / 1,818 rooms | 82.8% | 81.9% | 73.9% | +0.9pt | 93 days |
| Kurashiki | Business | 16 properties / 1,973 rooms | 88.3% | 84.0% | 69.3% | +4.3pt | 113 days |
| Kamisu | All types* | 12 properties / 1,026 rooms | 82.9% | 81.3% | 67.6% | +1.6pt | 48 days |
| Kyoto (Shimogyo Ward) | Business | 70 properties / 7,858 rooms | 83.5% | 88.0% | 78.4% | -4.5pt | 113 days |
| Kanazawa | Business | 56 properties / 8,063 rooms | 83.8% | 89.8% | 75.0% | -6.0pt | 113 days |
| Beppu | Business | 13 properties / 1,166 rooms | 76.4% | 86.8% | 72.9% | -10.4pt | 112 days |
Table 3. Source: MetroEngines Research; compiled by HotelBank Editorial Team. Occupancy is an estimate based on OTA-listed inventory (listings on major booking sites) and differs from actual overall occupancy. *All hotel types substituted because business hotels alone did not meet the aggregation threshold. Kamisu covers 48 days from 3 July 2026.
Business hotels in tourism cities fill up on Saturdays because leisure guests stay at weekends; business hotels in industrial cities fill up Tuesday–Thursday because business travelers and construction crews commuting to plants and factories stay on weekdays. These two kinds of demand are in opposite phase on the day-of-week axis, so even within the same “business hotel” box, demand comes from different places. The pattern in monthly rate curves — tourism cities peaking in autumn–winter, industrial cities flat regardless of season — is an extension of this day-of-week structure.
Are Plant Turnarounds Concentrated in Spring and Autumn? What Primary Sources Confirm, and What Remains a Hypothesis
An element often cited in the industry as underpinning weekday demand in industrial cities is the plant turnaround (scheduled maintenance shutdown, or SDM). We checked how far this practice is backed up by public documents. As the legal framework, Article 35(1) of the High Pressure Gas Safety Act requires high-pressure gas producers to undergo a safety inspection by the prefectural governor once a year, while certified safety-inspection operators (certified facilities) may inspect themselves and submit records (Fire and Disaster Management Agency study-group material, “Overview of Certified Facility Systems under Other Laws”). For ethylene plants, a November 2018 article in the Nikkan Kogyo Shimbun (Newswitch) reported that turnarounds at the Mizushima ethylene units of Mitsubishi Chemical and Asahi Kasei are required “by law once every four years,” and that an extraordinary repair would be carried out from 22 May to 25 June 2019 to coincide with turnarounds at derivative plants. In an August 2025 interview, Mitsubishi Chemical Group said some large plants undergo turnarounds every two years lasting about two months, mobilizing close to 4,000 workers a day at peak, and that it shortened the FY2024 turnaround at its Ibaraki (Kashima) site by nine days.
On timing, the individual cases we could confirm skew toward spring. Mitsui Chemicals said in a 13 May 2011 release that the statutory turnaround at its Kashima Works (Kamisu City) had been scheduled for “mid-May to late June”; the Mizushima extraordinary repair also ran from late May to late June, and Mitsubishi Chemical’s Ibaraki Plant scheduled maintenance in 2022 ran from May to August. Among refineries, Idemitsu Kosan indicated in its February 2026 earnings presentation that it plans to shut the atmospheric distillation unit at its Keihin Refinery (Kawasaki) for a major turnaround during FY2026, and that a small-scale turnaround is also planned at its Yokkaichi Refinery in FY2026 (Hydrocarbon Processing, 10 February 2026). In November 2025, the Hokkaido Shimbun reported that Idemitsu Kosan’s Hokkaido Refinery would revise the schedule of its once-every-four-years major shutdown maintenance (SDM) planned for 2028, bringing some work forward to ease the concentration of workers, citing concern that with several large projects overlapping in Tomakomai, lodging capacity for workers would be limited. This is a case of an operator acknowledging that turnarounds directly move local lodging demand.
On the other hand, the claim that turnarounds “also concentrate in autumn” is thinly supported by individual cases in the primary sources we could confirm. There is overseas reporting that a turnaround at Cosmo Oil’s Yokkaichi Refinery in the 2010s ran until mid-November, but we found no published statistics showing the annual distribution across the industry. This article therefore concludes: “A tendency for turnarounds to concentrate in spring (May–June) can be confirmed in public documents from multiple operators; the idea of a second peak in autumn remains a hypothesis.” Note that Japan’s ethylene plant utilization rate stood at 67% in April 2026, the lowest since statistics began (Newswitch reporting of Japan Petrochemical Industry Association data), so production itself is contracting. Even so, safety inspections and turnarounds are carried out according to law and equipment life, and the defining feature of lodging demand in industrial cities is that construction demand on 2–4-year cycles arises on a logic separate from rises and falls in production volume.
Overlaying this hypothesis on our data, Kamisu’s peaks in May 2025 and June 2026, Sakai’s high level in May–June 2025 (hard to separate because it overlaps with the Expo period) and Kurashiki’s May 2025 (about ¥9,200) all fall in May–June. Oita and Ichihara, however, show no peak in the same period, and Yokkaichi’s peak coincides with F1. We cannot say that the spring concentration of turnarounds lifts industrial-city ADR across the board; the reasonable reading is that “in any given city, weekday rates rise in May–June if a plant there faces a turnaround that year.”
Implications for Operations and Investment — The Stability of Locations with Opposite-Phase Demand
To sum up, business hotels in industrial-cluster cities have three characteristics: first, the annual rate curve is flat (median peak/trough ratio 1.37×, median coefficient of variation 9.3%); second, occupancy peaks Tuesday–Thursday; and third, the peak month differs from city to city. These run almost in opposite phase to the tourism-led structure of “high in autumn–winter, low in the rainy season, full on Saturdays.” In terms of rate level, the 12-month averages of the seven industrial cities are about ¥5,600–¥7,600, below Kyoto (Shimogyo Ward) at about ¥14,700 and Kanazawa at about ¥9,000. The value of industrial cities therefore lies not in high rates but in small income swings on both a monthly and day-of-week basis, and in the offsetting effect when combined with tourism cities.
Operationally, in a city like Yokkaichi where Tuesday–Thursday fills to around 90%, the core of revenue is selling weekday inventory while holding rate. In September 2026, Yokkaichi saw high Tuesday–Thursday occupancy and a +31.1% YoY ADR at the same time, showing room to convert strong weekday demand into rate. Multi-night and long stays by construction crews lock in inventory across days of the week, supporting monthly occupancy even in locations with thin weekend tourism demand. Conversely, the drop in weekend occupancy means there is still room to grow through weekend leisure pricing and tie-ins with nearby tourism.
From an investment perspective, lodging rates in tourist destinations react readily to exchange rates and inbound visitor numbers, whereas weekday demand in industrial cities is tied to domestic equipment-maintenance cycles. Because it rests on laws and practices — annual safety inspections and major turnarounds every 2–4 years — it forms a floor of demand that is less exposed to short-term business conditions. Including several industrial cities in one portfolio disperses peak months, as shown in this article, so monthly income can be expected to be smoother than in a portfolio of tourism properties alone. Plant consolidation is, of course, a long-term supply-side variable, and as falling ethylene utilization shows, the restructuring of production sites continues. In that sense, when assessing lodging demand in an industrial city, it makes more sense, in light of this article’s data, to ask “will maintenance, renewal and new-build construction continue in this area over the next 10 years?” than to look at the production outlook.
Summary
For business hotels in the seven industrial-complex cities, the estimated settled ADR peak/trough ratio for October 2025–September 2026 had a median of 1.37×, a shallower trough than Kyoto (Shimogyo Ward) at 2.28×, and the coefficient of variation was only about one-third of Kyoto’s. In estimated occupancy by day of week for June–September 2026, Tuesday–Thursday exceeded Saturday in all six industrial cities where occupancy could be estimated, while Saturday was higher in all three tourism cities — an opposite-phase pattern. The spring (May–June) concentration of turnarounds is backed by public documents from multiple operators, while an autumn concentration remains a hypothesis. The value of lodging demand in industrial cities lies not in high rates but in the monthly and day-of-week stability that comes from weekday demand inversely correlated with tourism, and in peak months that scatter across cities; it can be valued as a smoothing element in a portfolio combined with tourism properties.
For hotels: plan-name tips for this theme
Most common selling points in published business-hotel plan names aimed at business travelers (N=737) —
Business 54%Breakfast included 49%Multi-night discount 49%Room only 33%Eco 17%Discount 13%
Actual name examples (anonymized, English rendering with Japanese original):
- [30-day early-bird discount] Save on 2+ nights ◆ Eco stay ◆ Free breakfast buffet (【30日前早期割引】2連泊以上でお得◆エコステイ◆朝食ビュッフェ無料)
- [2-night discount ◆ Breakfast included] Eco stay ◆ Japanese breakfast buffet ◆ Free parking (【2連泊割引◆朝食付】エコステイ◆和食ビュッフェ朝食◆駐車場無料)
- [4-night discount ◆ Breakfast included] Eco stay ◆ Japanese breakfast buffet ◆ Free parking (【4連泊割引◆朝食付】エコステイ◆和食ビュッフェ朝食◆駐車場無料)
*Trends based on aggregated published plan names; they do not show that naming causes sales. In industrial cities with many multi-night construction stays, pairing a multi-night discount with an eco plan (housekeeping skipped) suits long weekday stays.
Frequently Asked Questions
Q. How stable are business-hotel rates in industrial cities compared with tourism cities?
A. Based on business-hotel estimated settled ADR for October 2025–September 2026, the monthly peak/trough ratio was a median of 1.37× across the seven industrial-complex cities and 2.28× for Kyoto (Shimogyo Ward). The coefficient of variation was also a median of 9.3% for the industrial cities versus 30.8% for Kyoto. Some cities, however, such as Yokkaichi (1.63×) and Kamisu (1.87×), show spike months driven by events or construction timing, so not every industrial city is flat.
Q. Which days of the week do hotels in industrial cities fill up?
A. In day-of-week estimates for 10 June–30 September 2026 (based on OTA-listed inventory, which differs from actual overall occupancy), Tuesday–Thursday exceeded Saturday in all six industrial cities where occupancy could be estimated. Yokkaichi averaged 92.5% Tuesday–Thursday against 85.1% on Saturday. In the three tourism cities — Kyoto (Shimogyo Ward), Kanazawa and Beppu — Saturday was higher in every case, and Sunday is the low point of the week in every city.
Q. Are plant turnarounds concentrated in spring and autumn?
A. Cases carried out in spring (May–June) can be confirmed in public documents and reporting from multiple operators. The idea of an autumn peak, however, is thinly supported by individual cases in the primary sources we could confirm and remains a hypothesis. Because safety inspections are annual and major turnarounds run on 2–4-year cycles, the reasonable reading is that weekday hotel rates rise in cities with a plant facing a turnaround that year.
Related Articles
References and Sources
■ Data sources
Estimated settled ADR for business hotels compiled by MetroEngines Research (municipality × hotel type, closed months from October 2024 to September 2026; N = 13–116 properties per city as in Table 1), and estimated occupancy by day of week (based on OTA-listed inventory, daily values for 10 June–30 September 2026). Turnaround timing and cycles are based on companies’ public documents and press reports.
■ Calculation assumptions
Peak/trough ratios and coefficients of variation are calculated over the 12 months from October 2025 to September 2026. Sakai City is aggregated as Sakai Ward and Kyoto City as Shimogyo Ward; the “seven industrial cities” and “three tourism cities” values are the medians of city-level ADR for each month. The day-of-week comparison contrasts the Tuesday–Thursday average with Saturday and Sunday; Ichihara, Sakai (Sakai Ward) and Kamisu use all-type estimates, and Shunan is excluded.
■ Limitations
Both ADR and occupancy are estimates and differ from each property’s actual transaction prices and actual occupancy. Cities covering 13–18 properties are sensitive to price changes at individual properties, and Kamisu’s day-of-week estimate rests on only 48 days of observation. Sakai (Sakai Ward) includes the effect of Expo 2025 Osaka, Kansai and Yokkaichi the effect of the F1 Japanese Grand Prix; the autumn concentration of turnarounds is a hypothesis.
- MetroEngines Research — Business-hotel estimated settled ADR (municipality × hotel type, October 2024–September 2026); estimated occupancy (based on OTA-listed inventory, 10 June–30 September 2026)
- Fire and Disaster Management Agency, study-group material 1-5, “Overview of Certified Facility Systems under Other Laws” (safety inspections under Article 35 of the High Pressure Gas Safety Act and the certified safety-inspection operator system) (Japanese)
- Newswitch (Nikkan Kogyo Shimbun), “Mitsubishi Chemical and Asahi Kasei to halt ethylene unit for one month” (21 November 2018) (Japanese)
- Business Journal, “Large-plant turnarounds can’t be done because workers are hard to secure” — why Mitsubishi Chemical Group is offering its in-house system to industry peers (8 August 2025) (Japanese)
- Mitsui Chemicals, “Impact of the Great East Japan Earthquake on Our Group (6th report)” (13 May 2011; statutory turnaround at Kashima Works, mid-May to late June) (Japanese)
- Hitachi Solutions case study (Mitsubishi Chemical Ibaraki Plant scheduled maintenance, May–August 2022) (Japanese)
- Hydrocarbon Processing, “Idemitsu Kosan plans maintenance at Keihin refinery in April” (10 February 2026)
- Hokkaido Shimbun, “Idemitsu refinery revises schedule for major maintenance” (6 November 2025) (Japanese)
- Newswitch, reporting on ethylene utilization (67% in April 2026, Japan Petrochemical Industry Association data) (Japanese)
- Kanko Mie, “2026 FIA Formula One World Championship Japanese Grand Prix” (27–29 March 2026, Suzuka Circuit) (Japanese)
- Japan Tourism Agency, “Overnight Travel Statistics Survey” (Japanese)
- JNTO, “Visitor Arrivals Statistics”