

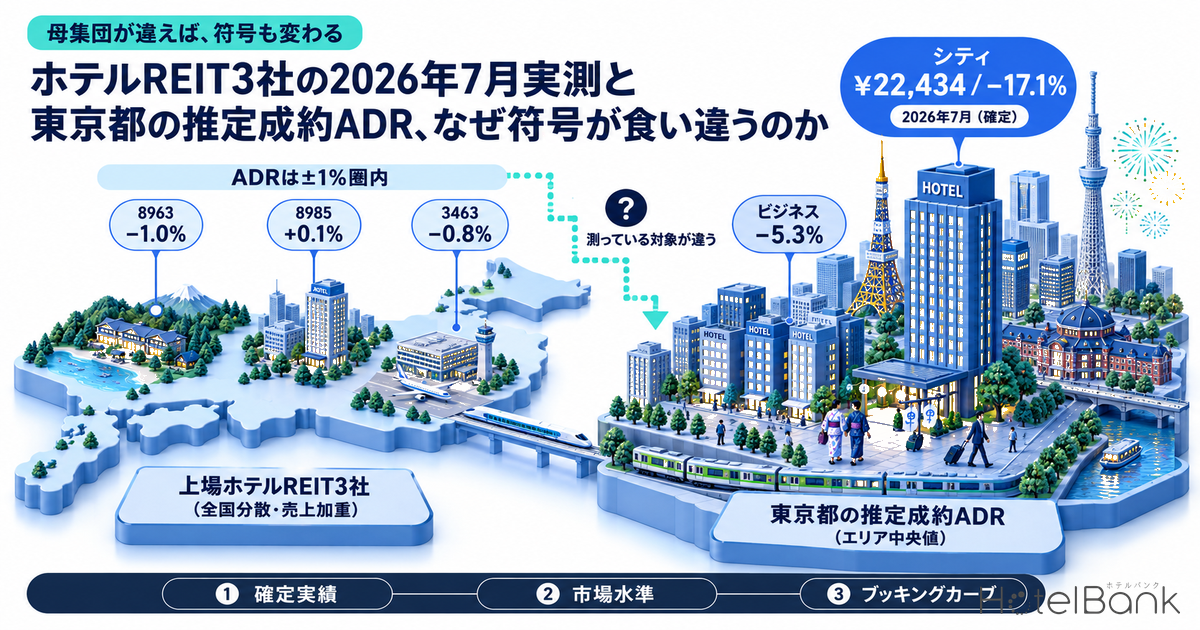
The July 2026 operating results published by three listed hotel REITs showed ADR (average daily rate) essentially flat. Invincible Investment Corporation (8963) reported ¥15,100, −1.0% year on year; Japan Hotel REIT Investment Corporation (8985) reported ¥21,806, +0.1%; and Ichigo Hotel REIT Investment Corporation (3463) reported ¥9,684, −0.8%. All three sit within ±1%. Yet for the same month of July 2026, our own estimated settled ADR for Tokyo showed a clear decline, including a double-digit drop: ¥22,434 for city hotels (N=107 properties, −17.1% YoY) and ¥12,306 for business hotels (N=913 properties, −5.3% YoY). Same month, same domestic hotel market — and yet neither the sign nor the sense of magnitude lines up. This article uses the data to show that the discrepancy is not a case of “one side being wrong” but the result of placing side by side two metrics built on different populations, and then works through how to use each of these two metric types in your own hotel’s revenue management (RM).
Scope: city hotels (N=107 properties) and business hotels (N=913 properties) in Tokyo. The price metric in this article is estimated settled ADR (the settled price level estimated from OTA and other sales data, tax-exclusive equivalent); occupancy is an estimate based on OTA-listed inventory. Both are defined at the end of the article. REIT figures are quoted from each company’s published materials; we do not recalculate or rank them. Data as of: September 21, 2026.
- — ADR at the three REITs stayed within ±1% — In July 2026, 8963 was −1.0%, 8985 +0.1% and 3463 −0.8%. For all three, the change in RevPAR was driven by occupancy.
- — Tokyo’s estimated settled ADR fell — Final figures for the same July 2026: city hotels ¥22,434 (N=107 properties, −17.1% YoY), business hotels ¥12,306 (N=913 properties, −5.3% YoY).
- — The discrepancy comes down to the population — Nationally diversified, revenue-weighted REIT disclosures versus an area median for Tokyo. They differ on four points: geography, representative value, property set and prior-year base.
- — Shift the base year and the picture changes — Against July 2024, city hotels were −3.5% and business hotels +4.6%. But city hotels were −10.3% even against 2024 in August, so some months can no longer be explained by a rebound effect alone.
- — The leading layer has a different center of gravity by category — On the curve for Saturday, October 3, 2026, city hotels gained +15.0pt and business hotels +23.4pt between 45 and 13 days out, with business hotels filling closer to the stay date.
Published July 2026 Results — The Three REITs’ Disclosures Side by Side
First, the unprocessed published figures. The table below shows the monthly operating results for July 2026 that each company disclosed in August 2026. We have transcribed the published numbers as-is, with no rounding or recalculation. The three REITs differ in portfolio composition and disclosure scope, so they are not placed together to compare one against another. They are material for reading “how the listed REITs — a population that discloses actual operating results monthly — recorded July 2026.”
| Ticker / Investment Corporation | Occupancy | ADR | RevPAR | Disclosure Scope |
|---|---|---|---|---|
| 8963 Invincible Investment Corporation | 86.3% Prior year 84.5% (+1.9pt) |
¥15,100 Prior year ¥15,257 (−1.0%) |
¥13,039 Prior year ¥12,888 (+1.2%) |
101 domestic hotels |
| 8985 Japan Hotel REIT Investment Corporation | 83.1% (+4.0pt) |
¥21,806 (+0.1%) |
¥18,119 (+5.1%) |
29 hotels with variable rent, etc. |
| 3463 Ichigo Hotel REIT Investment Corporation | 84.4% Prior year 85.1% (−0.7pt) |
¥9,684 Prior year ¥9,761 (−0.8%) |
¥8,175 Prior year ¥8,305 (−1.6%) |
Entire portfolio |
Source: Each investment corporation’s July 2026 monthly operating results disclosure (URLs listed at the end of the article). Figures quoted as published.
What the three share is a pattern in which ADR stopped within ±1% and the movement in RevPAR was created by occupancy. At 8963, ADR fell 1.0% but occupancy rose 1.9pt, lifting RevPAR by 1.2%; at 8985, ADR was essentially flat at +0.1% and a 4.0pt rise in occupancy produced RevPAR growth of 5.1%. At 3463, occupancy of −0.7pt and ADR of −0.8% combined to pull RevPAR down a modest 1.6%. All three point the same way: this is not a phase of growing by raising rates, but one of holding rates and filling rooms.
The key point here is disclosure scope. 8963 covers 101 domestic hotels, 8985 covers 29 hotels with variable rent and similar arrangements, and 3463 covers its entire portfolio — none of them are Tokyo-only figures. These are nationally diversified portfolios that include major regional cities and resort locations, and whenever properties are acquired, sold or rebranded, the set of properties behind the same “year-on-year” figure changes. Because the aggregation is close to revenue-weighted, properties with more rooms or higher rates also carry relatively more weight — a point that matters in the comparison later on.
How Tokyo Looked in the Same July 2026
Next, our own metrics. The estimated settled ADR for Tokyo city hotels was ¥22,434 (N=107 properties) on a final basis for July 2026, −17.1% against ¥27,055 (N=107 properties) in the same month a year earlier. Business hotels came in at ¥12,306 (N=913 properties), −5.3% against ¥12,990 (N=902 properties) a year earlier. Both are comparisons of final figures for past months; no estimate is compared against a final figure.
The chart below overlays the estimated settled ADR of Tokyo city hotels by year, with three lines — 2024, 2025 and 2026 — on the same January–December axis. It clearly shows the 2025 line running well above 2024 throughout the year and forming a peak of ¥31,970–¥32,756 in October–November, and the 2026 line tracking that level until early spring and then peeling away from 2025 from May onward.
Source: Compiled by MetroEngines Research and the HotelBank Editorial Team
Lining up the monthly YoY changes makes the timing of the divergence even clearer. City hotels posted double-digit growth — +16.4% in July 2025 and +19.8% in November 2025 — before growth narrowed to +4.0% in February 2026 and +0.5% in April, turned negative at −3.8% in May, and then widened to −12.8% in June, −17.1% in July and −20.6% in August. Business hotels followed the same sequence: after peaking at +15.0% in October 2025, they stayed positive through +5.7% in May 2026, turned at −4.7% in June, and came in at −5.3% in July and −8.9% in August. The reversal happened in May–June 2026; nothing suddenly happened in July alone.
| Stay Month | City: Est. Settled ADR | YoY | Business: Est. Settled ADR | YoY |
|---|---|---|---|---|
| Mar 2026 (final) | ¥30,282 / N=107 | +5.8% | ¥15,670 / N=924 | +2.9% |
| Apr 2026 (final) | ¥31,241 / N=107 | +0.5% | ¥17,802 / N=923 | +3.9% |
| May 2026 (final) | ¥26,298 / N=107 | −3.8% | ¥14,890 / N=923 | +5.7% |
| Jun 2026 (final) | ¥22,195 / N=108 | −12.8% | ¥11,890 / N=915 | −4.7% |
| Jul 2026 (final) | ¥22,434 / N=107 | −17.1% | ¥12,306 / N=913 | −5.3% |
| Aug 2026 (final) | ¥21,265 / N=109 | −20.6% | ¥11,554 / N=915 | −8.9% |
| Oct 2026 (current estimate) | ¥33,327 / N=107 | — | ¥18,813 / N=897 | — |
| Nov 2026 (current estimate) | ¥32,243 / N=107 | — | ¥18,388 / N=885 | — |
Source: Compiled by MetroEngines Research and the HotelBank Editorial Team
*October and November 2026 are estimates based on current sales and will change with future sales. A straightforward comparison with final figures must wait until the month closes, so no YoY change is shown.
While rates are falling, sell-through itself has not loosened. Tokyo’s estimated OCC for July 2026 (based on OTA-listed inventory) averaged 89.5% for city hotels (cohort of 52–54 properties, about 17,294 rooms) and 91.7% for business hotels (cohort of 524–536 properties, about 77,917 rooms). Averaged by day of week, as in the table below, Saturday was highest and Monday lowest in both categories. The single highest day was Saturday, July 4, at 97.4% for city hotels and 96.8% for business hotels. The low for business hotels was 81.9% on Monday, July 20 (a public holiday), when city hotels stood at 83.5% (the city-hotel low for the month was 81.2% on Monday, July 6). Sunday, July 19 — the middle day of the three-day weekend — was high at 92.3% for city hotels, while the Monday that closed the holiday fell sharply, a typical long-weekend pattern.
| Day of Week (Jul 2026) | Mon | Tue | Wed | Thu | Fri | Sat | Sun |
|---|---|---|---|---|---|---|---|
| City: Est. OCC | 84.5% | 88.5% | 89.4% | 90.0% | 90.1% | 95.7% | 87.8% |
| Business: Est. OCC | 87.1% | 91.8% | 92.7% | 94.0% | 91.4% | 94.9% | 89.0% |
Source: Compiled by MetroEngines Research and the HotelBank Editorial Team
*Estimated OCC (based on OTA-listed inventory) is defined differently from actual room occupancy. Its level cannot be compared directly with occupancy published by the REITs.
Why the Signs Diverge: Not “Which Is Right,” but the Population
Put the July 2026 ADR YoY changes side by side and the gap is obvious at a glance. The three REITs fall within a range of −1.0% to +0.1%, while Tokyo business hotels are at −5.3% and Tokyo city hotels at −17.1%. Reading this gap of more than 15 points as “one of the measurements is off” leads to wrong RM decisions.
REIT figures are as published; the two Tokyo series are our own aggregation. Source: Investment corporation disclosures / Compiled by MetroEngines Research and the HotelBank Editorial Team
Four main factors create the gap.
First, the geographic population differs. All three REITs hold nationally diversified portfolios, and their figures are not limited to Tokyo; they include properties in regional cities and resort locations. Our metric is aggregated for a single metropolitan area, Tokyo, so it directly reflects Tokyo-specific supply and demand — above all, new supply and competition in the mid-price zone. A flat national average and a decline in a specific metropolitan area are not contradictory.
Second, the representative value differs. A REIT’s disclosed ADR is room revenue divided by rooms sold — effectively a revenue-weighted average — so properties with more rooms or higher rates have a large influence. Our estimated settled ADR is the median of property-level estimates within the area and captures the movement of properties in the middle of the price range. If the high-rate segment is firm but the mid-range is breaking down, the median turns down first. The reverse is also true: the two structurally move differently.
Third, the stability of the property set differs. A REIT’s portfolio composition changes through acquisitions, sales and rebrands. If the share of luxury properties rises, portfolio ADR rises even if no individual property’s price moves. Our Tokyo city-hotel set is stable in size at N=107 properties (also N=107 properties in the same month a year earlier), so the upward or downward push from turnover in the property set is relatively small.
Fourth, the prior-year base differs. Tokyo’s −17.1% comes after the prior year, July 2025, recorded strong growth of +16.4%. Shift the base by one year and compare with July 2024, and Tokyo city hotels’ ¥22,434 in July 2026 is −3.5% against ¥23,253 in July 2024, while business hotels’ ¥12,306 is +4.6% against ¥11,768 in July 2024. Much of the double-digit decline is a rebound from the high base built up in 2025. Because the three REITs are nationally diversified and revenue-weighted, the 2025 peak affects them differently, and the rebound is less likely to surface.
How YoY Changes Move with the Base Year — Sensitivity for March–August 2026
To see how much the fourth factor matters, we check along two axes: month and base year. The table below compares estimated settled ADR (final figures) for March–August 2026 against two bases: the same month in 2025 and the same month in 2024.
| Stay Month | City vs 2025 | City vs 2024 | Business vs 2025 | Business vs 2024 |
|---|---|---|---|---|
| Mar 2026 | +5.8% | +15.8% | +2.9% | +18.0% |
| Apr 2026 | +0.5% | +17.4% | +3.9% | +27.7% |
| May 2026 | −3.8% | +7.1% | +5.7% | +22.0% |
| Jun 2026 | −12.8% | −3.7% | −4.7% | +1.0% |
| Jul 2026 | −17.1% | −3.5% | −5.3% | +4.6% |
| Aug 2026 | −20.6% | −10.3% | −8.9% | −3.1% |
Source: Compiled by MetroEngines Research and the HotelBank Editorial Team
For business hotels, even in June–August — when the comparison with 2025 turned negative — the changes against 2024 were small at +1.0%, +4.6% and −3.1%. Most of the decline can be read as a rebound from the high 2025 base. City hotels look different. Even against 2024 they stayed negative at −3.7% in June, −3.5% in July and −10.3% in August, and in August a double-digit decline remains even after shifting the base year. Through July the rebound explains the numbers, but August city hotels cannot be explained by the rebound alone. Final figures from September onward will need to be tracked to see whether this gap widens or closes.
In other words, the two did not “measure the same thing and get split results” — what they measure is itself different. REIT disclosures are confirmed results of actual operations and come out monthly with a lag. Our metric estimates the settled price level from how inventory on the market is selling, and can track the mid-range by area × category. The former serves as an “answer check,” the latter as a “map of the competitive environment your hotel is in” — they play different roles.
The Third Layer — Booking Curves as a Leading Indicator
In RM practice, on top of confirmed results (REIT disclosures) and market levels for closed months (estimated settled ADR), you need one more layer that leads further: how inventory is absorbed toward the stay date — the booking curve. The chart below shows Tokyo’s curve for a stay date of Saturday, October 3, 2026, with city and business hotels overlaid. The horizontal axis is days remaining until the stay date.
Source: Compiled by MetroEngines Research and the HotelBank Editorial Team
City hotels (53 properties, 16,464 rooms) stood at 79.7% 45 days out, 87.5% 30 days out and 94.7% at the latest point, 13 days out. The gain from 45 days out to the latest point was +15.0pt, split almost evenly between the first half (45→30 days out, +7.8pt) and the second half (30→13 days out, +7.2pt). Business hotels (553 properties, 80,405 rooms), by contrast, were at 60.1% 45 days out, 69.6% 30 days out and 83.5% 13 days out, a gain of +23.4pt, of which +13.9pt came in the second half — the center of gravity is closer to the stay date. Even for the same stay date, the shape of “when rooms fill” differs by category, and this one chart shows it.
For comparison, Saturday, October 17 in the same month stood at 88.9% for city hotels and 75.3% for business hotels 27 days out. At the same lead time (27 days out), October 3 was at 89.2% for city hotels and 72.4% for business hotels. Business hotels are about 3pt higher for the 17th at the same lead time. This kind of “difference in position at the same lead time” indicates the difference in depth of demand between dates. Note that these are estimates based on listed inventory and will change with future sales.
For Revenue Managers of City and Business Hotels in Tokyo — Implications and Action Plan
(a) Operational Insights
1. Don’t adopt “the market is flat” from other companies’ data as your own benchmark. The three REITs’ July 2026 ADR ranged from −1.0% to +0.1%, but that is a revenue-weighted figure for nationally diversified portfolios. If a hotel positioned in Tokyo’s mid-price range reads that number as “my market is flat too,” it risks holding rates in an environment that was actually −17.1% for Tokyo city hotels and −5.3% for business hotels, and ending up stranded at a relatively high position. Conversely, if your hotel belongs to a high-rate, corporate-heavy portfolio, there is no need to apply the median-based decline directly to your own hotel either. Deciding first which population your hotel is closer to is the starting point.
2. Don’t judge on YoY alone — make a two-year comparison standard. Tokyo city hotels in July 2026 were −17.1% YoY but −3.5% against July 2024; business hotels were −5.3% YoY but +4.6% against July 2024. Unless you separate out the rebound from the high base built up in 2025, you cannot tell whether the market is “breaking down” or “normalizing.” For your own ADR and RevPAR as well, make it standard practice to always show YoY and two-year comparisons together.
3. Read correctly the combination of falling rates and occupancy that has not loosened. Tokyo’s estimated OCC for July 2026 stayed high at 89.5% for city hotels and 91.7% for business hotels. For the three REITs, too, the driver lifting RevPAR was occupancy. Rather than a phase of “you can’t sell without cutting prices,” this suggests a state in which rooms fill first in a phase where raising rates is difficult. For dates where occupancy fills early at high levels, it is worth testing whether upside remains on price.
4. Reflect day-of-week and holiday patterns in your pricing calendar. In July 2026, Saturday was the highest day in Tokyo for both categories (city 95.7%, business 94.9%) and Monday the lowest (city 84.5%, business 87.1%). The very lowest was Monday, July 20 (public holiday), at 81.9% for business hotels. A weekday holiday at the end of a long weekend tends to be thin on both leisure demand and weekday business-travel demand, so designing it as a separate tier in advance is worth considering.
5. The center of gravity of the curve differs by category. On the curve for Saturday, October 3, city hotels gained evenly (+7.8pt from 45→30 days out and +7.2pt from 30→13 days out), while business hotels gained +13.9pt in the second half, closer to the stay date. How long you keep inventory open and when you close it should be designed according to the center of gravity of your category.
(b) Action Plan
| Time Horizon | Action | Decision Trigger | Goal |
|---|---|---|---|
| Today to this week | Line up your July actual ADR against Tokyo’s final figures (city ¥22,434 / business ¥12,306), on the same tax basis | If your July ADR diverges sharply from the market level for your category, determine whether that is due to location and product strength or to lagging price setting | Pin down which population your hotel is closer to |
| Today to this week | Add a permanent “vs two years ago” column to the monthly report, shown alongside YoY | If YoY is negative but the two-year comparison is positive (as with business hotels at +4.6%), treat it as a base-year rebound rather than a decline | Prevent overreaction to base-year distortion |
| Within two weeks | Overlay your daily booking pace for October against the market curve on a days-remaining axis | Identify dates where your pace 30 days out is clearly behind the market (for October 3: city 87.5%, business 69.6%) | Concentrate measures only on the dates that are behind |
| Within two weeks | Review price tiers by day of week and by holiday | If your Monday and post-long-weekend holiday rates sit in the same tier as Saturday, split the tiers along July’s day-of-week gap (city: Sat 95.7% vs Mon 84.5%) | Eliminate both lost sales on thin-demand days and underpricing on strong days |
| Toward next month | Check your October and November rates against the market’s current estimates | If your October rates remain well below the market’s current estimate (city ¥33,327 / business ¥18,813), test whether you are leaving rate on the table in the busy autumn months | Avoid missed revenue in the high-rate months before year-end |
| Toward next month | Build each REIT’s monthly disclosures into the post-hoc review of your forecasts | For months where actuals missed your forecast, check whether the direction is consistent with REIT-disclosed ADR and occupancy (July: flat ADR, occupancy-led) | Break down forecasting bias into “market factors” and “own-hotel factors” |
*The above is material for considering opportunities and does not guarantee results. Suitability depends on your hotel’s product and channel mix.
Summary — Viewing the Market in Three Layers
The yardsticks to take away from the July 2026 cross-check can be organized into three points.
(1) Use the confirmed-results layer (REIT disclosures) as an “answer check.” These are the results of actual operations, published monthly with a lag. In July 2026, ADR at all three REITs stayed within ±1% (8963 −1.0%, 8985 +0.1%, 3463 −0.8%), and the movement in RevPAR was driven by occupancy. But because they are nationally diversified and revenue-weighted, they do not describe your hotel’s location.
(2) Use the market-level layer (estimated settled ADR) for “positioning within your price range.” Tokyo’s final figures were city ¥22,434 (−17.1%) and business ¥12,306 (−5.3%). Because it is based on area medians, it is sensitive to movement in the mid-price range and includes a rebound from the high prior-year base. Read it together with the two-year comparison (city −3.5%, business +4.6%).
(3) Use the leading layer (booking curves) to identify “the dates you can still move.” For Saturday, October 3, city hotels gained +15.0pt and business hotels +23.4pt between 45 days out and the latest point 13 days out, with the center of gravity differing by category. This is the only layer where you can still take action.
When the signs diverge, the question to ask is not “which one is right” but “which population is my hotel closer to?” If you operate closer to a nationally diversified, high-rate profile, the flat reading in (1) will match your experience; if you compete in Tokyo’s mid-price range, the decline in (2) is your competitive environment itself. Put the two side by side, then decide your actions using (3). Fix this order, and you will not be swayed by other companies’ numbers as they come out each month.
Frequently Asked Questions
Why doesn’t the ADR published by the REITs match estimated settled ADR?
Because the populations are designed differently. The three REITs’ disclosed figures are close to a revenue-weighted average: room revenue of nationally diversified portfolios divided by rooms sold. The estimated settled ADR in this article is the median of property-level estimates limited to Tokyo, capturing the movement of properties in the middle of the price range. Because they differ on four points — geography, representative value, property set and prior-year base — their signs may not line up even for the same month.
Does the −17.1% YoY for Tokyo city hotels mean the market is collapsing?
Not necessarily. July 2025 was a month of strong growth, +16.4% YoY, and compared with July 2024, July 2026 is only −3.5%. However, August 2026 was −10.3% even against 2024, so some months can no longer be explained by a rebound from the high base alone. We recommend reading YoY and the two-year comparison together.
Can estimated OCC be compared with the occupancy the REITs publish?
Not directly at the level of the figures. Estimated OCC is an estimate calculated from the absorption of OTA-listed inventory; because it counts unlisted rooms as sold, it comes out higher than actual room occupancy. If you compare, use it for relative movements within the same metric, such as differences between days of the week or rankings within a month.
How accurate is estimated settled ADR?
Checked against published operating results, the median error is 6.6%. Past months are final figures; the current month onward are estimates based on current sales and will change with future sales.
For my own hotel’s pricing decisions, which number should I use as the benchmark?
Decide based on which population your hotel is closer to. If you operate closer to a nationally diversified, high-rate profile, the flat REIT disclosures will be closer to your experience; if you compete in Tokyo’s mid-price range, the decline in estimated settled ADR is your competitive environment. The practical order is to put both side by side and then use booking curves to identify the dates where you can take action.
About the Data
- Definition of estimated OCC (based on OTA-listed inventory): OTA-listed-inventory occupancy = 100 − 100 × OTA-listed rooms remaining ÷ total rooms. Covers a fixed cohort of properties that list at least 30% of their total rooms on OTAs (the same set of properties for each stay date). It is an estimate based on the absorption of inventory sold on OTAs and is defined differently from actual room occupancy (it counts unlisted rooms as sold, so it comes out higher). The periods covered in this article are July 2026 (Tokyo, city/business) and pace snapshots for stay dates of October 3 and October 17, 2026.
- Booking curves: Based on observations from 45 days before the stay date up to the latest point. Covers 53 Tokyo city hotels (16,464 rooms) and 553 Tokyo business hotels (80,405 rooms) (based on listings on major booking sites, for stays on October 3, 2026).
- Definition of estimated settled ADR: The settled price level (tax-exclusive equivalent) estimated from OTA and other sales data (lowest-plan level × segment-specific factor, ensemble of multiple channels). Past months are final figures; current and future months are estimates based on current sales. Median error of 6.6% when checked against published operating results. Calculated as the monthly average of the median of property-level estimates within the area.
- Breakdown of N: Tokyo city hotels N=107 properties (July 2026 final; also 107 properties in the same month a year earlier); Tokyo business hotels N=913 properties (July 2026 final; 902 properties in the same month a year earlier). The estimated OCC cohorts are 52–54 city hotels (about 17,294 rooms) and 524–536 business hotels (about 77,917 rooms).
- REIT published figures: Quoted without rounding from the July 2026 monthly operating results disclosed by each investment corporation. Disclosure scope: 101 domestic hotels for 8963, 29 hotels with variable rent, etc. for 8985, and the entire portfolio for 3463. None are Tokyo-only figures, and their population and aggregation method differ from our metrics. This article is not intended to rank the companies or to inform investment decisions.
- Data as of: September 21, 2026. Sales and inventory change daily, so the figures in this article are a snapshot as of the time of retrieval.
References and Sources
■ Data Sources
Occupancy, ADR and RevPAR for the three REITs are quoted as-is from the July 2026 monthly operating results each investment corporation disclosed in August 2026 (disclosure scope: 101 domestic hotels for 8963, 29 hotels with variable rent, etc. for 8985, and the entire portfolio for 3463). Tokyo’s estimated settled ADR, estimated OCC and booking curves were aggregated from sales and listed-inventory data on major booking sites that we collect on an ongoing basis, for Tokyo city hotels (N=107 properties, July 2026 final) and business hotels (N=913 properties, same). Prepared by MetroEngines Research and the HotelBank Editorial Team. Data as of September 21, 2026.
■ Calculation Assumptions
Estimated settled ADR is the monthly average of the median of property-level estimates; past months are final figures, and October and November 2026 are estimates based on current sales. YoY and two-year comparisons are both between closed months; estimates are not compared against final figures. The base-year sensitivity table compares each month from March to August 2026 with final figures for the same month in 2025 and 2024; N for the 2024 comparison year is 106–108 city hotels and 903–908 business hotels. Estimated OCC is calculated for a fixed cohort of properties that list at least 30% of their total rooms on OTAs, and booking curves use only observations from 45 days before the stay date up to the latest point.
■ Limitations and Caveats
REIT disclosures are revenue-weighted values for nationally diversified portfolios, while our metrics are area medians for Tokyo, so neither levels nor rates of change can be compared on the same scale. This article explains the gap in terms of population design and is not intended to rank the companies or to inform investment decisions. Estimated OCC counts unlisted rooms as sold, so it comes out higher than actual room occupancy. Estimated settled ADR is an estimate with a median error of 6.6% when checked against published operating results. Booking curves are snapshots as of the time of retrieval and will change with future sales.
■ Sources
- Invincible Investment Corporation, “Monthly Operating Results for July 2026” (Japanese) https://www.invincible-inv.co.jp/news/upd/140120260825525695.pdf
- Japan Hotel REIT Investment Corporation, “Monthly Operating Results (Data File)” (Japanese) https://www.jhrth.co.jp/file/review_exceldl-347fcee763387952f68e1b7a06e0839aaef0cd6e.xlsx
- Ichigo Hotel REIT Investment Corporation, “Monthly Operating Results for July 2026” (Japanese) https://www.ichigo-hotel.co.jp/ir/news/news_file/file/IchigoHotel_20260825_Monthly_Operating_Results_JPN.pdf