

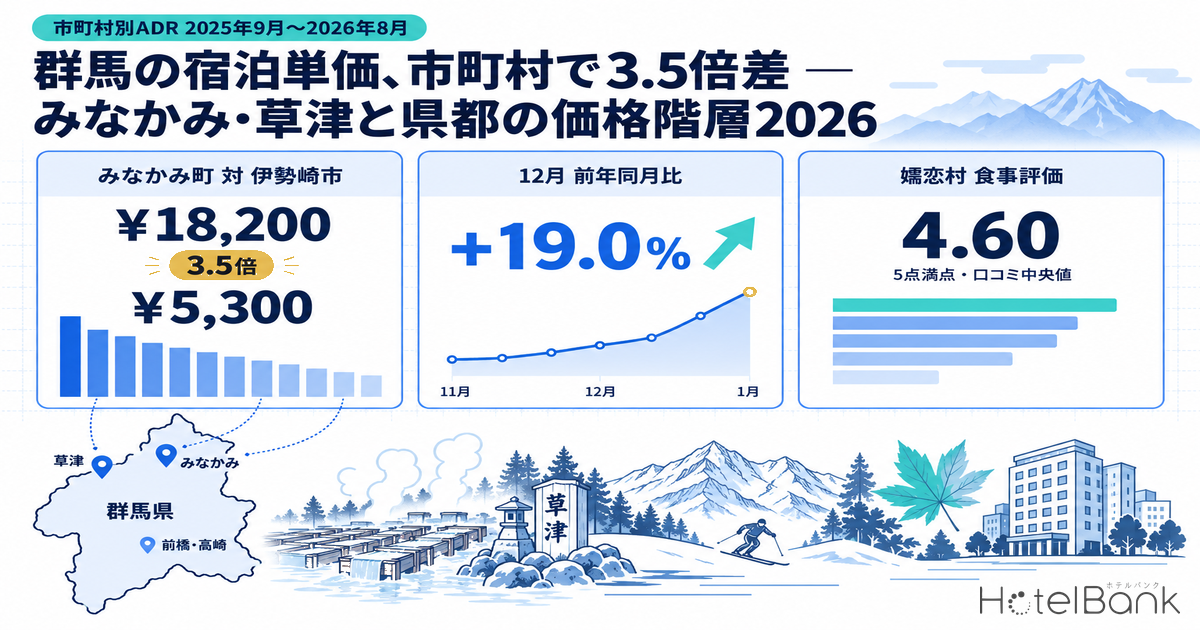
Gunma Prefecture holds one of Japan’s deepest concentrations of hot-spring resorts — Kusatsu, Ikaho, Minakami, Shima and Manza. Yet room rates in the prefectural capital of Maebashi and in neighbouring Takasaki sit at roughly the same level as the national business-hotel band. How far apart do rates actually run once you cross a municipal boundary inside a single prefecture? Aggregating 12 months of municipality-level data from MetroEngines Research (September 2025 to August 2026) reveals a gap of about 3.5x between Minakami Town at the top and Isesaki City at the bottom. This article opens up that tiered structure across four dimensions: price, supply, demand-supply balance, and guest reviews.
Metric Definitions Used in This Article
- ADR (average daily rate): an estimated settled rate (tax-excluded equivalent) derived by applying a property-type correction factor to the lowest published plan level each property lists on OTAs and similar channels (two guests per room, per-room price, tax-included). Cross-checked against property-level actuals disclosed by listed hotel REITs (91 properties, most recent three months), the median error is roughly 7%. These are estimates and differ from each property’s actual transacted rates and accounting figures. Area-level ADR is the median across the covered properties (the level of a typical property in that area).
- Calculation basis: settled months are computed on an “actual basis” from observed data, while months beyond the survey date are computed on a “forward-estimate basis” from currently listed inventory. Because the two rest on different foundations, a difference spanning the two bases cannot be read as a rate of change. This article states the basis in every chart caption, and all year-on-year figures and trend lines compare months on the same basis.
- OCC (occupancy): sold rooms as a share of total rooms in the area (an estimate based on OTA-listed inventory). It differs from a property’s full actual occupancy.
- Review scores: area medians of category scores (out of 5) from guest reviews posted in the most recent 24 months.
- Data source: MetroEngines Research / HotelBank Editorial Team research
- — On a 12-month actual-basis average, Minakami Town ¥18,200 versus Isesaki City ¥5,270. A roughly 3.5x price hierarchy exists inside one prefecture, splitting into three tiers: onsen towns, highland resorts, and lowland cities.
- — The hierarchy tracks property type and scale. 538 ryokan average 19.3 rooms while 158 business hotels average 70.6 rooms — ryokan outnumber business hotels 3.4 to 1, yet business hotels hold more rooms, a dual structure.
- — Demand runs opposite to price. Estimated OCC is highest for business hotels at 85.7–90.0% and lowest for resorts at 63.8–81.0% (settled months, May–August 2026), so the headroom to sell sits precisely with the higher-rate resorts and ryokan.
- — In reviews, Tsumagoi Village scores 4.60 on food, the highest in the prefecture. Second-tier areas dense with pensions and auberges lead on ratings, so rate and rating do not line up.
- — The 3.45x spread is close to Tochigi’s 3.47x and smaller than Nagano’s or Shizuoka’s. The difference is at the ceiling: Atami ¥24,600 and Karuizawa ¥23,500 against Gunma’s top of ¥18,200. The above-¥20,000 band remains a blank space in the prefecture.
Prefecture-wide ADR climbs in winter — the annual peak lands in December and January
Start with the prefecture as a whole. The chart below computes monthly ADR from roughly 430 properties with observable prices and overlays the years. Only actual-basis months are used.
What emerges is a pronounced winter seasonality. In 2025, November reached ¥13,000 and December ¥13,900 to form the annual peak, and the following January held a high ¥13,100. The trough is June: ¥10,600 in June 2026. Peak to bottom is a spread of about 31%. Where urban business markets stay flat through the year on weekday demand, Gunma’s rates are lifted by two seasonal waves — autumn foliage, then ski and onsen.
Year-on-year growth is concentrated in the same season. November 2025 was +14.1% year on year, December +19.0%, and January 2026 +13.6%. By contrast, July 2026 was −3.5% year on year and August +1.8%, so summer gains were limited. Gunma’s rate growth is being pulled by winter onsen and snow demand.
Gunma Prefecture monthly ADR (estimated settled rate / actual basis), years overlaid. N=410–449 properties. Source: MetroEngines Research, compiled by the HotelBank Editorial Team
Municipal ADR spans 3.5x — Minakami ¥18,200 against Isesaki ¥5,300
Break the prefectural average down by municipality and the price hierarchy comes into sharp relief. Municipal ADR levelled across all 12 months from September 2025 to August 2026, entirely on an actual basis, looks like this.
Municipal ADR (12-month average, September 2025 – August 2026; estimated settled rate / actual basis; per room at double occupancy). Covers the 12 municipalities with eight or more properties priced each month. Source: MetroEngines Research, compiled by the HotelBank Editorial Team
The hierarchy divides cleanly into three tiers. Tier 1, at ¥16,000–18,200, is Minakami Town, Nakanojo Town (Shima Onsen), Kusatsu Town and Shibukawa City (Ikaho Onsen) — all long-established onsen towns where ryokan serving two meals as standard dominate. Tier 2, at ¥10,500–13,700, is Tsumagoi Village (Manza and Kazawa), Numata City, Naganohara Town (Kita-Karuizawa) and Katashina Village: highland resort and mountain areas whose lodging stock is very different in character from Tier 1. Tier 3, at ¥5,300–7,500, is the lowland urban cluster of Maebashi, Takasaki, Ota and Isesaki.
What stands out is that Tier 1 runs 3.5x Tier 3. Takasaki (¥7,350) and Maebashi (¥7,470), the two largest cities, sit at a standard national business-hotel level. Across 12 months, the gap between their cheapest and dearest month is only 19–29% — almost no seasonal swing. In both rate level and seasonality, the prefecture’s lodging market is effectively two entirely separate markets sharing one map. A four-tier reading of this hierarchy focused on autumn conditions is covered in detail in Gunma Hotel Market 2026: Four ADR Tiers and a ¥5,700 Upper-Mid Gap.
Even onsen towns swing differently — Ikaho 1.66x, Kusatsu 1.46x
Line the onsen towns up against each other and the price movement is far from uniform. Below are 12-month trend lines for five main areas, all on an actual basis.
Monthly ADR trends for five main municipalities (estimated settled rate / actual basis). N = Kusatsu Town 76–92, Minakami Town 46–51, Shibukawa City 45–47, Tsumagoi Village 19–24, Takasaki City 27–33 properties. Source: MetroEngines Research, compiled by the HotelBank Editorial Team
Shibukawa City (Ikaho Onsen) swings 1.66x, from a low of ¥12,600 in June 2026 to a high of ¥20,900 in November 2025. Sitting within day-trip range of the Tokyo metropolitan area, it shows a sharp contrast between concentrated-demand periods and the off-season. Kusatsu Town runs ¥14,600–21,300 for 1.46x and Minakami Town ¥15,600–20,400 for 1.31x — both more levelled. Kusatsu draws thick onsen-purpose visits year-round and Minakami secures summer demand through outdoor activities, so both hold a high floor.
Tsumagoi Village swings 1.77x across ¥9,500–16,800 yet sits at a Tier 2 level. Ski demand lifts it above ¥16,500 in December and January, while June falls to ¥9,500 — an area with a deep annual demand trough. Takasaki City, meanwhile, moves almost flat within a ¥6,500–7,800 range, behaving completely unlike the other four.
The rate gap is a gap in scale per property — Tsumagoi’s 185 properties average 14 rooms
Behind this hierarchy lies a difference in the composition of supply itself. The property master identifies 1,617 properties in Gunma. The 1,615 for which a municipality could be determined hold 33,552 rooms in total, broken out by type as follows.
| Property type | Properties | Rooms | Avg rooms |
|---|---|---|---|
| Ryokan | 538 | 10,373 | 19.3 rooms |
| Pensions | 214 | 1,662 | 7.8 rooms |
| Business hotels | 158 | 11,157 | 70.6 rooms |
| Minshuku | 156 | 1,242 | 8.0 rooms |
| Vacation rentals / cottages | 108 | 349 | 3.2 rooms |
| Lodges / mountain huts | 69 | 710 | 10.3 rooms |
| Camping / glamping | 67 | 550 | 8.2 rooms |
| Resort hotels | 44 | 2,929 | 66.6 rooms |
| City hotels | 15 | 1,268 | 84.5 rooms |
| Other (petit hotels, public lodgings, auberges, etc.) | 246 | 3,312 | 13.5 rooms |
Gunma property master aggregation (N=1,615 properties / 33,552 rooms). Properties not listed on OTAs are excluded. Source: MetroEngines Research, compiled by the HotelBank Editorial Team
Ryokan account for a third of all properties at 538 properties and 10,373 rooms, yet average only 19.3 rooms. Business hotels, by contrast, hold 11,157 rooms across 158 properties, averaging 70.6. Ryokan outnumber business hotels 3.4 to 1, and still business hotels edge ahead on room count — an inversion. Gunma’s lodging supply is a dual structure: many small properties dispersed across onsen and highland areas, and mid-sized properties concentrated in the lowland cities.
Broken out by municipality, the structure stands out even more sharply.
| Municipality | Properties | Rooms | Avg rooms | Main property-type mix | 12-month avg ADR |
|---|---|---|---|---|---|
| Minakami Town | 208 | 3,176 | 15.3 rooms | Ryokan 85, Minshuku 36, Pensions 30 | ¥18,200 |
| Nakanojo Town (Shima) | 63 | 850 | 13.5 rooms | Ryokan 54, Minshuku 4 | ¥17,700 |
| Kusatsu Town | 206 | 3,451 | 16.8 rooms | Ryokan 112, Pensions 29, Minshuku 15 | ¥17,600 |
| Shibukawa City (Ikaho) | 88 | 2,806 | 31.9 rooms | Ryokan 62, Business 7 | ¥16,700 |
| Tsumagoi Village (Manza / Kazawa) | 185 | 2,642 | 14.3 rooms | Pensions 54, vacation rentals 52, Ryokan 22 | ¥13,700 |
| Numata City | 65 | 1,157 | 17.8 rooms | Ryokan 24, Pensions 14, Business 6 | ¥11,600 |
| Naganohara Town (Kita-Karuizawa) | 57 | 829 | 14.5 rooms | Pensions 15, Ryokan 9, vacation rentals 9 | ¥11,500 |
| Katashina Village (Oze / Marunuma) | 223 | 2,606 | 11.7 rooms | Pensions 65, Minshuku 57, Ryokan 51 | ¥10,600 |
| Maebashi City | 88 | 2,992 | 34.0 rooms | Business 24, Ryokan 22, City 5 | ¥7,500 |
| Takasaki City | 99 | 4,515 | 45.6 rooms | Business 34, Ryokan 18, City 4 | ¥7,350 |
| Ota City | 47 | 2,233 | 47.5 rooms | Business 20, Ryokan 9 | ¥6,530 |
| Isesaki City | 43 | 2,137 | 49.7 rooms | Business 16, Ryokan 1 | ¥5,270 |
Property and room counts are from the property master. ADR is the 12-month average from September 2025 to August 2026 (estimated settled rate / actual basis). Source: MetroEngines Research, compiled by the HotelBank Editorial Team
Tsumagoi Village carries 185 properties — among the most in the prefecture — yet averages 14.3 rooms and an ADR of ¥13,700, squarely mid-table. The breakdown explains it plainly: 54 pensions and 52 vacation rentals form the core, with only 22 ryokan. Katashina Village likewise has the most properties in the prefecture at 223, but its mix of 65 pensions and 57 minshuku averages 11.7 rooms. Both areas built their markets on a small-scale, unpretentious, activity-base position, and their rate levels reflect that composition directly.
Shibukawa City (Ikaho), conversely, averages 31.9 rooms across 88 properties — by far the largest per-property scale among the onsen towns. It is an area dense with large ryokan, which also feeds the width of its seasonal swings in occupancy and rate. In the cities, Takasaki averages 45.6 rooms, Ota 47.5 and Isesaki 49.7, all centred on mid-sized business hotels.
Circle size = number of properties; colour = 12-month average ADR tier. Source: MetroEngines Research, compiled by the HotelBank Editorial Team
Estimated OCC spans over 15pt by property type — business 86%, resorts 70%
The price hierarchy also maps onto the demand-supply balance. Lining up estimated OCC by property type across Gunma (settled months, May to August 2026) gives the following.
Gunma Prefecture estimated OCC by property type. Covered property counts vary by month; as of July 2026, business 89 properties / 7,941 rooms, ryokan 190 properties / 5,291 rooms, resorts 30 properties / 2,718 rooms, city hotels 11 properties / 1,022 rooms. Source: MetroEngines Research, compiled by the HotelBank Editorial Team
Business hotels hold the highest level throughout the four months at 85–90%. Weekday business demand accumulates steadily year-round, which suggests their flat pricing reflects not thin demand but inventory that is already filling at a high level. Resort hotels, at 63.8% in June and 70.0% in July, are the lowest of any type, closing the gap to 81.0% in August. Ryokan climb with the season from 81.5% in June to 88.9% in August, and city hotels moved within a 71.7–78.1% range.
What this reveals is that in Gunma, a high-price area is not necessarily a tight-demand area. Urban business hotels at the bottom of the prefecture’s ADR range record the highest occupancy, while resorts in the upper ADR band record the lowest. Ryokan and resorts retain a little over 10 points of selling headroom even in summer, which is growth room in the sense of capturing demand shifted across seasons. Which days of the week that headroom clusters on is broken out by property type in Gunma Day-of-Week OCC: Ryokan Trough Wed 78.9%, Business Sun 81.3%.
What reviews reveal about each area’s strengths — Tsumagoi’s 4.60 on food leads the prefecture
Next, where guests actually rate highly. The chart below aggregates reviews posted in the most recent 24 months by area and category and compares each median against the prefectural median. Gunma’s overall medians are food 4.43 (316 properties, 51,160 reviews), service 4.27 (453 properties, 78,828 reviews), cleanliness 4.24 (372 properties, 48,716 reviews) and rooms 4.10 (463 properties, 92,780 reviews).
Median guest-review category scores over the most recent 24 months (out of 5). Dashed line is the Gunma prefectural median. Source: HotelBank Editorial Team research
Tsumagoi Village deserves particular note. Its ADR of ¥13,700 places it in Tier 2, yet its median food score of 4.60 is the highest among the six areas compared here. Minakami Town follows at 4.56 and Kusatsu Town at 4.55. The character of an area dense with pensions and auberges shows up directly as a high food rating — smaller properties are structurally able to put more care into the cooking. Small properties in Katashina, Minakami and Tsumagoi likewise occupy the top of the prefecture-wide food ranking.
Kusatsu Town pairs food at 4.55 with location at 4.42 (78 properties, 8,381 reviews), well above the prefectural median of 4.18 — the walkable onsen streetscape around the Yubatake shows up in the numbers. Minakami Town posts the highest cleanliness score of the six areas at 4.47, suggesting relatively new or renovated properties are being rewarded. Shibukawa City (Ikaho) sits near the prefectural median with rooms at 4.10 and cleanliness at 4.18, settling into the steady ratings typical of large ryokan.
At the individual property level, the top of the food category (24 months, 25 or more reviews) includes Petit Hotel Regent House (プチホテル リージェントハウス) in Katashina Village (25 reviews, 5.00), Oyado Hanashiki no Yu (御宿 花敷の湯) in Nakanojo Town (47 reviews, 4.98), Niigataya Ryokan (新潟屋旅館) in Kusatsu Town (26 reviews, 4.96), Furusato no Yado Hanaichi (ふるさとの宿 花いち) in Tsumagoi Village (136 reviews, 4.96) and Yado Kanzan (やど莞山) in Minakami Town (105 reviews, 4.94). In the service category (30 or more reviews), Resort Inn Katashina (リゾート・イン・片品) in Katashina Village (70 reviews, 5.00), THE W Relax Garden Resort in Maebashi City (173 reviews, 4.97) and numatana glamping resort in Numata City (42 reviews, 4.95) led. Ratings are not skewed toward the higher-rate areas: a large number of highly rated properties come out of Tier 2 and Tier 3 as well.
Autumn forward levels, and the price band standing empty
Everything above has used actual-basis settled months. Finally, consider the level for the coming November 2026, computed on a forward-estimate basis from listed inventory. As noted, this figure rests on a different foundation from settled months, so no rate of change can be drawn by netting it against them. Read it purely as a side-by-side picture of which area sits in which price band as of autumn.
Municipal ADR for November 2026 (estimated settled rate / forward-estimate basis; estimated from listed inventory as of early September 2026; per room at double occupancy). Covers the 12 municipalities with eight or more priced properties. Because the basis differs from actual-basis months, the two cannot be compared as a difference. Source: MetroEngines Research, compiled by the HotelBank Editorial Team
The ordering of the tiers largely holds in November as well. Kusatsu Town at ¥18,900, Nakanojo Town at ¥18,100, Minakami Town at ¥17,800 and Shibukawa City at ¥16,100 form the top, followed by Naganohara Town at ¥13,900, Numata City at ¥11,600 and Tsumagoi Village at ¥10,800. Autumn foliage arrives from late October into early November across the Tanigawa-dake, Ikaho and Akagi areas, and from December ski demand shifts to Katashina, Minakami and Tsumagoi. That handover of demand is what drives rates in the northern part of the prefecture from November through January.
Two pockets of growth room emerge from the data as a whole.
The first is that the ¥20,000–30,000 band is almost entirely unfilled within the prefecture. Even Minakami Town, the highest on a 12-month actual-basis average, sits at ¥18,200, and the monthly peak of ¥21,300 (Kusatsu Town, December 2025) is close to the ceiling. Nationally this band has been filling with high-quality small ryokan and auberges, yet Gunma’s onsen towns remain thickly concentrated in the ¥15,000–20,000 range. Review data backs the potential for the small properties of Tsumagoi, Katashina and Minakami — the prefecture’s leaders on food scores — to step into the range above.
The second is the resort off-season. Estimated OCC of 63.8% in June (June 2026, settled month on an actual basis, aggregated across resort-type properties in the prefecture) is the trough between the summer and winter demand peaks, and offers the largest room to fill. Gunma’s total guest nights in 2024 came to 9,751 thousand, down to 95.1% of the prior year, while foreign guest nights reached 432 thousand at 136.6% of the prior year, a substantial gain (Gunma Prefecture, “FY2024 Tourism Visitor Statistics Survey Report”). Inbound guests move on different day-of-week and seasonal patterns from domestic travellers, so whether that segment can be drawn into the off-season will shape annual RevPAR for the prefecture’s northern resorts.
The spread itself matches neighbouring prefectures — the difference is the ceiling
Is the 3.5x spread examined so far unique to Gunma? The table below lines up, on the same basis (12 months from September 2025 to August 2026, actual basis, municipalities with eight or more properties priced each month), neighbouring prefectures that likewise combine onsen towns with a prefectural capital.
| Prefecture | Top municipality | Top ADR | Bottom ADR | Spread | Municipalities covered |
|---|---|---|---|---|---|
| Gunma | Minakami Town | ¥18,200 | ¥5,270 | 3.45x | 15 |
| Tochigi | Nasu Town | ¥19,900 | ¥5,730 | 3.47x | 11 |
| Nagano | Karuizawa Town | ¥23,500 | ¥5,950 | 3.94x | 23 |
| Shizuoka | Atami City | ¥24,600 | ¥6,210 | 3.96x | 26 |
12-month average ADR (estimated settled rate / actual basis; per room at double occupancy). Covers municipalities with eight or more properties priced each month. N = Gunma 15 municipalities, Tochigi 11, Nagano 23, Shizuoka 26. Source: MetroEngines Research, compiled by the HotelBank Editorial Team
Look at the multiple itself and Gunma’s 3.45x is nearly identical to Tochigi’s 3.47x, and in fact smaller than Nagano’s 3.94x or Shizuoka’s 3.96x. In prefectures where onsen towns and lowland cities coexist, a three- to fourfold spread is a thoroughly standard structure. Gunma’s 3.5x is not, in itself, an outlier.
Where the difference appears is not the multiple but the height of the ceiling. The bottom band lines up at ¥5,000–6,000 across all four prefectures, but at the top, Shizuoka (Atami City, ¥24,600) and Nagano (Karuizawa Town, ¥23,500) clear ¥23,000 while Gunma stops at ¥18,200 — below even Tochigi’s Nasu Town at ¥19,900. The previous section noted that the ¥20,000–30,000 band is almost unfilled within the prefecture; this comparison confirms that the band does in fact exist in neighbouring prefectures. Gunma’s hierarchy is not low at the bottom — it is unfinished at the top.
Summary
Gunma’s lodging market spans roughly 3.5x on a 12-month actual-basis average, from Minakami Town at ¥18,200 to Isesaki City at ¥5,270. That gap is not simply “onsen town versus city” — it is inscribed on the supply side as a difference in rooms per property and in property-type mix. The 538 ryokan average 19.3 rooms and the 214 pensions average 7.8; many small properties dispersed across the landscape is the structure of the prefecture’s north.
On the demand side, urban business hotels with the lowest rates record the highest estimated OCC at 85–90%, while the higher-rate resort segment records the lowest at 63.8–81.0%. That price and tightness do not coincide means selling headroom remains in the top-rate areas. And the review data shows high ratings clustering precisely in the mid-rate areas, led by Tsumagoi Village’s 4.60 on food.
Autumn into winter, when demand hands off from foliage to skiing, is Gunma’s strongest season of the year. Rates in that window grew +14.1% year on year in November 2025 and +19.0% in December, and the market is on an upward footing. Gunma’s next stretch of growth lies in two blank spaces: the range above ¥20,000, and the June off-season.
⚠ Note on ADR for future dates: the November 2026 municipal ADR figures in this article are estimates drawn from inventory published on OTAs and similar channels as of early September 2026, and will move as the check-in date approaches. Because they also rest on a different basis from settled months (actual basis), the two cannot be netted against each other and read as a rate of change.
Related reading
- Gunma Hotel Market 2026: Four ADR Tiers and a ¥5,700 Upper-Mid Gap
- Gunma Day-of-Week OCC: Ryokan Trough Wed 78.9%, Business Sun 81.3%
- Gunma Settled ADR June 2026: Business +2.9%, City -9.0%, Ryokan -3.9%
- Gunma Ryokan vs Resorts: +3.2pt and +5.5pt Gains from 45 Days Out
- Tottori’s 3-Tier Hotel Market: Onsen ADR 2.16x the City Average
References and Sources
■ Data sources
Municipal estimated settled ADR (12 months from September 2025 to August 2026 on an actual basis, plus November 2026 on a forward-estimate basis); the Gunma property master (1,617 properties, of which 1,615 could be assigned to a municipality / 33,552 rooms); estimated OCC by property type (settled months, May to August 2026); and category scores from guest reviews posted in the most recent 24 months. The neighbouring-prefecture comparison re-aggregates Tochigi, Nagano and Shizuoka on identical conditions.
■ Calculation assumptions
ADR is an estimated settled rate derived by applying a property-type correction factor to the lowest published plan level each property lists (two guests per room, per-room price, tax-included), with area values taken as the median across covered properties. The 12-month average is a simple average of actual-basis months only. Municipal aggregation is limited to areas with eight or more properties priced each month. Estimated OCC is sold rooms as a share of total rooms in the area (an estimate based on OTA-listed inventory). Review scores are area medians out of 5.
■ Limitations and caveats
ADR and OCC are both estimates and differ from each property’s actual transacted rates, occupancy and accounting figures (cross-checked against property-level actuals disclosed by listed hotel REITs, the median error is roughly 7%). Because the actual basis and the forward-estimate basis rest on different foundations, the two cannot be netted against each other and interpreted as a rate of change. Properties not listed on OTAs or similar channels are excluded from the aggregation, and the fewer properties an area has, the more its median is influenced by individual properties. Review scores carry self-selection bias from those who post them.
■ Market data
- MetroEngines Research — municipal ADR (estimated settled rate), estimated OCC by property type, property master (Gunma N=1,617 properties)
- HotelBank Editorial Team research — aggregation of guest-review category scores (Gunma, most recent 24 months)
■ Government and municipal statistics
- Gunma Prefecture, “FY2024 (2024) Tourism Visitor Statistics Survey Report”
- Japan Tourism Agency, “Overnight Travel Statistics Survey” (e-Stat)
- Gunma Prefecture, Survey Results on Visitor Numbers and Tourism Spending (estimates)
■ Reference material