

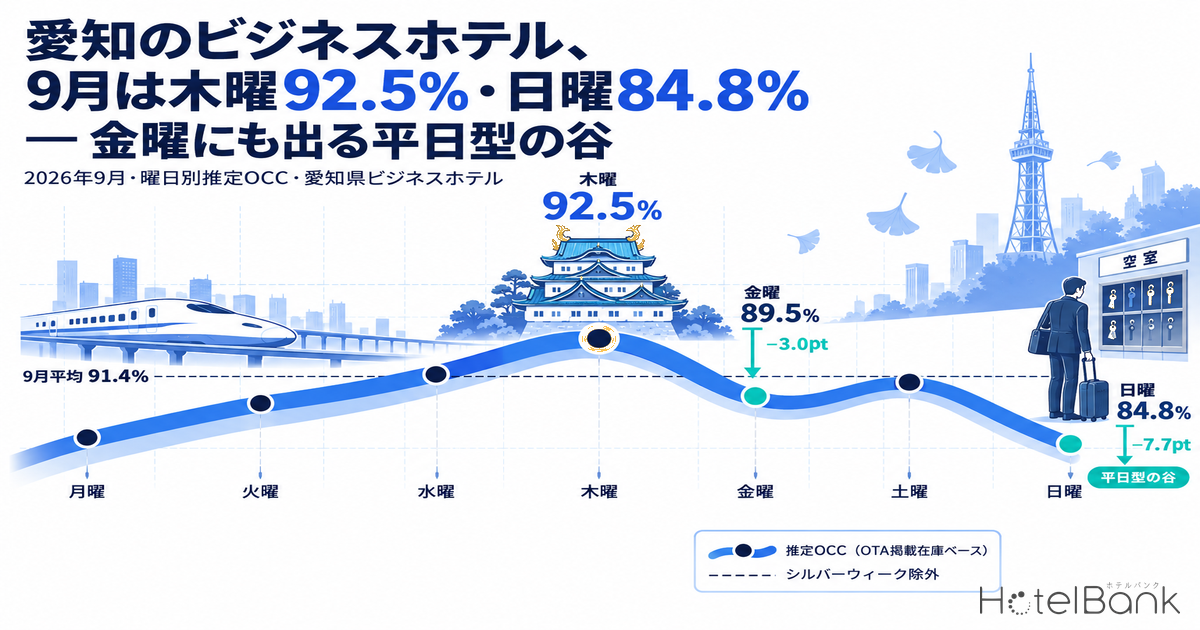
For business hotels in Aichi Prefecture (a fixed cohort of roughly 172 properties / about 25,700 rooms, based on listings on major booking sites), aggregating daily estimated OCC (based on OTA-listed inventory) for September 2026 by day of week reveals a “weekday-type” pattern once Silver Week (September 19–23) is excluded: Thursday peaks at 92.5%, then the week slides to 89.5% on Friday and 84.8% on Sunday. A dip of −3.0pt from Thursday to Friday and −7.7pt from Thursday to Sunday appears every week, and behind the high monthly average of 91.4% sit days of the week that persistently fail to fill. This article reads that day-of-week pattern by splitting the month into its second half, which was affected by the Asian Games (September 19–October 4), and its first half, which was close to normal, and then sets out the practical steps for filling Sunday and Friday nights through length-of-stay conditions and plan design.
Scope: Aichi Prefecture business hotels, N=171–175 properties (varies by day; a fixed cohort based on inventory listed on major booking sites). The price metric in this article is estimated settled ADR (the settled price level estimated from OTA and other sales data, tax-exclusive equivalent), and occupancy is an estimate based on OTA-listed inventory. Both are defined at the end of the article. Data as of October 9, 2026.
- — The dip comes in two steps, Friday and Sunday: In the day-of-week averages for September 2026 (25 days, excluding Silver Week, Sep 19–23), estimated OCC peaks on Thursday at 92.5%, with Friday at 89.5% (−3.0pt) and Sunday at 84.8% (−7.7pt). Aichi Prefecture business hotels, N=171–175 properties.
- — The dip is deeper in normal weeks: For September 1–18 alone, before the Asian Games, Thursday was 91.1%, Friday 86.9% and Sunday 79.5%. The Thursday–Sunday gap widens to 11.6pt, and Friday does not even reach Saturday (87.4%).
- — Days when many properties were left with unsold rooms: The sold-out property share was only 7.1% on Friday, September 4 and 10.1% on Sunday, September 6, versus 86.9% on Wednesday, September 16. On normal-week Fridays and Sundays, around 90% of properties in the prefecture still had inventory on the day itself.
- — Sundays lag in October as well: On the booking curve, Sunday, October 25 stood at 59.0% 45 days out and 70.5% 17 days out, nearly 20pt short of the Thursday of the same week (Oct 22; 89.2% 14 days out). N=167–168 properties.
- — The lever is to limit multi-night offers to Sunday and Friday arrivals: A “Sunday check-in, 2+ nights” condition captures day-before arrivals for Monday business trips, while “Thursday check-in, 2 nights” and “Friday check-in, 2 nights” fill Friday. Multi-night offers starting Tuesday–Thursday risk pre-selling peak inventory cheaply.
September Estimated OCC by Day of Week — Thursday Peaks at 92.5%, with Dips on Friday and Sunday
First, the shape of the week across the whole month. Taking the daily estimated OCC for the 30 days of September 2026, removing the five Silver Week days from Saturday, September 19 to Wednesday, September 23 (a public holiday), and averaging the remaining 25 days by day of week gives Monday 89.8%, Tuesday 90.4%, Wednesday 92.0%, Thursday 92.5%, Friday 89.5%, Saturday 91.0% and Sunday 84.8%. Occupancy builds day by day from Monday to Thursday, reaches its high on Thursday, drops a step on Friday (−3.0pt), recovers on Saturday (91.0%) and sinks to the weekly low on Sunday (84.8%). The Thursday–Sunday difference is 7.7pt, which can be called the “depth of the dip” that Aichi business hotels carry every week. In our earlier analysis of the same fixed cohort, averaged by day of week over the 92 days of June–August 2026 (Thursday 86.7%, Sunday 72.2%; N=165–175 properties, observed at a lead time of one day), the gap was 14.5pt, so the dip looks shallower in September only to the extent that Games demand in the second half of the month lifted the overall level.
Source: MetroEngines Research, compiled by HotelBank Editorial Team (September 2026; 25 days excluding Silver Week, Sep 19–23; N=171–175 properties)
| Day | Days counted | Avg. estimated OCC | Lowest day | Highest day | vs. Thursday |
|---|---|---|---|---|---|
| Monday | 3 | 89.8% | 80.9% | 98.1% | -2.7pt |
| Tuesday | 4 | 90.4% | 80.8% | 97.9% | -2.1pt |
| Wednesday | 4 | 92.0% | 84.2% | 98.5% | -0.5pt |
| Thursday | 4 | 92.5% | 86.1% | 97.7% | — |
| Friday | 4 | 89.5% | 80.0% | 97.3% | -3.0pt |
| Saturday | 3 | 91.0% | 86.1% | 98.1% | -1.5pt |
| Sunday | 3 | 84.8% | 79.0% | 95.3% | -7.7pt |
Source: MetroEngines Research, compiled by HotelBank Editorial Team (estimated OCC is based on OTA-listed inventory; September 2026, excluding Sep 19–23. N=171–175 properties / 24,654–26,210 rooms)
Note, however, how wide the spread is between the “lowest day” and the “highest day” in this table. Sunday, for example, ranges more than 16pt from a low of 79.0% (September 6) to a high of 95.3% (September 27), and Friday likewise runs from 80.0% (September 4) to 97.3% (September 25). The background is that the opening of the 20th Asian Games (Aichi-Nagoya, September 19–October 4) lifted the level of demand in the second half of the month, so the month-wide day-of-week averages are a blend of “normal weeks” and “Games weeks.” The next section therefore isolates the first half of the month (September 1–18) to confirm the day-of-week shape in normal conditions.
First Half (Sep 1–18) vs. Games Week (Sep 24–30) — In Normal Weeks Sunday Is 79.5% and the Dip Is Deeper
The daily trend makes the structure of the month clear. The first week, which began at 80.8% on Tuesday, September 1, recorded some of the lowest readings of the month — 80.0% on Friday the 4th and 79.0% on Sunday the 6th — and the second week also bottomed out on Sunday the 13th at 80.1%. From Monday the 14th (90.5%), however, the level stepped up, reaching the high 90s in the few days before the holiday run: 98.5% on Wednesday the 16th, 97.7% on Thursday the 17th and 95.2% on Friday the 18th. The five days of Silver Week ranged from 91.7% to 99.9% (97.0% or higher on the 19th–22nd, and 91.7% on the final day, the 23rd), and from Thursday the 24th, after the holidays, a high level of 95.3–98.1% continued through the end of the month.
Source: MetroEngines Research, compiled by HotelBank Editorial Team (September 2026; daily estimated OCC; N=171–175 properties. Shading marks Silver Week, Sep 19–23, excluded from the day-of-week aggregation)
Recalculating the day-of-week averages for the first half of the month only, September 1–18 (18 days), gives Monday 85.7% (2 days), Tuesday 87.9% (3 days), Wednesday 90.4% (3 days), Thursday 91.1% (3 days), Friday 86.9% (3 days), Saturday 87.4% (2 days) and Sunday 79.5% (2 days); the drop from Thursday to Friday widens to −4.2pt and the Thursday–Sunday gap to 11.6pt. The dip is deeper than in the month-wide figures that include the Games week (Thursday–Friday −3.0pt, Thursday–Sunday 7.7pt), which suggests that in normal times Aichi business hotels repeat a high-amplitude week that “fills up on Thursday and drains on Sunday.” The fact that Saturday falls short of Thursday (87.4% versus 91.1%) is also a weekday-type trait, the reverse of hotels in leisure destinations.
| Day | First half, Sep 1–18 (normal weeks) | Full month (excl. Sep 19–23) | Games week, Sep 24–30 |
|---|---|---|---|
| Monday | 85.7% (2 days) | 89.8% (3 days) | 98.1% |
| Tuesday | 87.9% (3 days) | 90.4% (4 days) | 97.9% |
| Wednesday | 90.4% (3 days) | 92.0% (4 days) | 96.7% |
| Thursday | 91.1% (3 days) | 92.5% (4 days) | 96.6% |
| Friday | 86.9% (3 days) | 89.5% (4 days) | 97.3% |
| Saturday | 87.4% (2 days) | 91.0% (3 days) | 98.1% |
| Sunday | 79.5% (2 days) | 84.8% (3 days) | 95.3% |
Source: MetroEngines Research, compiled by HotelBank Editorial Team (estimated OCC is based on OTA-listed inventory. Games-week values are single-day readings for each day of the week. N=171–175 properties)
The same picture emerges from the sold-out property share (the estimated share of properties for which no listed inventory could be confirmed on OTAs and similar channels). It was only 7.1% on Friday, September 4 — the lowest of the first half — and 10.1% on Sunday the 6th, meaning around 90% of properties in the prefecture still had sellable rooms on the day itself, whereas it reached 86.9% on Wednesday the 16th and 42.4% even on Sunday the 27th, during the Games. Normal-week Fridays and Sundays were, more than the occupancy figures alone suggest, “days when many properties were left with unsold rooms.”
To add monthly price context, the estimated settled ADR for Aichi Prefecture business hotels in September 2026 was ¥11,701 (final; N=321 properties), far above the same month a year earlier (September 2025; ¥7,638; N=324 properties) at +53.2%. Games-related demand likely pushed up rates in the second half of the month, but this article does not go into day-of-week pricing; here it simply serves as background that “September was a month in which both rate and occupancy were skewed toward the second half.” The estimated settled ADR for October is ¥12,380 (N=310 properties), an estimate based on current sales conditions that exceeds September, but a straight comparison with final figures should wait until the month closes.
How Are October Fridays and Sundays Building? — The Dip Reappears on the Booking Curve
So does the day-of-week dip seen in September reappear in October? Lining up the booking curves — the build-up of estimated OCC from 45 days before the stay date to the latest observation — for the four days from Thursday, October 15 to Sunday, October 18, there was little difference at 45 days out (Thursday 67.8%, Friday 75.3%, Saturday 76.4%, Sunday 72.5%), but by 30 days out the figures were Thursday 74.1%, Friday 80.1%, Saturday 82.2% and Sunday 76.5%, and by 14 days out Thursday 85.1%, Friday 86.0%, Saturday 89.1% and Sunday 81.3% — only Sunday shows a flatter pickup slope. In the latest observations too (Thursday 92.4% at 7 days out, Friday 88.9% at 8 days out, Saturday 90.8% at 9 days out, Sunday 82.9% at 10 days out), Thursday gained about 7pt in the week from 14 to 7 days out, while Sunday added only 1.6pt from 14 to 10 days out.
Source: MetroEngines Research, compiled by HotelBank Editorial Team (observations from 45 days before the stay date to the latest; N=167 properties / 25,665 rooms; based on listings on major booking sites; data as of October 9, 2026)
The following week, Thursday the 22nd to Sunday the 25th, has the same shape: Sunday the 25th, which started lowest at 59.0% 45 days out, was at 64.2% 30 days out and 70.5% at the latest observation (17 days out), nearly 20pt short of the Thursday (the 22nd; 89.2% at the latest observation, 14 days out) and the Friday (the 23rd; 88.9% at 15 days out) of the same week. Note that October 18 (Sunday) to 24 (Saturday) is the period of the 5th Asian Para Games, a week in which Games-related demand overlaps (across all hotel types prefecture-wide, the snapshot at 21 days out shows 73.1% for the period between the two Games against 81.8% for the Asian Para Games week, which forms a second peak). Even so, the fact that Sunday is the furthest behind within the week does not change, and the September day-of-week shape appears to be continuing in the same direction in October. At the time of writing these stay dates are within 30 days and the figures are current status; where they finally land depends on the last-minute pickup. On the average curve for October 1–8, Aichi business hotels built up +12.4pt from 45 days out to 10 days out, closing the gap with city hotels from 8.0pt to 1.8pt, and the climb of this article’s Thursday (October 15) from 67.8% at 45 days out to 92.4% at 7 days out is an extension of that same pattern.
For Revenue Managers Running Business Hotels in Aichi — Implications and Action Plan
Operational insights
1. Treat the dip as “two steps, Friday and Sunday,” not “Sunday alone.” In the month-wide day-of-week averages, Thursday was 92.5% against Friday 89.5% and Sunday 84.8%; in normal weeks (Sep 1–18), Thursday was 91.1% against Friday 86.9% and Sunday 79.5%. Friday does not even reach Saturday (87.4%), so leisure demand is not fully filling the space left when business-trip demand drains away. Line up your own property’s occupancy by day of week in the same form, and if the Friday drop is larger than the market’s −3.0 to −4.2pt, suspect that your pre-weekend inventory is not visible to leisure guests.
2. Do not sell Sunday night on its own; design it as a multi-night stay of “Sunday in, Monday out, plus more.” In normal weeks Monday is 85.7% and Tuesday 87.9%, so the start of the week is not full either, and the market has room to accept two- to three-night stays starting on Sunday. Preparing one condition limited to multi-night stays that include Sunday (for example, Sunday check-in for two or more nights, at the same rate band throughout) creates an entry point for steering guests whose business trips start on Monday toward arriving the day before. Conversely, multi-night conditions that include Thursday or Wednesday risk filling peak-day inventory early in a cheap bucket, so limiting the starting day of multi-night offers to Sunday and Friday is the sound design.
3. Fill Friday night from two directions: “extensions from Thursday” and “leisure pre-stays ahead of Saturday.” Of Thursday’s 92.5% demand, 3.0pt disappears on Friday, but part of that is stays where work continues on Friday. A “Thursday check-in, 2 nights” condition, or a late checkout on Friday morning offered as a multi-night benefit, is worth considering as a way to stretch Thursday bookings into Friday. From the Saturday side, a “Friday check-in, 2 nights” design that shows the total without changing Saturday’s rate band works to pull the night before a weekend leisure trip onto Friday.
4. Use the booking curve to detect “Sunday lag” early. October Sundays stood at 72.5% (the 18th) and 59.0% (the 25th) 45 days out; the 18th started above the Thursday of the same week (67.8%) yet grew slowly through 30 and 14 days out. At your own property, line up Sunday booking pace against Thursday at three points — 45 days out, 30 days out and just before arrival — and if at 30 days out Sunday’s gap to Thursday is less favourable than the market’s (+2.4pt for Oct 15 vs. Oct 18; −15.9pt for Oct 22 vs. Oct 25), that is grounds for bringing forward the exposure of multi-night conditions.
Action Plan by Time Horizon — Act in Three Stages: This Week, Within Two Weeks, Next Month
| Time horizon | Action | Decision trigger (tied to figures in this article) | Aim |
|---|---|---|---|
| Today – this week | Aggregate your property’s September actuals by day of week and line up the drop versus Thursday against the market | Friday’s gap to Thursday is larger than −3.0pt, or Sunday’s larger than −7.7pt (−4.2pt / −11.6pt in normal weeks) | Separate whether the dip is market-driven or property-driven |
| Today – this week | Check your property’s pace for Sunday, October 18 and 25 alongside Thursday | The market’s Sundays stand at 82.9% (Oct 18) and 70.5% (Oct 25) at the latest observation. Your property is below these | Step up exposure of Sunday check-in multi-night offers in the final two weeks |
| Within two weeks | Design one “Sunday check-in, 2+ nights” plan and link it to Monday and Tuesday inventory | Your property also has slack against the normal-week Monday 85.7% and Tuesday 87.9% | Capture day-before arrivals for Monday business trips on Sunday |
| Within two weeks | Set up an extension benefit (late checkout, etc.) for “Thursday check-in, 2 nights” | Your property’s Thursday-to-Friday drop exceeds the market’s −3.0pt | Extend Thursday’s business demand through Friday |
| Toward next month | Prepare a “Friday check-in, 2 nights” condition for weekend leisure and keep the rate band for single Saturday nights | The normal-week shape in which Friday (86.9%) is below Saturday (87.4%) also appears at your property | Pull the pre-stay for Saturday demand onto Friday |
| Toward next month | Record pace at fixed points — 45 days out, 30 days out and just before arrival — for Sundays and Fridays from November onward | At 30 days out, Sunday’s gap to Thursday is less favourable than the market’s (+2.4 to −15.9pt) | Prepare early for the normal-week dip after Games demand has drained away |
Source: Compiled by HotelBank Editorial Team (the trigger figures are the aggregates in this article)
All of these are framed as opportunities, and their effect will differ with each property’s location, guest mix and existing sales conditions. When setting multi-night conditions, the premise should be to limit the starting day to Sunday and Friday so that inventory on peak days (Tuesday–Thursday) is not filled first in a cheap bucket.
Summary — Three Yardsticks for Measuring the Week at Aichi Business Hotels
To pull this together, the day-of-week shape of Aichi Prefecture business hotels in September 2026 comes down to three points. First, the day-of-week averages excluding Silver Week were Thursday 92.5%, Friday 89.5% and Sunday 84.8%; the drop from Thursday is −3.0pt on Friday and −7.7pt on Sunday, so the dip comes in two steps, Friday and Sunday. Second, limited to the first half of the month (Sep 1–18), which was not affected by the Asian Games, the figures were Thursday 91.1%, Friday 86.9% and Sunday 79.5% — the dip deepens, and the amplitude of a normal week is larger still. Third, October Sundays (the weeks of the 15th and the 22nd) are also lagging Thursday on the booking curve, and the dip continues to reappear in October. Measuring your own property’s day-of-week occupancy with the same three yardsticks (the drop versus Thursday, the depth of the normal-week dip, and the Sunday pace gap) should be the starting point for setting priorities in multi-night conditions and plan design.
Frequently Asked Questions
Q. Is estimated OCC the same as actual room occupancy?
A. No. Estimated OCC in this article is an estimate based on OTA-listed inventory, back-calculated from the number of remaining rooms listed on major booking sites. Because rooms not listed are counted as sold, it tends to come out higher than actual room occupancy. It is suited to looking at relative differences between days of the week.
Q. Why was Silver Week excluded?
A. Because September 19–23 sat at a high level of 91.7–99.9% (97.0% or higher on the 19th–22nd) on holiday demand, which is noise when the aim is to see the normal day-of-week shape. However, the Asian Games period (Sep 19–Oct 4) continued after the holidays, so second-half values include Games demand. For that reason the day-of-week averages for the first half (Sep 1–18) are shown alongside.
Q. Do you analyse price differences by day of week?
A. The estimated settled ADR used in this article is canonical at the monthly level, and no day-of-week price comparison is made. Prices are shown only as a supplementary monthly year-on-year comparison (between finalised months).
Q. What is the difference between the Friday dip and the Sunday dip?
A. Their depth and how they can be filled. In the day-of-week averages for September 2026 (excluding Silver Week), the drop from Thursday was −3.0pt on Friday and −7.7pt on Sunday; in normal weeks (Sep 1–18) it was −4.2pt on Friday and −11.6pt on Sunday. Friday can be filled from both sides — extensions of Thursday’s business demand and leisure pre-stays ahead of Saturday — while Sunday can be filled by day-before arrivals for business trips starting Monday.
Q. Is the same day-of-week shape continuing in October?
A. As far as the booking curve shows, it is continuing in the same direction. Sunday, October 25 stood at 59.0% 45 days out, 64.2% 30 days out and 70.5% 17 days out, nearly 20pt short of the Thursday of the same week (October 22; 89.2% 14 days out) (as of October 9, 2026; N=167–168 properties). However, stay dates within 30 days are current-status values, and where they land depends on the last-minute pickup.
About the Data
| Item | Details |
|---|---|
| Definition of estimated OCC | Occupancy based on OTA-listed inventory = 100 − 100 × rooms remaining on OTAs ÷ total rooms. The scope is a fixed cohort made up of properties that list at least 30% of their total rooms on OTAs (the same set of properties for each stay date; in this article the number of such properties is shown as the daily N=). It is an estimate based on how inventory sold on OTAs is being consumed, and its definition differs from actual room occupancy (it comes out higher because rooms not listed are counted as sold). |
| Booking curve | Based on observations from 45 days before the stay date to the latest. The fixed points are 45 days out, 30 days out and just before arrival. |
| Definition of estimated settled ADR | The settled price level (tax-exclusive equivalent) estimated from OTA and other sales data (lowest-plan level × a coefficient by hotel type; an ensemble of multiple channels). Past months are final values; the current and future months are estimates based on current sales conditions. The median error against published operating results is 6.6%. |
| Sold-out property share | The share of properties for which no listed inventory could be confirmed on OTAs and similar channels (estimate). |
| Scope breakdown | Day-of-week and daily estimated OCC: Aichi Prefecture business hotels, N=171–175 properties / 24,654–26,210 rooms (varies by day; September). October booking curve: N=167–168 properties / 25,665–25,672 rooms. Estimated settled ADR: Aichi Prefecture business hotels, N=321 properties (September 2026; final), N=324 properties (September 2025; final), N=310 properties (October 2026; current estimate). Occupancy and ADR are aggregated over different populations. |
| Data as of | October 9, 2026. Sales conditions and inventory change daily, so the figures in this article are a snapshot at the time of retrieval. |
Source: MetroEngines Research, compiled by HotelBank Editorial Team
References and Sources
■ Data sources
MetroEngines Research daily aggregation of estimated OCC (Aichi Prefecture business hotels; a fixed cohort of N=171–175 properties / 24,654–26,210 rooms based on inventory listed on major booking sites; last observation before each stay date from September 1 to 30, 2026), booking curves for the same cohort (stay dates October 15–18 and 22–25, 2026; N=167–168 properties; from 45 days before the stay date up to the observation of October 9, 2026), and monthly aggregation of estimated settled ADR (Aichi Prefecture business hotels; September 2025, September 2026 and October 2026).
■ Calculation assumptions
Estimated OCC is “100 − 100 × rooms remaining on OTAs ÷ total rooms,” and the sold-out property share is the share of properties for which no listed inventory could be confirmed; both use the daily number of cohort properties and rooms as the denominator. Day-of-week averages are simple averages of daily values: the full month covers 25 days excluding the five days of Silver Week (September 19–23), and the first half covers the 18 days of September 1–18. The fixed points on the booking curve are 45 days out, 30 days out, 14 days out and the latest observation; observations at lead times longer than 45 days are not used.
■ Limitations and caveats
Estimated OCC is an estimate based on how inventory listed on OTAs is being consumed, and comes out higher than actual room occupancy because rooms not listed are counted as sold. Day-of-week averages are the mean of two to four days per day of week, so a swing on a single day moves the average considerably. The second half of the month includes demand from the Asian Games (September 19–October 4) and differs from the shape of a normal week. Each October stay date is a pre-arrival observation (7–17 days out), not a final result. Estimated settled ADR is aggregated over a different population from occupancy and is not treated at day-of-week granularity.
■ Market data
| Document | Publisher |
|---|---|
| Enjoy one of Asia’s largest sporting festivals in Aichi-Nagoya! (20th Asian Games, September 19–October 4, 2026) (in Japanese) | Aichi Now, the official tourism site of Aichi Prefecture |
| 5th Asian Para Games (Aichi-Nagoya 2026), October 18–24, 2026 (in Japanese) | Aichi Now, the official tourism site of Aichi Prefecture |
| What are the Asian Para Games? (in Japanese) | Aichi Prefecture |