

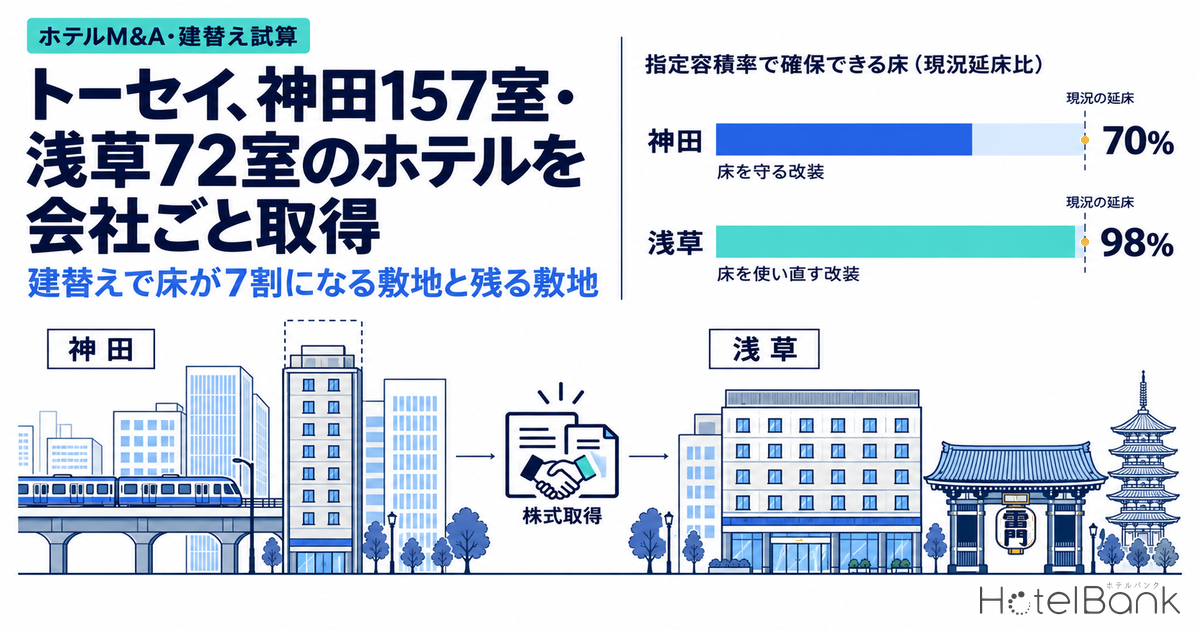
On June 30, 2026, Tosei Corporation (TSE: 8923) acquired all shares of hotel operating company Pelican Hotels Co., Ltd. from Pelican Kanko Co., Ltd., taking ownership of the two hotels that company holds: Kanda Grand Central Hotel (神田グランドセントラルホテル; Chiyoda Ward, 157 rooms, built June 1981) and Asakusa Central Hotel (浅草セントラルホテル; Taito Ward, 72 rooms, built November 1988). The acquisition price was not disclosed. But setting the site area, gross floor area and room count from the release side by side shows gross floor area per room of 22.9 m² in Kanda versus 56.0 m² in Asakusa, a gap of more than two times, and the floor area that could be secured by rebuilding at the designated floor area ratio (FAR) also splits sharply: 70% of the existing building in Kanda, 98% in Asakusa. Starting from the published specifications of the two buildings, this article models the two options that follow a whole-company purchase, “renovate and hold” and “rebuild,” against the ADR distribution, supply trend and zoning within 1 km of each station.
First, a note on how this piece differs from our earlier coverage. How operating licenses carry over under each acquisition structure, the general mechanics of why a rebuild can shrink floor area, and new-build development and supply around Senso-ji Temple have each been covered in separate HotelBank analyses. This article does not repeat that regulatory and general discussion; it is limited to applying numbers to two actual, publicly disclosed sites, floor areas and building ages. The acquisition price and yield have not been disclosed, and we do not estimate them here.
Metric Definitions Used in This Article
- ADR (average daily rate): An estimated settled rate (tax-exclusive equivalent) calculated by applying segment-specific adjustment factors to the lowest-plan price level each property publishes on OTAs (two guests per room, per-room rate, tax included). In a reconciliation against property-level actuals disclosed by listed hotel REITs (91 properties, most recent three months), the median error was about 7%. These are estimates and differ from each property’s actual settled prices and accounting figures. Area-level ADR is the median of the properties covered (the level of a typical property in the area).
- OCC (occupancy rate): The share of rooms sold out of total rooms in the area (an estimate based on OTA sales inventory). It is an estimate based on how inventory sold on OTAs is consumed, and differs from a property’s actual overall occupancy. The 85% used in the scenarios is a full-year assumption, not a measured value.
- Gross floor area per room: Total gross floor area of the building ÷ number of rooms. This is not the net area of a guest room; it is a coefficient that includes common areas such as corridors, lobby, baths and plant rooms.
- Room stock within 1 km of the station: For properties located within a 1 km radius of Kanda Station (35.6918°N, 139.7709°E) and Asakusa Station (35.7107°N, 139.7976°E) whose opening year is known, the number of properties and rooms that had opened and not yet ceased operating as of each year-end (for 2026, as of the survey date). Records at the same location with the same room count are consolidated into one property. This is a count within the scope tracked by MetroEngines Research, not a complete census.
- Properties in the ADR distribution: Within the 1 km catchments above, properties for which estimated settled ADR was available for at least 10 months between September 2025 and August 2026 (excluding the two acquired hotels). Kanda Station catchment N=56 properties / 8,537 rooms; Asakusa Station catchment N=60 properties / 7,506 rooms.
- Data sources: MetroEngines Research & Consulting; Ministry of Land, Infrastructure, Transport and Tourism (MLIT) Real Estate Information Library; Ministry of Internal Affairs and Communications / Ministry of Economy, Trade and Industry Economic Census
- — A whole-company acquisition: Tosei acquired all shares of Pelican Hotels on June 30, 2026, taking over the 157-room Kanda and 72-room Asakusa hotels while they continue to trade. The acquisition price is undisclosed.
- — Reproducible floor area is 70% and 98%: A simple site area × designated FAR calculation gives 70.3% of existing gross floor area in Kanda (2,524 m²) and 97.7% in Asakusa (3,941 m²).
- — Supply is flat versus 2.1x: Rooms within 1 km of the station are −3.1% in Kanda and +23.9% in Asakusa versus 2019. Over the 10 years from 2016, Kanda is 1.39x and Asakusa 2.09x.
- — Renovation payback in Kanda is 5.5–8.8 years: Modeled on a renovation cost of ¥450,000 per tsubo (approx. 3.3 m²), assuming ADR moves up one quartile within its size band. Asakusa comes out at 8.5–16.6 years (occupancy assumed at 85% year-round, GOP margin 40%).
- — Little reason to rush a rebuild: Kanda falls to 110 rooms and GOP drops ¥95 million a year; Asakusa rises to 112 rooms and gains ¥104 million a year, but simple payback on the incremental GOP is 34.8 years.
What Was Acquired — Not Real Estate, but the Shares of the Company That Owns and Operates Both Hotels
We begin with the disclosed facts. The target, Pelican Hotels, was established on August 14, 2025 with capital of ¥1 million, and appears to be a vehicle the seller, Pelican Kanko, set up to house its hotel business. Tosei acquired all of its shares, made it a wholly owned subsidiary, and brought the ownership and operation of both hotels into the group. According to Tosei, this is its second acquisition of a hotel run by another operator together with the business itself, following Tosei Hotel & Seminar Makuhari. As background, the release cites rising real estate prices for both new and existing properties amid soaring construction costs, and explains that the company is “diversifying its property acquisition methods through M&A of real estate and real estate-related businesses, business succession support and other means.”
| Item | Kanda Grand Central Hotel | Asakusa Central Hotel |
|---|---|---|
| Location | 2-2 Kanda-Tsukasamachi, Chiyoda Ward | 1-5-3 Asakusa, Taito Ward (on Kaminarimon-dori) |
| Access | 3-minute walk from Kanda Station (Tokyo Metro Ginza Line / JR) | 3-minute walk from Asakusa Station (Tokyo Metro Ginza Line) / 5-minute walk from the Toei Asakusa Line |
| Structure and scale | Steel / reinforced concrete; 1 basement level, 11 floors above ground | Steel / reinforced concrete; 2 basement levels, 8 floors above ground |
| Site area (registered) | 420.62 m² | 563.06 m² |
| Gross floor area | 3,589.66 m² | 4,033.69 m² |
| Rooms | 157 rooms | 72 rooms |
| Built | June 1981 | November 1988 |
| Gross floor area per room (calculated here) | 22.9 m² | 56.0 m² |
| Gross floor area ÷ site area (calculated here) | approx. 8.5x | approx. 7.2x |
Source: Compiled by MetroEngines Research & Consulting from Tosei, “M&A of Hotel Business: Acquisition of Two Well-Located Hotels Near Kanda and Asakusa Stations” (June 30, 2026). Gross floor area ÷ site area is a simple ratio that includes basement floors and the like; it is not the FAR itself
The significance of buying shares is that the “operating state” comes with the building. When real estate is acquired outright or as a trust beneficiary interest, the licensed operator under the Inns and Hotels Act remains the seller, and the buyer needs approval of a succession or a new license in order to operate. By contrast, when the shares of the operating company are acquired, the legal entity that is the operator does not change, so the hotel license, employment relationships with staff, booking-channel contracts and the accumulated guest reviews all carry over with the company. For the seller, too, transferring a company into which the hotel business has been carved out is a way to look for a successor while keeping its other businesses in hand. The regulatory detail and the impact of days of suspended operation are outside the scope of this article; below we move on to the options after acquisition.
On post-acquisition policy, the release states that “because the buildings are aging at 45 and 38 years old,” Tosei will “consider value-add measures and accommodation plan design that leverage the potential of the locations and further raise business earnings.” In other words, what has been disclosed at this point is a direction of raising value while continuing to operate; a rebuild is not mentioned. We model a rebuild alongside it because it is the option that is always compared as the exit for a long-term hold.
Location Assessment — Kanda With 480,000 Workers, and Kaminarimon-dori Where Land Prices Doubled in Five Years
Both hotels are a three-minute walk from their nearest station, but the character of the surrounding districts is a study in contrast. Economic Census data on employment within 1 km of the station show 482,115 workers around Kanda Station (17,876 establishments, of which office-type employment accounts for 42.0%) and 55,765 around Asakusa Station (6,042 establishments, 16.4%), a difference of about 8.6 times. Kanda is a business district where a deep working population supports weekday business-travel demand, while Asakusa is a tourist district centered on Kaminarimon Gate and Senso-ji Temple.
Source: MetroEngines Research & Consulting (properties in the ADR distribution: Kanda Station catchment N=56, Asakusa Station catchment N=60). ★ = the two acquired hotels; dashed line = 1 km radius from each station; circle size = room count; color = estimated settled ADR band over the latest 12 months
| Location indicator | Kanda (Kanda-Tsukasamachi 2-chome) | Asakusa (Asakusa 1-chome) |
|---|---|---|
| Zoning | Commercial district | Commercial district |
| Designated FAR / building coverage ratio | 600% / 80% | 700% / 80% |
| Fire protection designation | Fire prevention district | Fire prevention district |
| Nearby official land price point (2026) | Kanda-Tsukasamachi 2-19-25: ¥2.72 million/m² (+20.4% YoY) | Asakusa 1-1-2: ¥9.15 million/m² (+27.6% YoY) |
| Same point, 2021→2026 | ¥1.68 million→¥2.72 million (1.62x) | ¥4.40 million→¥9.15 million (2.08x) |
| Frontage road width at the same point | 8.0 m (ward road) | 27.0 m (ward road) |
| Workers within 1 km of the station | 482,115 (office-type 42.0%) | 55,765 (office-type 16.4%) |
| Assumed flood inundation (Arakawa River) | Inside the zone; assumed depth category of under 0.5 m | Inside the zone; assumed depth category of 0.5 m to under 3.0 m |
Source: Compiled by MetroEngines Research & Consulting from the MLIT Real Estate Information Library (zoning, fire prevention districts, official land prices, assumed flood inundation zones) and the Ministry of Internal Affairs and Communications / Ministry of Economy, Trade and Industry Economic Census for Business Activity (2021). Zoning is determined at each hotel’s location. Worker counts are establishment-based, not resident population
Both sites are zoned commercial and lie in fire prevention districts; the designated FAR is 600% at the Kanda-Tsukasamachi 2-chome location and 700% at the Asakusa 1-chome location. Land price trends also differ. The official land price point in Kanda-Tsukasamachi 2-chome stood at ¥2.72 million/m² in 2026, up 20.4% year on year, and the point in Asakusa 1-chome at ¥9.15 million/m², up 27.6%; Kanda has risen by about 20% for two consecutive years, and Asakusa has kept rising by close to 30%. Over the five years from 2021, the Kanda point is up 1.62x and the Asakusa point 2.08x. It is precisely because the cost of buying land and building new has moved this much that acquiring an already-standing hotel, company and all, has come onto the table as an option. Note that both locations fall within the assumed flood inundation zone of the Arakawa River, so the placement of electrical and plant rooms becomes an item to review when equipment is renewed or the building is rebuilt.
Supply Environment — Kanda Flat Since 2019, Asakusa Up 2.1x in 10 Years
Even for the same “existing hotel three minutes from the station,” supply in the surrounding area has behaved completely differently. Room stock within 1 km of Kanda Station rose from 53 properties and 7,604 rooms in 2016 to 90 properties and 10,878 rooms in 2019, and stands at 97 properties and 10,541 rooms in 2026, essentially flat at −3.1% versus 2019. Properties that opened in 2020 or later total 19 with 1,079 rooms, while those that ceased operating over the same period total 12 with 1,416 rooms: a mature market in which entries and exits offset each other.
The 1 km catchment of Asakusa Station, by contrast, grew from 77 properties and 5,111 rooms in 2016 to 192 properties and 10,686 rooms in 2026, 2.09x in 10 years. Since 2019 alone the net increase is 58 properties and 2,058 rooms (+23.9%). A room count that was about two-thirds of the Kanda catchment a decade ago is now on the same scale. In Asakusa, even when acquiring an existing hotel, ADR has to be set on the premise that new competitors will keep appearing nearby, and this is the major difference from Kanda. The structure in which Taito Ward as a whole has many properties while ADR stays mid-tier is laid out in Why Taito Ward Has Tokyo’s Most Hotels.
Source: MetroEngines Research & Consulting (based on confirmed OTA listings; as of 2026, Kanda Station catchment N=97 properties, Asakusa Station catchment N=192 properties). As of each year-end; 2026 is as of the survey date. Current room counts are applied to past years, so changes in room count from extensions or alterations are not reflected
ADR Levels — Ward Medians of ¥16,300 in Chiyoda and ¥14,400 in Taito, With a ¥4,600–7,200 Step Between Quartiles in the Same Size Band
Next, we check ADR in the markets the two hotels belong to. Ward-level estimated settled ADR, averaged over the latest 12 months (September 2025–August 2026), was ¥16,300 in Chiyoda Ward (monthly N=78–84 properties) and ¥14,400 in Taito Ward (N=161–177 properties). Compared with the same period a year earlier (September 2024–August 2025), Chiyoda is up 6.1% and Taito up 4.2%. The most recent summer has been soft, however: August 2026 came in at ¥12,600 in Chiyoda (−10.9% YoY) and ¥11,600 in Taito (−7.2%), below the prior year for three consecutive months from June. The size of the swing against a peak month such as April (Chiyoda ¥20,300, +7.0%) is something to keep in mind when setting an annual revenue plan.
Source: MetroEngines Research & Consulting (estimated settled ADR, ward median; Chiyoda N=78–84 properties, Taito N=161–177 properties). 2026 runs through September, the latest finalized month
Ward medians alone do not give a benchmark for the specific scales of 157 and 72 rooms. We therefore split the properties within 1 km of each station by room-count band and took quartiles of estimated settled ADR over the latest 12 months. In the Kanda catchment, the 100–199 room band (N=33) has a 25th percentile of ¥13,500, a median of ¥16,400 and a 75th percentile of ¥20,900, a distance of about ¥4,600 from the median to the 75th percentile. In the Asakusa catchment, the 50–99 room band (N=13) shows ¥13,500, ¥17,200 and ¥24,400 respectively, and the gap between the median and the 75th percentile is larger still at about ¥7,200. In Asakusa the 75th percentile of the small band of 49 rooms or fewer reaches the ¥40,000 range: a group of properties selling large rooms that sleep multiple guests at high rates forms the upper side of the distribution.
| Room-count band | Kanda catchment N | 25th pct / Median / 75th pct | Median of those opened 2016 or later | Asakusa catchment N | 25th pct / Median / 75th pct | Median of those opened 2016 or later |
|---|---|---|---|---|---|---|
| 49 rooms or fewer | 2 | ¥12,578 / ¥16,034 / ¥19,490 | — (N=0) | 16 | ¥12,696 / ¥18,248 / ¥41,303 | ¥20,217 (N=11) |
| 50–99 rooms | 11 | ¥12,251 / ¥13,127 / ¥15,306 | ¥15,268 (N=5) | 13 | ¥13,496 / ¥17,187 / ¥24,427 | ¥18,095 (N=12) |
| 100–199 rooms | 33 | ¥13,514 / ¥16,368 / ¥20,937 | ¥16,373 (N=19) | 20 | ¥12,741 / ¥14,998 / ¥23,534 | ¥18,524 (N=14) |
| 200 rooms or more | 10 | ¥14,742 / ¥17,466 / ¥19,885 | — (N=2) | 11 | ¥11,564 / ¥12,195 / ¥22,540 | ¥12,157 (N=8) |
| All | 56 | ¥13,075 / ¥15,744 / ¥19,826 | — | 60 | ¥12,213 / ¥17,288 / ¥24,772 | — |
Source: MetroEngines Research & Consulting (estimated settled ADR, September 2025–August 2026 average; excluding the two acquired hotels, Kanda catchment N=56, Asakusa catchment N=60). Medians are not shown for categories with N under 5
Source: MetroEngines Research & Consulting (Kanda catchment N=56, Asakusa catchment N=60, excluding the two acquired hotels). Properties with more than 400 rooms or above ¥50,000 (1 in the Kanda catchment, 5 in the Asakusa catchment) fall outside the chart range. The vertical lines mark the room counts of the two acquired hotels and do not indicate their own ADR
For a reference point on how far renovation translates into rate, we also drew on guest reviews. We took 17 business hotels in the two catchments that opened in 2005 or earlier (excluding the two acquired hotels) and split them by the share of reviews over the latest 24 months (October 2024–September 2026) making positive mention of the rooms, such as being renovated and clean, or new. The five properties with a mention rate of 1% or higher (88 such mentions in 5,229 reviews) have a median estimated settled ADR of ¥19,600, against ¥13,600 for the 12 properties with a mention rate under 1% or no such mentions found, a difference of about ¥6,000. The sample is small and differences in location and brand are mixed in, so this does not demonstrate causation, but it does show that even in buildings more than 20 years past opening, the group whose room condition is rated well sells at a level close to the 75th percentile of its size band (Source: HotelBank Editorial Team research, NLP analysis).
Renovate and Hold — Kanda Pays Back in 5–9 Years on Its Room Count; in Asakusa the Question Is How to Use the Large Floor Area
From here we turn to the scenarios. When the existing building is kept, there are two variables: how much is spent on renovation, and how far ADR rises within the distribution of the same size band. We assumed three levels of renovation cost per tsubo of gross floor area: ¥300,000, ¥450,000 and ¥600,000. These are assumptions made for this article, taking as the approximate lower bound the full guest-room renovation component used in an earlier HotelBank estimate (¥4.5 million per room at 45 m² of gross floor area per room, equivalent to ¥330,000 per tsubo), and as the upper bound the middle of the range for conversion works involving a change of use (¥400,000–800,000 per tsubo); they are not the actual works plans for the two hotels. Occupancy is fixed at 85% year-round and the GOP margin at 40% (with reference to the 38.9% actual for the fiscal period ended December 2024 at MHM-operated hotels disclosed by Invincible Investment Corporation (インヴィンシブル投資法人)). For reference, our estimated occupancy (based on OTA-listed inventory; an estimate) for the months of June–September 2026 was 88.9–91.9% in Chiyoda Ward (58–59 properties / 8,790–8,862 rooms covered, based on listings on major booking sites) and 89.6–91.8% in Taito Ward (143–146 properties / 13,247–13,647 rooms covered, same basis).
| Item | Kanda (157 rooms) | Asakusa (72 rooms) |
|---|---|---|
| Gross floor area | 3,589.66 m² (1,085.9 tsubo) | 4,033.69 m² (1,220.2 tsubo) |
| Renovation cost: ¥300,000 / ¥450,000 / ¥600,000 per tsubo | ¥326M / ¥489M / ¥652M | ¥366M / ¥549M / ¥732M |
| Renovation cost per room (¥450,000 per tsubo) | ¥3.11M | ¥7.63M |
| Size band referenced | 100–199 rooms (N=33) | 50–99 rooms (N=13) |
| Annual room revenue at 25th pct / median / 75th pct ADR | ¥658M / ¥797M / ¥1,020M | ¥301M / ¥384M / ¥546M |
| Incremental GOP if ADR rises from 25th pct to median | ¥56M per year (+¥2,854) | ¥33M per year (+¥3,691) |
| Simple payback on renovation cost (¥300,000 / ¥450,000 / ¥600,000 per tsubo) | 5.9 yrs / 8.8 yrs / 11.7 yrs | 11.1 yrs / 16.6 yrs / 22.2 yrs |
| Incremental GOP if ADR rises from median to 75th pct | ¥89M per year (+¥4,569) | ¥65M per year (+¥7,240) |
| Simple payback on renovation cost (¥300,000 / ¥450,000 / ¥600,000 per tsubo) | 3.7 yrs / 5.5 yrs / 7.3 yrs | 5.7 yrs / 8.5 yrs / 11.3 yrs |
Source: MetroEngines Research & Consulting estimates. Occupancy 85% (full-year assumption), GOP margin 40%, 365 days a year. ADR applies the quartiles of the same size band and is not the actual performance of the two acquired hotels. Revenue lost to rooms taken out of sale during works is not included. This is a simplified estimate; actual investment decisions require a detailed feasibility study
In Kanda, the way the floor is used, at 22.9 m² of gross floor area per room, is itself the strength. With 157 rooms, a one-quartile rise in ADR within the size band alone lifts annual incremental GOP to ¥56–89 million, and a renovation at ¥450,000 per tsubo (¥489 million in total, ¥3.11 million per room) pays back in 5.5–8.8 years on this calculation. Given a business district with 480,000 workers where supply is not growing, the case for renewing interiors, wet areas and building systems while keeping the room count looks the stronger one. The effect of rooms taken out of sale during works, which is not included here, has been estimated in a separate HotelBank analysis at 32.6% of construction cost in lost revenue.
Asakusa is a different picture. With 4,033.69 m² of gross floor area for 72 rooms, a renovation cost that scales with floor area is heavy at ¥7.63 million per room (¥450,000 per tsubo): payback takes 8.5 years even where ADR rises from the median to the 75th percentile, and 16.6 years where it rises from the 25th percentile to the median. Put the other way round, Asakusa’s upside lies in the very size of its floor, at 56.0 m² per room. The choice is between refitting the large rooms for families and groups to target the upper side of the distribution (the 75th percentile of ¥24,400 and above), or converting part of the common areas into guest rooms to add keys. A simple calculation for the latter gives 89 rooms at 45 m² of gross floor area per room, and 115 rooms at 35 m², the average level for new-build plans (the per-room floor area across 31 planned projects). The two basement levels cannot be turned into guest rooms, so this is no more than an indication of the upper limit, but at the median ADR each additional room adds about ¥2.13 million in annual GOP, and the effect of spreading renovation cost across more rooms is large.
Rebuild — At the Designated FAR, Kanda Gets 2,524 m² (70% of Existing) and Asakusa 3,941 m² (98%)
The first thing to establish in a rebuild is whether today’s floor area can be reproduced in a new building. Multiplying the designated FAR by the registered site area gives 420.62 m² × 600% = 2,524 m² for Kanda, 70.3% of the existing gross floor area of 3,589.66 m², and 563.06 m² × 700% = 3,941 m² for Asakusa, 97.7% of the existing 4,033.69 m². Existing gross floor area may include basement floors and portions not counted toward FAR, so this comparison alone cannot establish how the current buildings stand in relation to the regulations. Nor can the rules in force or the content of permits at the time of construction be determined from public materials. Even so, the difference in direction can be read off: in Kanda a rebuild is likely to shrink the floor by around 30%, while in Asakusa roughly the same floor area can be expected.
Source: Compiled by MetroEngines Research & Consulting from the Tosei release (June 30, 2026) and the MLIT Real Estate Information Library (zoning). Maximum floor area = registered site area × designated FAR. Limits from frontage road width, slant-line and height restrictions, and areas excluded from FAR are not considered
In addition, on sites of 420 m² and 563 m², frontage road width starts to bite. In a commercial district, where the frontage road is under 12 m wide, the FAR is capped at the lower of “width × 0.6” and the designated FAR. The frontage road width of the Kanda site cannot be confirmed from public materials, but the frontage roads of the three official land price and prefectural benchmark points within 200 m that carry a designated FAR of 600% are 11.0 m, 8.0 m and 8.0 m. At a width of 10 m or more the full 600% can be used; at 8 m it falls to 480% (a separate HotelBank analysis shows how a 4 m frontage road cuts a 600% FAR to 240% and what that does to land cost). For Asakusa, the release states explicitly that the hotel “faces Kaminarimon-dori,” and the frontage roads of the two nearby land price points (124 m and 287 m away) are both 27.0 m wide, so it is reasonable to regard this as a location where the full 700% applies.
| Frontage road width | Kanda: applicable FAR | Max floor area (vs existing) | Rooms at 22.9 m²/room | Asakusa: applicable FAR | Max floor area (vs existing) | Rooms at 35.0 m²/room |
|---|---|---|---|---|---|---|
| 6 m | 360% | 1,514 m² (42.2%) | 66 rooms | 360% | 2,027 m² (50.3%) | 57 rooms |
| 8 m | 480% | 2,019 m² (56.2%) | 88 rooms | 480% | 2,703 m² (67.0%) | 77 rooms |
| 10 m | 600% | 2,524 m² (70.3%) | 110 rooms | 600% | 3,378 m² (83.8%) | 96 rooms |
| 12 m or more | 600% | 2,524 m² (70.3%) | 110 rooms | 700% | 3,941 m² (97.7%) | 112 rooms |
Source: MetroEngines Research & Consulting estimates from Article 52 of the Building Standards Act and the MLIT Real Estate Information Library. Relaxation based on distance to a specified road, slant-line and height restrictions, and areas excluded from FAR are not considered. Room counts are scenario figures set against the existing 157 and 72 rooms
Tokyo also has an FAR bonus aimed at the development of accommodation facilities, but its operation presupposes redevelopment promotion districts, specified blocks or high-level use districts, and it is not a scheme that applies as-is to a single stand-alone site. Below, therefore, we set out the economics of a rebuild taking as the base case a frontage road wide enough for the designated FAR to be the cap. Demolition cost uses a base of ¥90,000 from the range of five actual contract amounts published by local governments (¥51,025–146,983 per m² of gross floor area); new-build cost is ¥2.405 million per tsubo for steel construction, based on building starts statistics (2025); and the suspension of operations is set at 30 months, reflecting about 10 months of demolition and a median construction period of 1.96 years for single-use hotels. Inflation over the construction period of +4.5–5.3% a year (+5.3% in 2026, +5.0% in 2027, +4.5% from 2028) is built in up to 2029, the midpoint of spending, and a factor of 1.207 is applied to the new-build cost.
| Rebuild estimate | Kanda (600%, 110 rooms) | Asakusa (700%, 112 rooms) |
|---|---|---|
| Gross floor area after rebuild (FAR-countable) | 2,524 m² (763.4 tsubo) | 3,941 m² (1,192.3 tsubo) |
| Room count assumption | 110 rooms (22.9 m²/room, same as existing) | 112 rooms (35.0 m²/room) |
| (a) Demolition cost: base ¥90,000/m² (range) | ¥323M (¥183M–¥528M) | ¥363M (¥206M–¥593M) |
| (b) New-build cost: steel, ¥2.405M per tsubo | ¥1,836M | ¥2,867M |
| With inflation (×1.207) | ¥2,217M | ¥3,462M |
| (c) GOP forgone over 30 months of closure | ¥797M | ¥384M |
| (a)+(b)+(c) total | ¥2,956M | ¥3,614M |
| Total with inflation | ¥3,337M | ¥4,209M |
| ADR assumption after rebuild (same catchment, opened 2016 or later, median of 100–199 rooms) | ¥16,373 (N=19) | ¥18,524 (N=14) |
| Annual room revenue / GOP after rebuild | ¥559M / ¥224M | ¥644M / ¥257M |
| Existing (median ADR of same size band) annual room revenue / GOP | ¥797M / ¥319M | ¥384M / ¥154M |
| Change in GOP | −¥95M per year | +¥104M per year |
| ADR needed to match existing revenue | ¥23,362 (1.43x the median) | — (exceeded through added rooms) |
| Simple payback on incremental GOP | — | 34.8 years (40.5 years after inflation) |
Source: MetroEngines Research & Consulting estimates. Demolition cost is from actual amounts published by local governments as reported in earlier HotelBank coverage; new-build cost is based on MLIT building starts statistics (archi-book compilation, 2025); construction period is from a tabulation of the MLIT Survey on Building Dynamics. Occupancy 85% (full-year assumption), GOP margin 40%. A simplified estimate that excludes the acquisition price of the land and shares
The result for Kanda is clear-cut. If the floor falls to 70%, even a design at the same efficiency of 22.9 m² per room yields only 110 rooms, a loss of 47 rooms and ¥239 million a year in revenue. In the Kanda catchment, the median for 100–199 room properties opened in 2016 or later is ¥16,400, almost identical to the ¥16,400 median for the size band as a whole. This is a market where being new does not in itself promise a rate premium; to match existing revenue after a rebuild would take ¥23,400, a level above the 75th percentile of the size band (¥20,900). For the Kanda site, the 3,589.66 m² of floor area standing there today is itself an asset that a rebuild would struggle to recover.
Asakusa can largely keep its floor area, and a design at 35 m² per room would raise the room count from 72 to 112, taking revenue from ¥384 million to ¥644 million on this calculation. But against the ¥3.614 billion for demolition, new build and closure combined (¥4.209 billion after inflation), incremental GOP is ¥104 million a year, and simple payback on the increment alone takes 34.8 years. As long as construction costs remain at current levels, a rebuild in Asakusa too stays an option that “can be chosen at any time but offers little reason to hurry,” and for now the plan that comes first is likely to be converting the size of the floor into earnings through renovation and a review of the room mix. Rising construction costs also work to hold back new supply nearby, which makes time an ally for those who already hold existing floor area.
Source: MetroEngines Research & Consulting estimates (occupancy 85% [full-year assumption]; ADR applies the median, 75th percentile and median of properties opened 2016 or later for the same size band within 1 km of the station. Not the actual performance of the two acquired hotels)
The Two Scenarios Side by Side — Kanda: a Renovation That Protects the Floor; Asakusa: a Renovation That Reuses the Floor Comes First
To sum up so far, the two hotels were obtained through the same acquisition structure, yet the best answer after acquisition differs. Kanda already has a high room count and floor efficiency, and a rebuild would reduce its floor, so the advantage of renovating and holding is clear. In Asakusa the floor survives a rebuild, but the level of construction costs lengthens the payback, so a renovation that exploits the large floor comes first and a rebuild remains as a future option.
| Comparison item | Kanda: renovate and hold Favored in the scenario | Kanda: rebuild | Asakusa: renovate and hold Favored in the scenario | Asakusa: rebuild |
|---|---|---|---|---|
| Rooms | 157 rooms | 110 rooms | 72 rooms (89 at 45 m²/room) | 112 rooms |
| Additional investment | ¥326M–¥652M | ¥2,956M (incl. closure) | ¥366M–¥732M | ¥3,614M (incl. closure) |
| Suspension of operations | Phased, while operating | 30 months | Phased, while operating | 30 months |
| Annual room revenue benchmark | ¥797M→¥1,020M | ¥559M | ¥384M→¥546M | ¥644M |
| Indicative payback | 5.5–8.8 years (¥450,000 per tsubo) | ADR to match existing revenue: ¥23,362 | 8.5–16.6 years (¥450,000 per tsubo) | 34.8 years (incremental GOP) |
| Key assumption | Whether ADR moves up one step within its size band | Frontage road width; whether any FAR exception applies | Productizing the large rooms; adding keys | Level of construction costs; new supply within 1 km |
Source: MetroEngines Research & Consulting estimates. Assumptions are the same as in the tables in each section
We also check the range if the assumptions move. GOP when holding at the median ADR of the same size band is ¥319 million a year for Kanda and ¥154 million for Asakusa. A 10% fall in ADR gives ¥287 million for Kanda and ¥138 million for Asakusa; a 5-point fall in occupancy gives ¥300 million and ¥145 million; and both together give ¥270 million and ¥130 million. In a phase like June–August 2026, when ward ADR ran 4–11% below the prior year for successive months, note that the renovation payback period lengthens in the same proportion.
| Sensitivity (held at median ADR) | Base | ADR −10% | OCC −5pt | Both |
|---|---|---|---|---|
| Kanda 157 rooms: annual room revenue | ¥797M | ¥718M | ¥750M | ¥675M |
| Kanda 157 rooms: GOP | ¥319M | ¥287M | ¥300M | ¥270M |
| Asakusa 72 rooms: annual room revenue | ¥384M | ¥346M | ¥361M | ¥325M |
| Asakusa 72 rooms: GOP | ¥154M | ¥138M | ¥145M | ¥130M |
Source: MetroEngines Research & Consulting estimates (base: Kanda ¥16,368, Asakusa ¥17,187; occupancy 85% [full-year assumption]; GOP margin 40%)
Widening the combinations of ADR and occupancy, annual GOP for the two hotels falls within the following range. Even in the combination where ADR falls 10% and occupancy drops to 75%, Kanda is left with ¥253 million and Asakusa with ¥122 million of annual GOP on this calculation, and the cushion against a renovation cost of ¥450,000 per tsubo (¥489 million for Kanda, ¥549 million for Asakusa) is thicker for Kanda with its larger room count.
| Full-year occupancy level | ADR −10% | ADR −5% | ADR ±0% | ADR +5% | ADR +10% |
|---|---|---|---|---|---|
| 75% | ¥253M / ¥122M | ¥267M / ¥129M | ¥281M / ¥136M | ¥295M / ¥142M | ¥310M / ¥149M |
| 80% | ¥270M / ¥130M | ¥285M / ¥137M | ¥300M / ¥145M | ¥315M / ¥152M | ¥330M / ¥159M |
| 85% (this article’s assumption) | ¥287M / ¥138M | ¥303M / ¥146M | ¥319M / ¥154M | ¥335M / ¥161M | ¥351M / ¥169M |
| 90% | ¥304M / ¥146M | ¥321M / ¥154M | ¥338M / ¥163M | ¥355M / ¥171M | ¥371M / ¥179M |
Source: MetroEngines Research & Consulting estimates (base ADR: Kanda ¥16,368, Asakusa ¥17,187 = median of the same size band within 1 km of the station; GOP margin 40%; 365 days a year). Each cell is shown as Kanda / Asakusa. Not the actual performance of the two acquired hotels
| Item to confirm | Detail | Option affected |
|---|---|---|
| Frontage road width | Under 12 m, FAR is capped at width × 0.6. For Kanda, confirmation in the road register is a prerequisite | Rebuild |
| Seismic and equipment history | Not stated in the release, and the renovation costs in this article do not include seismic work or major equipment renewal. The applicable standard cannot be judged from the construction date alone | Renovation and rebuild |
| Construction cost movement | At +5% a year, new-build cost is about 1.2x after four years. The total moves with the timing of construction start | Rebuild |
| Nearby supply | The 1 km catchment of Asakusa Station is +23.9% since 2019. The Kanda catchment is −3.1% | ADR after renovation |
| Seasonal swing | Ward ADR differs by 1.6x between April and August (Chiyoda ¥20,291 versus ¥12,566) | Annual revenue assumption |
Source: Compiled by MetroEngines Research & Consulting
Implications for Sellers, Buyers and Lenders — Three Numbers From the Property Summary Narrow the Options
What these two hotels show is that simply overlaying the designated FAR on three numbers from a property summary, site area, gross floor area and room count, narrows the post-acquisition options considerably. For an owner considering a sale or succession, if the building stands on “a site where a rebuild would shrink the floor,” the existing gross floor area is itself a value that can be pitched to buyers. If the operating company is separated out and transferred by way of shares, the buyer can take over without stopping operations, which arguably widens the entry point for negotiations as well.
On the buyer’s side, the working view that a building with a small gross floor area per room grows earnings through its room count, and one with a large area through reusing its floor, is worth testing against the ADR distribution of the same size band before acquisition. In a market like the Kanda catchment, where the ADR gap between new and existing properties is small, a plan to move up one step in the distribution through renovation carries more certainty than a rebuild. In a market like the Asakusa catchment, where supply keeps growing, deciding early on large rooms as the axis of differentiation is likely to be effective.
For financial institutions considering lending, the two items to confirm are “the floor area if rebuilt,” which underlies the collateral valuation, and “where ADR sits in the distribution,” which underlies the business plan. Items this article could not cover, such as frontage road width and seismic and equipment history, must be confirmed on site and in the registers. While construction costs stay elevated, whole-company acquisitions of existing hotels look set to continue, and opportunities to compare deals with the same yardstick are likely to increase.
Frequently Asked Questions
| How much did Tosei pay for the Kanda and Asakusa hotels? | The acquisition price has not been disclosed. This article does not estimate the acquisition price or yield either; the scenarios are limited to the relationship between renovation, demolition and new-build costs and room revenue. |
| What carries over when a hotel is bought through shares? | Because the legal entity that is the operator does not change, the hotel license, employment relationships, booking-channel contracts and so on carry over with the company. When only the real estate is acquired, the buyer needs approval of a succession or a new license. |
| Does a rebuild reduce the number of rooms? | On a simple calculation of site area multiplied by the designated FAR, Kanda comes to 70.3% of existing gross floor area (110 rooms at the same floor efficiency) and Asakusa to 97.7%. The result changes with frontage road width and site-specific rules. |
Note on the scenarios and ADR data: The scenarios in this article are simplified estimates combining the disclosed property summaries, public statistics and the estimated settled ADR of the same size band within 1 km of each station; they do not represent the actual ADR, occupancy or works plans of the two acquired hotels. Estimated settled ADR uses finalized months through September 2026; values for future months based on listed price levels at the time of the survey are not used.
Related Articles
| Japan’s Pre-1981 Hotel Stock: 236k Rooms, 19.1% — Retrofit or Rebuild |
| Hotel Build Times: 2.80-Year Median, 1.96 Solo vs 4.00 Mixed-Use |
References and Sources
■ Data sources
Property summaries are the figures disclosed in Tosei’s news release (June 30, 2026). Estimated settled ADR is compiled by MetroEngines Research & Consulting: at ward level, Chiyoda N=78–84 properties and Taito N=161–177 properties (September 2025–August 2026); within 1 km of the stations, Kanda N=56 properties and Asakusa N=60 properties (excluding the two acquired hotels). Room stock covers properties within 1 km of the stations whose opening year is known (2026: Kanda 97 properties, Asakusa 192 properties). Zoning, official land prices and assumed flood inundation are from the MLIT Real Estate Information Library; worker counts are from the Economic Census for Business Activity (2021).
■ Scenario assumptions
Occupancy 85% (a full-year assumption), GOP margin 40%, 365 days a year. Renovation cost at three levels per tsubo of gross floor area: ¥300,000, ¥450,000 and ¥600,000. For the rebuild, demolition cost of ¥90,000/m² (range ¥51,025–146,983), new-build cost of ¥2.405 million per tsubo for steel construction (2025), 30 months of suspended operations and a construction-period inflation factor of 1.207. Room rates apply the 25th percentile, median and 75th percentile of the same size band within 1 km of the station; after a rebuild, the median of properties in the same catchment opened in 2016 or later is used. Maximum floor area after a rebuild is calculated as registered site area × designated FAR.
■ Limitations and caveats
The acquisition price and yield have not been disclosed and are not estimated in this article. ADR, occupancy and GOP margin are none of them the actual performance of the two acquired hotels. The scenarios do not include the reduction in FAR from frontage road width, slant-line and height restrictions, areas excluded from FAR, the cost of seismic work and major equipment renewal, revenue lost to rooms taken out of sale during works, or the acquisition price of the land and shares. Room stock is a count within the scope we could track, not a complete census, and current room counts are applied to past years. The relationship between reviews and ADR is a comparison of 17 properties and does not demonstrate causation.
■ News and press releases
- Tosei, “M&A of Hotel Business: Acquisition of Two Well-Located Hotels Near Kanda and Asakusa Stations — Acquisition of All Shares of Pelican Hotels Co., Ltd.” (June 30, 2026; in Japanese)
- Nikkei Company Information DIGITAL, timely disclosure: “Tosei: M&A of Hotel Business, Acquisition of Two Well-Located Hotels Near Kanda and Asakusa Stations” (June 30, 2026; in Japanese)
- Tosei Corporation corporate website
■ Market data
- MetroEngines Research & Consulting — Estimated settled ADR (Chiyoda N=78–84 properties, Taito N=161–177 properties; within 1 km of the stations, Kanda N=56, Asakusa N=60), room stock within 1 km of the stations (2026: Kanda 97 properties, Asakusa 192 properties), estimated occupancy (Chiyoda 58–59 properties, Taito 143–146 properties)
- HotelBank Editorial Team research (NLP analysis) — Mentions of guest rooms in guest reviews (October 2024–September 2026; 17 business hotels opened in 2005 or earlier)
■ Government statistics and public data
- MLIT Real Estate Information Library — zoning, fire prevention districts, official land prices, prefectural land price survey, assumed flood inundation zones
- Ministry of Internal Affairs and Communications / Ministry of Economy, Trade and Industry, Economic Census for Business Activity (2021) — number of establishments and workers
- MLIT, Survey of Building Construction Starts — construction cost by structure type (archi-book compilation, 2025 data)
- Building Standards Act, Article 52 (floor area ratio) — e-Gov Law Search
■ REIT and industry reports
- Invincible Investment Corporation (8963) hotel portfolio — GOP performance of MHM-operated hotels (fiscal period ended December 2024: 38.9%)
- HotelBank, analysis of hotel rebuild demolition costs (¥51,000–147,000 per m²) — five actual demolition contract amounts published by local governments
- HotelBank, “Hotel Build Times: 2.80-Year Median, 1.96 Solo vs 4.00 Mixed-Use” — tabulation of construction periods from the MLIT Survey on Building Dynamics