

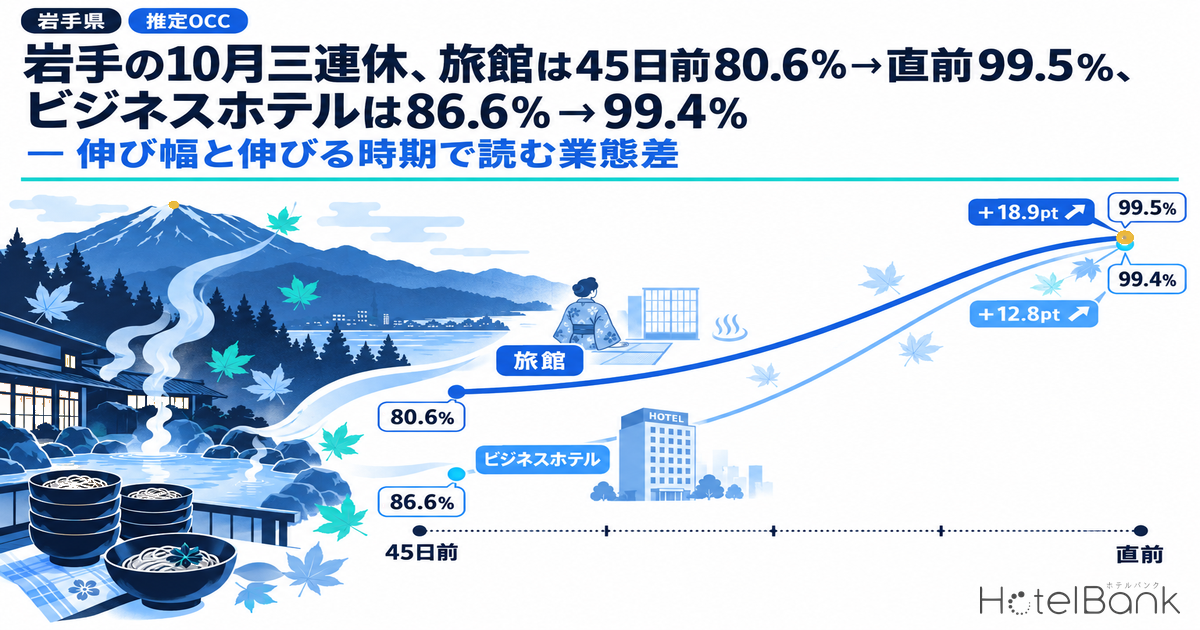
Tracking estimated OCC (OTA listed-inventory basis) for 97 ryokan (3,396 rooms) and 35 business hotels (5,119 rooms) in Iwate over the October long weekend (Saturday, October 10 to the holiday Monday, October 12) from 45 days before the stay date to the final reading shows that, for the first night, October 10, ryokan built from 80.6% at 45 days out to 99.5% just before the stay (+18.9pt), while business hotels built from 86.6% to 99.4% (+12.8pt). The end points are almost identical, but ryokan, which started lower at 45 days out, gained more. On the second and third nights the gains of the two segments line up in the 20pt range, yet a difference in timing emerges: ryokan gains cluster between 45 and 30 days out, while business hotel gains cluster between 30 days out and the final reading. Rather than the absolute level at 45 days out, this article looks at how much was added afterward, and when, to consider how each segment should hold inventory in the final stretch.
Scope: Iwate ryokan N=97 properties (3,396 rooms) and business hotels N=35 properties (5,119 rooms). This article does not cover prices; occupancy figures are estimates based on OTA-listed inventory only. Definitions are at the end of the article. Data as of October 11, 2026.
- — First night: ryokan +18.9pt, business hotels +12.8pt: Estimated OCC for the Saturday, October 10, 2026 stay rose from 80.6% at 45 days out to 99.5% at the final reading for ryokan, and from 86.6% to 99.4% for business hotels (Iwate, N=97 / 35 properties).
- — Second and third nights: gains line up in the 20pt range: For the October 11, 2026 stay, ryokan gained +26.5pt and business hotels +27.1pt; for the October 12 stay (as of 2 days out), +20.3pt and +23.2pt.
- — The segment difference is in when the gains come: Ryokan gains clustered between 45 and 30 days out on all three nights (+12.0 to +14.0pt), while business hotel gains on the second and third nights clustered between 30 days out and the final reading (+15.5pt and +16.8pt).
- — Sold-out property rates diverge by segment: At the final reading for the October 11, 2026 stay, the rate was 83.5% for ryokan versus 54.3% for business hotels. The scale difference, an average of 35 rooms versus 146 rooms per property, lies behind this.
- — The last night of the long weekend moves in the final week: Business hotels for the October 12 stay rose from 70.6% at 7 days out to 79.7% at 2 days out, +9.1pt in the final week alone. Not opening up too much inventory just because rooms remain at 30 days out is a decision worth considering.
Three Checkpoints Across the Three Nights: Similar End Points, Different Starting Points and Gains
First, we line up the three checkpoints, 45 days out, 30 days out and the final reading, for each stay date by segment. These are the same yardsticks used in Iwate Obon 2026: Aug 13 Peaks 92.5%, Aug 15 Dips to 78.9% Both Types, which tracked the same prefecture and the same two segments over three Obon nights (as of August 7, 2026; that universe was ryokan N=124 properties and business hotels N=74 properties, a different cohort from this article). For Saturday, October 10, ryokan moved from 80.6% at 45 days out to 92.6% at 30 days out to 99.5% at the final reading, and business hotels from 86.6% to 95.2% to 99.4%; in both cases OTA-listed inventory was nearly exhausted just before the stay. The starting points, however, were 6.0pt apart, and ryokan closed that gap over the 45 days. In terms of gains, ryokan added +18.9pt against +12.8pt for business hotels, meaning ryokan needed roughly 1.5 times the build to reach the same near-full level.
The picture changes on the second night, Sunday, October 11. Ryokan went from 70.1% at 45 days out to 84.1% at 30 days out to 96.6% at the final reading (+26.5pt), and business hotels from 68.0% to 79.6% to 95.1% (+27.1pt), tracing almost the same path in starting point, end point and gain. The segment difference seen on the first night had disappeared by the second. The third night, Monday, October 12 (a public holiday), precedes the return to work: ryokan moved from 57.5% to 71.4% to 77.8% (as of 2 days out) and business hotels from 56.5% to 62.9% to 79.7% (same basis), so the end points stayed just below 80%. Here too the gains were close, at +20.3pt for ryokan and +23.2pt for business hotels.
| Stay date | Segment (N) | 45 days out | 30 days out | Final reading | Gain | Sold-out property rate, 45 days out to final |
|---|---|---|---|---|---|---|
| Oct 10 (Sat) | Ryokan (97 properties / 3,396 rooms) | 80.6% | 92.6% | 99.5% | +18.9pt | 28.9% to 93.8% |
| Oct 10 (Sat) | Business hotels (35 properties / 5,119 rooms) | 86.6% | 95.2% | 99.4% | +12.8pt | 37.1% to 88.6% |
| Oct 11 (Sun) | Ryokan (97 properties / 3,396 rooms) | 70.1% | 84.1% | 96.6% | +26.5pt | 20.6% to 83.5% |
| Oct 11 (Sun) | Business hotels (35 properties / 5,119 rooms) | 68.0% | 79.6% | 95.1% | +27.1pt | 17.1% to 54.3% |
| Oct 12 (Mon, holiday) | Ryokan (97 properties / 3,396 rooms) | 57.5% | 71.4% | 77.8%* | +20.3pt | 15.5% to 24.7% |
| Oct 12 (Mon, holiday) | Business hotels (35 properties / 5,119 rooms) | 56.5% | 62.9% | 79.7%* | +23.2pt | 2.9% to 11.4% |
Estimated OCC (OTA listed-inventory basis). The final reading is 1 day before the stay date for Oct 10 and Oct 11, and 2 days before (*) for Oct 12. The sold-out property rate is the share of properties with no listed inventory confirmed on OTAs and similar channels (estimate). Source: MetroEngines Research, compiled by HotelBank Editorial Team
To summarize so far, only the first night of the long weekend showed a pattern of business hotels building first and ryokan catching up; from the second night on, both segments grew by about the same amount from about the same starting point. In other words, the segment difference lies less in the size of the gain than in when the gain appeared. The next section splits it into two intervals: 45 to 30 days out, and 30 days out to the final reading.
Booking curve for the Saturday, Oct 10 stay date (45 days to 1 day before the stay). Ryokan N=97 properties / 3,396 rooms; business hotels N=35 properties / 5,119 rooms. Source: MetroEngines Research, compiled by HotelBank Editorial Team
When the Gains Come: Ryokan Build in the Mid-Phase, Business Hotels in the Final Stretch
Splitting the gain into 45 to 30 days out (mid-phase) and 30 days out to the final reading (late phase) separates the character of the two segments clearly. Ryokan recorded +12.0pt mid-phase / +6.9pt late phase for October 10, +14.0pt / +12.5pt for October 11, and +13.9pt / +6.4pt for October 12; on all three nights the mid-phase gain exceeded the late-phase gain. Business hotels, by contrast, were mid-phase weighted only on October 10 (+8.6pt / +4.2pt); October 11 came in at +11.6pt / +15.5pt and October 12 at +6.4pt / +16.8pt, so the second and third nights were weighted toward the late phase. Except on dates such as the first night of a long weekend, when demand is thick from early on, business hotel bookings can be read as picking up in earnest only inside 30 days. This pattern of building after 30 days out is not unique to Iwate: when we tracked the same long weekend in Kagawa (observed in late September 2026), business hotels (N=43 properties) rose from 65.0% at 45 days out to 84.1% at the latest reading, appearing as the counterpart to an early-committing ryokan pattern.
The likely background is that ryokan bookings tend to be made up of planned leisure demand that is decided somewhat further ahead of the stay date. Indeed, the ryokan curves show a step in the September 1 observation in which estimated OCC rose by 6.7 to 8.6pt in a single day on all three nights (from 80.2% to 88.7% for October 10, 71.3% to 78.0% for October 11, and 57.9% to 66.5% for October 12), suggesting that listed inventory moved in bulk at the turn of the month. For business hotels this step was small, limited to 88.7% to 91.1% for October 10 and 55.3% to 57.5% for October 12. The contrast is between ryokan, whose allocations are settled in the mid-phase, and business hotels, which fill through last-minute individual bookings.
Estimated OCC gain split into 45 to 30 days out and 30 days out to the final reading (the final reading for Oct 12 is as of 2 days out). Ryokan N=97 properties / 3,396 rooms; business hotels N=35 properties / 5,119 rooms. Source: MetroEngines Research, compiled by HotelBank Editorial Team
The larger the late-phase gain, the more the handling of last-minute inventory and pricing shapes the outcome. Business hotels still had rooms left at 30 days out for October 11 and 12, at 79.6% and 62.9% respectively, but added more than 15pt from there to the final reading. In a market that moves this much late, releasing inventory early on the basis of the 30-days-out level narrows a property’s own room to capture demand arriving in the last two weeks. Ryokan, conversely, were already high at 30 days out, at 92.6% for October 10 and 84.1% for October 11, and their late-phase gains stayed within roughly 7 to 13pt, so the question in the final stretch is less how many rooms to hold back than whether the build through the mid-phase is on track.
Sold-Out Property Rates and the Final Week: Where the Third Night’s Remaining Inventory Went
Even where estimated OCC ends up at similar levels, how properties sell out differs by segment. The sold-out property rate (the estimated share of properties with no listed inventory confirmed on OTAs and similar channels) at the final reading for October 10 was 93.8% for ryokan and 88.6% for business hotels, meaning around nine in ten properties in both segments had no listed inventory. For October 11, however, a gap of about 30pt opened, at 83.5% for ryokan versus 54.3% for business hotels, and for October 12 (as of 2 days out) the figures were 24.7% for ryokan and 11.4% for business hotels. Many business hotels have large room counts (5,119 rooms across 35 properties, an average of 146 rooms per property), so even when estimated OCC reaches around 95% (95.1% at the final reading for the October 11, 2026 stay), individual properties tend to keep a few rooms listed. Ryokan are small, averaging 35 rooms per property, so a rise in OCC translates directly into more sold-out properties.
Looking at the gain in the final week (7 days out to the final reading) ties this difference to practice. Ryokan added +3.2pt for October 10 (96.3% to 99.5%), +5.8pt for October 11 (90.8% to 96.6%) and +3.4pt for October 12 (74.4% to 77.8%), so final-week movement stayed at a few points. Business hotels plateaued for October 10 at +1.1pt (98.3% to 99.4%), but added +4.3pt for October 11 (90.8% to 95.1%) and +9.1pt for October 12 (70.6% to 79.7%), moving most in the final week of the third night. Demand to stay on the holiday Monday at the end of the long weekend built up this time in the last week before the stay, and for business hotels October 12 was a date decided in the final week.
Booking curves for the Sunday, Oct 11 and Monday (holiday), Oct 12 stay dates (45 days before the stay to the latest reading). Ryokan N=97 properties / 3,396 rooms; business hotels N=35 properties / 5,119 rooms. Source: MetroEngines Research, compiled by HotelBank Editorial Team
Day-of-Week Shape in an Ordinary Month: September 2026 Estimated OCC by Weekday and the Second Night of the Long Weekend
For reference, we add estimated OCC by day of week for September 2026, the most recent elapsed month (results for an elapsed month, using the final reading for each stay date). Ryokan (N=101 properties / 3,462 rooms; 90 to 102 properties depending on the day) posted 91.6% on Saturdays, 84.7% on Sundays, 82.8% on Mondays and 76.1% on Wednesdays, peaking on Saturday and easing gently into the new week, with a monthly average of 81.5%. Business hotels (N=34 properties / 4,868 rooms; 32 to 34 properties depending on the day) were high on weekdays as well, at 94.8% on Saturdays, 92.9% on Thursdays and 90.9% on Tuesdays, while Sunday was the lowest at 78.9%; the monthly average was 88.8%. October 11, the second night of the long weekend, is a date that carries this Sunday weakness, and the fact that business hotels nonetheless reached 95.1% at the final reading can be seen as long-weekend demand lifting an ordinary Sunday by more than 16pt. The Sunday trough for business hotels persists across seasons: a day-of-week breakdown of the finalized month of July 2026 (median of daily observations, N=74 properties) also showed Sunday as the weekly low, at 81.3%.
| September 2026 by day of week | Mon | Tue | Wed | Thu | Fri | Sat | Sun | Monthly average |
|---|---|---|---|---|---|---|---|---|
| Ryokan (N=101 properties / 3,462 rooms) | 82.8% | 81.1% | 76.1% | 77.7% | 78.0% | 91.6% | 84.7% | 81.5% |
| Business hotels (N=34 properties / 4,868 rooms) | 89.4% | 90.9% | 88.3% | 92.9% | 86.2% | 94.8% | 78.9% | 88.8% |
Simple average by day of week of the final-reading estimated OCC (OTA listed-inventory basis) for each stay date in September 2026. N is the largest number of properties observed within the month (ryokan: 90 to 102 properties depending on the day; business hotels: 32 to 34). Source: MetroEngines Research, compiled by HotelBank Editorial Team
For Revenue Managers Running Ryokan and Business Hotels in Iwate: Implications and Action Plan
1. Overlay the shape of your own curve on the market, rather than the level at 45 days out. Over this long weekend, ryokan gains clustered in the mid-phase from 45 to 30 days out on all three nights (+12.0 to +14.0pt), while business hotel gains on the second and third nights clustered in the late phase from 30 days out to the final reading (+15.5pt and +16.8pt). It is worth lining up your own booking pace at the same three checkpoints and checking whether your timing diverges from the market. If a ryokan’s mid-phase gain is slower than the market, there is room to examine whether it is being passed over at the trip-planning stage for long-weekend demand; if a business hotel’s late-phase gain is small, there is room to review how last-minute allocations and visibility are held.
2. The later a date builds, the less the decision at 30 days out should be rushed. Business hotels for October 12 rose from 62.9% at 30 days out to 79.7% at the final reading (+16.8pt), with +9.1pt in the final week alone. Releasing inventory widely on the basis of rooms remaining at 30 days out narrows a property’s own room to capture demand arriving in the last two weeks. A last night of a long weekend that is followed by a weekday, such as this third night, is worth treating as a date with a large late-phase market gain, and holding a certain amount of inventory into the final stretch is an option to consider.
3. The sold-out property rate is a yardstick for whether your property is selling out earlier than the market. At the final reading for October 10, 93.8% of ryokan and 88.6% of business hotels had no listed inventory. If your property was already sold out at 30 days out for this date, it may have missed the demand the market added between 30 days out and the final reading (+6.9pt for ryokan, +4.2pt for business hotels), and for the next long weekend there is room to consider moving the timing of your sell-out closer to the market’s final-stretch level.
4. Sunday weakness differs by segment. In September 2026 estimated OCC by day of week, business hotels were lowest on Sundays at 78.9%, while ryokan Sundays stood at 84.7%, only about 7pt below Saturday. Both segments ended above 95% on the second night of the long weekend (a Sunday), but the same level is hard to expect on a Sunday without a long weekend. It is worth understanding the day-of-week shape of ordinary periods first, and then separately assessing how much long-weekend demand was added on top.
| Time horizon | Action | Decision trigger (based on figures in this article) | Aim |
|---|---|---|---|
| T-45 to T-30 | Ryokan: secure allocations for the first and second nights of the long weekend for mid-phase demand | Your progress at 30 days out is well below the market at 30 days out (Oct 10: 92.6%; Oct 11: 84.1%) | Do not miss the mid-phase, where ryokan gains concentrate |
| T-45 to T-30 | Business: do not open inventory too widely for the last night of a long weekend (followed by a weekday) | Even though the market for the third night was low at 62.9% at 30 days out, it went on to gain +16.8pt by the final reading | Leave room to capture late-phase demand |
| T-30 to T-14 | Both segments: compare your property with the market at the three checkpoints and adjust only the dates that diverge | Your gain is less than half the market gain (ryokan +18.9 to +26.5pt; business +12.8 to +27.1pt) | Decide date by date rather than uniformly across all dates |
| T-14 to T-7 | Business: maintain visibility of allocations heading into the final week of the third night | The market for the third night moved +9.1pt in the final week, from 70.6% at 7 days out to 79.7% at the final reading | Catch demand that decides at the last minute |
| T-7 to final | Ryokan: compare the timing of your sell-out with the market sold-out property rate | Your property is already sold out at 7 days out, while the market sold-out property rate has not yet reached its final-reading level at that point (Oct 10: 93.8%; Oct 11: 83.5%) | Verify whether you are selling too early |
| After the long weekend | Both segments: save your own curves for the three nights as the baseline for the next long weekend | In the market, both segments followed the same path on the second night (+26.5pt / +27.1pt); only the first night showed a segment difference | Confirm the character of each night of a long weekend with your own data |
Examples of decision triggers based on the estimated OCC and sold-out property rates in this article. Source: MetroEngines Research, compiled by HotelBank Editorial Team
Summary: Read Long-Weekend Curves by Starting Point, Gain and Timing
We sum up the results of tracking the October 2026 long weekend in Iwate across 97 ryokan and 35 business hotels as three reusable yardsticks. The first is the starting point. Estimated OCC at 45 days out differed on the first night, at 80.6% for ryokan and 86.6% for business hotels, but was almost the same on the second night (70.1% and 68.0%) and third night (57.5% and 56.5%); the segment difference was concentrated on the first night. The second is the gain. On the first night ryokan gained more, at +18.9pt versus +12.8pt for business hotels, while on the second and third nights both segments lined up in the 20pt range. The third is the timing of the gain. Ryokan gains clustered between 45 and 30 days out on all three nights, while business hotel gains on the second and third nights clustered between 30 days out and the final reading. This third axis is the substance of the proposition that the more a segment gains, the more its last-minute handling matters; for the last night of a long weekend at business hotels, which add more than 15pt in the late phase, not opening inventory too early just because rooms remain at 30 days out is a decision worth considering. For the next long weekend, a good place to start is overlaying your own three checkpoints on the market along these three axes.
Frequently Asked Questions
Q. Is estimated OCC (OTA listed-inventory basis) the same as actual room occupancy?
A. No. Estimated OCC is an estimate calculated as 100 – 100 x (unsold rooms listed on OTAs / total rooms), covering a fixed cohort of properties that list at least 30% of their total rooms on OTAs. Because rooms not listed on OTAs are counted as sold, it comes out higher than actual room occupancy. The figures in this article are observations as of October 11, 2026.
Q. How did the timing of booking gains differ between ryokan and business hotels over the October 2026 long weekend in Iwate?
A. For ryokan (N=97 properties), the gain from 45 to 30 days out (+12.0 to +14.0pt) exceeded the gain from 30 days out to the final reading on all three stay dates, October 10, 11 and 12. For business hotels (N=35 properties), the 45-to-30-days-out interval led only on the first night; October 11 added +15.5pt and October 12 +16.8pt from 30 days out to the final reading, so the second and third nights were weighted toward the last-minute side.
Q. Why do sold-out property rates differ when the end points are close?
A. The difference in property scale is at work. At the final reading for the October 11, 2026 stay, the end points were close, at 96.6% for ryokan and 95.1% for business hotels, while the sold-out property rate was 83.5% for ryokan and 54.3% for business hotels. Business hotels are large, averaging 146 rooms per property, so individual properties tend to keep a few rooms listed even as overall inventory is absorbed, whereas for ryokan, averaging 35 rooms per property, progress in absorption translates directly into more sold-out properties.
About the Data
| Definition of estimated OCC | Occupancy on an OTA listed-inventory basis = 100 – 100 x (unsold rooms listed on OTAs / total rooms). Covers a fixed cohort of properties that list at least 30% of their total rooms on OTAs (the same set of properties for each stay date; N is the number of those properties). This is an estimate based on the absorption of inventory sold on OTAs and is defined differently from actual room occupancy (it comes out higher because unlisted rooms are counted as sold). |
| Booking curve | Based on observations from 45 days before the stay date to the latest reading. The checkpoints are 45 days out, 30 days out and the final reading (1 day before the stay date for Oct 10 and Oct 11; 2 days before for Oct 12). The gain is the difference in estimated OCC between checkpoints (pt). |
| Sold-out property rate | The share of properties in the cohort with no listed inventory confirmed on OTAs and similar channels at the time of observation (estimate). |
| Scope N | Long-weekend booking curves: Iwate ryokan N=97 properties / 3,396 rooms and business hotels N=35 properties / 5,119 rooms (fixed cohort based on listings on major booking sites). September 2026 by day of week: ryokan N=101 properties / 3,462 rooms and business hotels N=34 properties / 4,868 rooms (the largest number of properties observed within the month; ryokan: 90 to 102 properties depending on the day; business hotels: 32 to 34). |
| About prices | This article covers occupancy (estimated OCC) only and does not cover price levels. |
| Data as of | Data as of October 11, 2026. Because sales status and inventory change daily, the figures in this article are a snapshot at the time of collection. |
Source: MetroEngines Research, compiled by HotelBank Editorial Team
References and Sources
■ Data sources
Data observed and aggregated daily by MetroEngines Research from publicly listed inventory on major booking sites (estimated OCC and sold-out property rate). The long-weekend booking curves cover Iwate ryokan N=97 properties (3,396 rooms) and business hotels N=35 properties (5,119 rooms), stay dates October 10-12, 2026, observed from 45 days before the stay date to the latest reading. The day-of-week figures are for the elapsed month of September 2026 (ryokan N=101 properties, business hotels N=34 properties). Data as of October 11, 2026.
■ Calculation assumptions
Estimated OCC = 100 – 100 x (unsold rooms listed on OTAs / total rooms), aggregated for a fixed cohort of properties that list at least 30% of their total rooms on OTAs. The three checkpoints are 45 days out, 30 days out and the final reading (1 day before the stay date for Oct 10 and Oct 11; 2 days before for Oct 12), and the gain is the difference between checkpoints (pt). Mid-phase means 45 to 30 days out, late phase means 30 days out to the final reading, and final week means 7 days out to the final reading. Price levels are not covered.
■ Limitations and caveats
These are estimates based on the absorption of OTA-listed inventory and are defined differently from actual room occupancy (they come out higher). Bookings through non-OTA channels (direct sales, groups and so on) are not directly observed. This is an observation of one prefecture and one long weekend, and the same shape will not necessarily appear in other long weekends or other regions. The Oct 12 figures are as of 2 days before the stay date and are not the final end point.
■ Public sources
- Cabinet Office, “National Holidays” (confirming that October 12, 2026 is Sports Day)
https://www8.cao.go.jp/chosei/shukujitsu/gaiyou.html