

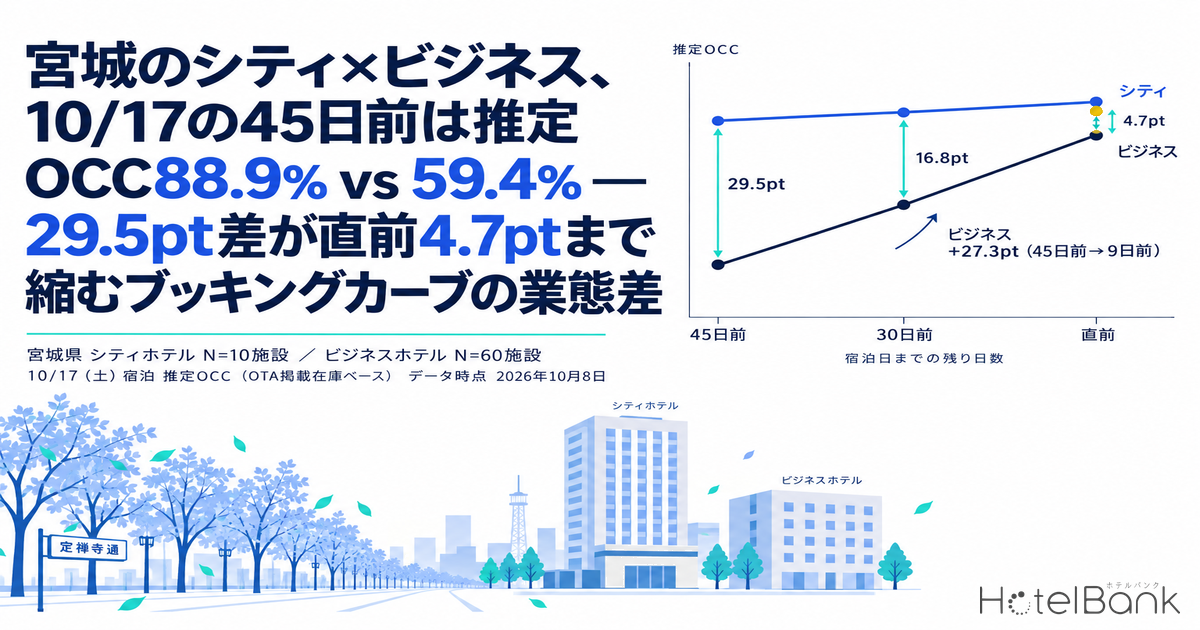
We compared booking curves for 10 city hotels (1,172 rooms) and 60 business hotels (8,892 rooms) in Miyagi across the 30 stay dates from October 10 to November 8, 2026, using observations from 45 days before each stay date up to the most recent reading. For Saturday, October 17, estimated OCC (based on OTA-listed inventory) at T-45 was 88.9% for city hotels and 59.4% for business hotels, a 29.5pt gap; it had narrowed to 16.8pt at T-30 and to 4.7pt at the latest observation, nine days out. The gap closed not because city hotels stalled but because business hotels added 27.3pt over the 36 days from T-45 to T-9. This article uses three fixed checkpoints (T-45, T-30 and the last-minute reading), pickup by day of week and movements in the sold-out property rate to show how the shape of the curve differs between the two segments in the Sendai area, and translates that into decision inputs for operators.
Scope: Miyagi, city hotels N=10 properties (1,172 rooms) and business hotels N=60 properties (8,892 rooms), both as listed on major booking sites. This article focuses on occupancy and the sold-out property rate and does not cover price levels. Occupancy figures are estimates based on OTA-listed inventory and are defined differently from actual room occupancy (definitions at the end of the article). Data as of October 8, 2026.
- — The segment gap on Oct 17 (Sat) went from 29.5pt to 4.7pt: estimated OCC at T-45 was 88.9% for city hotels and 59.4% for business hotels. At the latest observation, nine days out, the gap had narrowed to 91.4% versus 86.7% (Miyagi; city N=10 properties, business N=60 properties).
- — It narrowed because business hotels built: pickup from T-45 to T-9 was +2.5pt for city hotels and +27.3pt for business hotels. About half of the business pickup (13.9pt) came in the three weeks after T-30.
- — The same pattern holds by day of week: across the 14 stay dates from October 12 to 25, business hotels picked up +30.0pt on Mon-Thu, +22.3pt on Fri, +20.7pt on Sat and +17.0pt on Sun. City hotels picked up +2.6 to 3.9pt on every day of the week, so their T-45 level is already close to the final landing.
- — The three-day weekend and early November are filled by T-45: Oct 10 (Sat) stood at 97.5% for city hotels and 91.5% for business hotels at T-45, and Nov 6 and Nov 7 were in the 98-99% range for both segments. On dates of this type there is almost no segment gap.
- — Inventory comes back in the final week: for Oct 10, the sold-out property rate at business hotels fell from 73.3% at T-18 to 35.0% at T-2, and at city hotels from 80.0% to 50.0%. Rooms returned by cancellations and held-back allotments being relisted can be read as the background.
Oct 17 (Sat) — The 29.5pt Gap at T-45 Shrinks to 4.7pt as Business Hotels Pick Up Late
We start with the curve for Saturday, October 17, the main subject of this article. At the T-45 observation (September 2), city hotels had already reached 88.9%, and the sold-out property rate (the estimated share of properties with no listed inventory confirmed on OTAs and similar channels) was 30.0%, meaning 3 of the 10 properties had closed their allotments. Business hotels, by contrast, stood at 59.4% with a sold-out property rate of 3.3%, just under 60% consumed. The gap at that point was 29.5pt.
By T-30, however, the gap had narrowed to 16.8pt, with city hotels at 89.6% against 72.8% for business hotels, and at the latest observation (nine days before the stay date, observed October 8) it was 4.7pt, at 91.4% versus 86.7%. Pickup over those 36 days was +2.5pt for city hotels and +27.3pt for business hotels, an order of magnitude apart. The city hotel curve ran almost flat within an 88-92% band, holding until the last minute a position that was already in place at T-45. Business hotels kept building at a pace of around 0.7pt per day, and their sold-out property rate rose in steps from 3.3% to 11.7%.
Source: MetroEngines Research; compiled by the HotelBank Editorial Team
This shape matches the common impression that city hotels fill early and business hotels fill late, but what deserves attention is how quickly the gap closes. In the three weeks from T-30 to T-9, business hotels added 13.9pt against 1.8pt for city hotels, so about half of the business pickup was concentrated in those three weeks. For business hotels in the Sendai area, judging the final landing from the T-30 figure is too early, even for weekend dates. This convergence pattern, in which city hotels lead and business hotels catch up later, is not unique to the Sendai area: the same shape has been confirmed in Aichi, where an 8.0pt gap between city and business hotels at T-45 narrowed to 1.8pt by T-10.
Three Checkpoints for Oct 10, Oct 17 and Oct 24 — The Holiday Weekend Was Decided by T-45 in Both Segments
The next table sets out the three checkpoints (T-45, T-30 and the last-minute reading) by segment for the three main Saturdays in October. Saturday, October 10 is the first day of a three-day weekend that includes Sports Day (Monday, October 12), and Saturday, October 24 is the weekend when the autumn-foliage illumination in Akiu (Akiu Lumina, October 24 to November 15) begins.
| Stay date | Segment | T-45 est. OCC | T-45 sold-out rate | T-30 est. OCC | T-30 sold-out rate | Latest est. OCC | Latest sold-out rate | Latest observation |
|---|---|---|---|---|---|---|---|---|
| Oct 10 (Sat) | City | 97.5% | 80.0% | 97.6% | 80.0% | 98.3% | 50.0% | T-2 |
| Business | 91.5% | 51.7% | 96.7% | 61.7% | 95.1% | 35.0% | T-2 | |
| Oct 17 (Sat) | City | 88.9% | 30.0% | 89.6% | 10.0% | 91.4% | 20.0% | T-9 |
| Business | 59.4% | 3.3% | 72.8% | 5.0% | 86.7% | 11.7% | T-9 | |
| Oct 24 (Sat) | City | 95.9% | 50.0% | 97.5% | 70.0% | 98.8% | 70.0% | T-16 |
| Business | 80.7% | 18.3% | 88.0% | 33.3% | 94.8% | 50.0% | T-16 |
Source: MetroEngines Research; compiled by the HotelBank Editorial Team
On October 10, the first day of the three-day weekend, both segments were already above 90% at T-45, at 97.5% for city hotels and 91.5% for business hotels, a gap of only 6.0pt. The sold-out property rate was 80.0% for city hotels and 51.7% for business hotels, which means that for this date there was almost no room left to go after at the T-45 stage. For October 24, by contrast, the gap narrowed from 15.2pt at T-45 (city hotels 95.9%, business hotels 80.7%) to 9.5pt at T-30 and 4.0pt at T-16, the same convergence pattern as October 17. The sold-out property rate rose from 50.0% to 70.0% for city hotels and from 18.3% to 50.0% for business hotels, so at T-16 half of the 60 properties had closed their listed inventory.
To sum up so far, two patterns emerge: on dates that are already above 90% at T-45, such as the three-day weekend, there is almost no segment gap, while on ordinary Saturdays city hotels lead and business hotels catch up later. The fact that business hotels pick up heavily at the last minute on ordinary Saturdays suggests, seen from the other side, that there are dates on which a low figure at T-45 is no reason to move rates early.
The Last Days Before Oct 10 (Sat) — The Sold-Out Property Rate Falls in the Final Week
For October 10, the first day of the three-day weekend, observations run to two days before the stay date, so we can see what happens at the tail of the curve. Estimated OCC at business hotels rose to 98.1% at T-17 and then fell 3.0pt to 95.1% at T-2. The sold-out property rate moved even more, falling from a peak of 73.3% at T-18 to T-16 down to 35.0% at T-2. Estimated OCC at city hotels was also flat within a 96-99% band, but the sold-out property rate fell from 80.0% at T-45 to 50.0% at T-2.
Source: MetroEngines Research; compiled by the HotelBank Editorial Team
The combination of a slight decline in estimated OCC and a large decline in the sold-out property rate can be read as properties that had once closed their allotments relisting inventory just before the stay date. Reselling rooms returned by cancellations and switching rooms held back for groups and corporate accounts to general sale are the typical background; even on a high-demand date such as the first day of a holiday weekend, listed inventory returns to the market in the final week. Because competitors may be capturing demand with relisted inventory while your own property continues to show as full until the last minute, last-minute listing status is worth checking most closely on weekend dates. The two indicators can move separately because they measure different things: estimated OCC tracks the share of rooms consumed, while the sold-out property rate tracks the share of properties showing no listed inventory (see the definitions at the end of this article).
Pickup by Day of Week — Business Hotels +30.0pt on Mon-Thu, City Hotels +3 to 4pt on Every Day
To compare the shape of the curve across the whole week and not only Saturdays, we averaged estimated OCC at T-45 and at the latest observation (4 to 17 days before the stay date) by day-of-week group for the 14 stay dates in the two weeks from Monday, October 12 to Sunday, October 25, for which observations run close to the stay date.
| Day of week | Segment | Stay dates | T-45 est. OCC | Latest est. OCC | Pickup | T-45 sold-out rate | Latest sold-out rate |
|---|---|---|---|---|---|---|---|
| Mon-Thu | City | 8 | 81.4% | 85.2% | +3.9pt | 3.8% | 8.8% |
| Business | 8 | 50.5% | 80.6% | +30.0pt | 1.9% | 7.3% | |
| Fri | City | 2 | 88.9% | 92.3% | +3.4pt | 25.0% | 35.0% |
| Business | 2 | 62.2% | 84.5% | +22.3pt | 1.6% | 8.3% | |
| Sat | City | 2 | 92.4% | 95.1% | +2.7pt | 40.0% | 45.0% |
| Business | 2 | 70.0% | 90.8% | +20.7pt | 10.8% | 30.9% | |
| Sun | City | 2 | 86.2% | 88.8% | +2.6pt | 0.0% | 10.0% |
| Business | 2 | 56.7% | 73.8% | +17.0pt | 0.0% | 3.3% |
Source: MetroEngines Research; compiled by the HotelBank Editorial Team
Source: MetroEngines Research; compiled by the HotelBank Editorial Team
Business hotel pickup was +30.0pt on Monday to Thursday (50.5% to 80.6%), +22.3pt on Fridays, +20.7pt on Saturdays and +17.0pt on Sundays, a clear structure in which weekdays build the most at the last minute. City hotels picked up +3.9pt on Monday to Thursday, +3.4pt on Fridays, +2.7pt on Saturdays and +2.6pt on Sundays, so on any day of the week the T-45 level is close to the final landing almost as it stands. In other words, the T-45 figure for city hotels anticipates that date’s landing with considerable accuracy, whereas the T-45 figure for business hotels is not a guide to the landing.
Behind this probably lies a difference in the demand mix. City hotels have a high share of blocks that are fixed months ahead, such as groups, banquets and stays attached to conventions, while business hotels rely on individual guests, mainly business travelers, who start to book two to three weeks before the stay date. In fact, even averaged over the 29 stay dates for which a T-30 observation is available, city hotels moved by only 1.6pt, from 86.8% at T-45 to 88.4% at T-30, while business hotels moved 7.2pt, from 62.0% to 69.2%. Estimated OCC at T-45 was 90% or higher on 9 of the 30 stay dates for city hotels, but for business hotels on only 3: October 10, the first day of the three-day weekend, and November 6 and 7. Conversely, business hotels were below 60% on 16 dates.
For Friday, November 6 and Saturday, November 7, both segments were almost fully closed out at T-45, with city hotels at 98.4% and 99.6% and business hotels at 98.3% and 99.0% (sold-out property rates of 70.0% and 80.0% for city hotels, 78.3% and 90.0% for business hotels). No large event that can be tied to these two dates appears in Miyagi’s lists of tourism events for October and November, and this article does not identify the source of the demand. Even so, the existence in early November of dates that are filled by T-45, just like the first day of the three-day weekend, is a fact operators in both segments should keep in view.
Reference — September Landing Pattern (Results for the Elapsed Month)
To check the landing level that lies at the end of the curve, we averaged daily results for September 2026, an elapsed month (the same estimates based on OTA-listed inventory, last-minute observation), by day of week. City hotels (N=10 properties, 26 days observed) averaged 90.3% for the month, with Saturdays at 98.8% and Sundays at 87.6%; business hotels (N=60 properties, 30 days observed) averaged 91.6%, with Thursdays at 95.2% and Sundays at 86.4%. On the monthly average business hotels exceeded city hotels by 1.3pt, so the September results also support the point that a low level at T-45 does not mean a low landing. The reading that the last-minute pickup at business hotels seen in the October curves ultimately converges on the same landing level as city hotels is consistent with this September outcome.
For Revenue Managers Running City Hotels and Business Hotels in Miyagi — Implications and Action Plan
Insights from the Operator’s Perspective
1. Decide first which pattern to read your own curve against. In the city pattern the T-45 figure is close to the landing (pickup of +2 to 4pt); in the business pattern the curve builds +17 to 30pt from T-45. If your property is a business hotel in Miyagi and your booking pace at T-45 is around the market’s 50.5% (Mon-Thu average), that in itself does not mean you are behind. Conversely, a city-pattern property that is well below the market’s 81.4% (Mon-Thu) or 92.4% (Saturdays) at T-45 should consider acting early, precisely because the shortfall is hard to recover at the last minute.
2. For the business pattern, the three weeks from T-30 to the stay date are the main battleground. On October 17, 13.9pt of the 27.3pt business pickup came after T-30. If your booking pace in this period is not reaching the market’s roughly 0.7pt per day, there is room to review listing conditions by day of week or by room type.
3. On high-demand dates, use the sold-out property rate at T-45 as a guide to when competitor inventory disappears. On October 10 the sold-out property rate was 51.7% at T-45 even for business hotels; on October 24 it was 33.3% at T-30 and 50.0% at T-16. Once half the market has closed its allotments, demand concentrates on the properties that remain, so a property with rooms left will want to capture that phase.
4. Watch for relisted inventory in the final week. The sold-out property rate for October 10 fell from 73.3% to 35.0% at business hotels and from 80.0% to 50.0% at city hotels. This is a phase in which competitors are returning inventory to the market alongside a property that keeps showing as full, so it is worth checking that your operations can put rooms returned by cancellations back on sale immediately.
| Timeline | Action | Decision trigger (figures from this article) | Aim |
|---|---|---|---|
| T-45 | Sort target dates into those that fill by T-45 and those that build at the last minute | Whether the market’s estimated OCC at T-45 is above 90% (the Oct 10, Nov 6 and Nov 7 pattern) or below 60% for business hotels (16 dates) | Fix conditions early for dates that fill; keep last-minute selling capacity for dates that build |
| T-45 | City-pattern properties check confirmed groups and blocks against the market level | Your own pace is well below the market’s T-45 level (92.4% on Saturdays, 81.4% on Mon-Thu) | Consider stepping up sales early, given that this segment is hard to recover at the last minute |
| T-30 | Business-pattern properties set a weekly checkpoint to measure the gap to the market | Your property stays below 72.8% at T-30 on an Oct 17-type Saturday, or 88.0% on an Oct 24-type Saturday | Do not miss the pickup concentrated in the three weeks after T-30 |
| T-30 | Track how competitor inventory disappears through the rise in the sold-out property rate | The market’s sold-out property rate has passed 30% at T-30 (33.3% for business hotels on Oct 24) | Set selling conditions for the phase when demand gathers on remaining inventory |
| Last minute (from T-7) | Resell rooms returned by cancellations immediately and check your own listing status | The market’s sold-out property rate has started to fall from its peak (for Oct 10, from 73.3% at T-18 to 35.0% at T-2) | Return your own inventory to the market at the same time competitors relist |
| Last minute (from T-7) | Keep selling remaining rooms on weekdays (Mon-Thu) on the assumption of a final pickup | Business hotels on Mon-Thu have built from 50.5% at T-45 to 80.6% at the latest reading | Lift the landing by managing remaining rooms on the assumption of last-minute demand |
Summary — Three Yardsticks for Measuring the Segment Gap in Miyagi
The first is how close the T-45 figure is to the landing. Pickup is +2 to 4pt for city hotels and +17 to 30pt for business hotels, so the same T-45 figure means something entirely different. The second is the slope over the three weeks after T-30: business hotel weekends build at around 0.7pt per day, and about half of the pickup falls in this period. The third is the peak in the sold-out property rate and its subsequent decline: even on high-demand dates, inventory returns to the market in the final week. Applying these three points to your own curve should make it easier to tell the dates that call for urgency at T-45 from the dates on which you can wait until the last minute.
Frequently Asked Questions
Q. How large is the gap in estimated OCC at T-45 between city hotels and business hotels in Miyagi?
A. For the stay date of Saturday, October 17, 2026, estimated OCC (based on OTA-listed inventory) at T-45 was 88.9% for city hotels (N=10 properties) and 59.4% for business hotels (N=60 properties), a gap of 29.5pt. It narrowed to 16.8pt at T-30 and to 4.7pt at the latest observation, nine days out.
Q. How large is the last-minute pickup at business hotels?
A. Comparing estimated OCC at T-45 with the latest reading (4 to 17 days before the stay date) across the 14 stay dates from October 12 to 25, business hotels picked up +30.0pt on Monday to Thursday, +22.3pt on Fridays, +20.7pt on Saturdays and +17.0pt on Sundays. City hotels picked up only +2.6 to 3.9pt on every day of the week.
Q. Should a business hotel with a low figure at T-45 move its prices or selling conditions early?
A. A low figure at T-45 alone is hard to read as being behind. Business hotels in Miyagi follow a pattern of building heavily in the three weeks after T-30: on October 17, 13.9pt of the 27.3pt pickup came after T-30. The September 2026 landing also averaged 91.6% for business hotels and 90.3% for city hotels over the month, so business hotels did not finish lower. One approach is to make the call on week-by-week progress from T-30 onward.
Q. Why does the sold-out property rate fall at the last minute?
A. It can be read as properties that had closed their listed inventory relisting rooms just before the stay date. For Saturday, October 10, the sold-out property rate at business hotels fell from 73.3% at T-18 to 35.0% at T-2, and at city hotels from 80.0% at T-45 to 50.0%. Reselling rooms returned by cancellations and releasing rooms held back for groups and corporate accounts to general sale are the typical background.
Q. Is estimated OCC the same as actual room occupancy?
A. No. Estimated OCC is an estimate based on OTA-listed inventory, calculated as 100 − 100 × rooms still listed on OTAs ÷ total rooms. Because rooms not listed are counted as consumed, it comes out higher than actual room occupancy. This article aggregates a fixed cohort of properties that list at least 30% of their total rooms on OTAs.
About the Data
| Definition of estimated OCC | Occupancy based on OTA-listed inventory = 100 − 100 × rooms still listed on OTAs ÷ total rooms. The scope is a fixed cohort of properties that list at least 30% of their total rooms on OTAs (the same set of properties for every stay date; N= in the text is the number of properties). It is an estimate based on how inventory sold on OTAs is being consumed, and is defined differently from actual room occupancy (it comes out higher because rooms not listed are counted as consumed). |
| Booking curve | Based on observations from 45 days before the stay date up to the most recent reading. The three checkpoints are T-45, T-30 and the last-minute reading (the final observation). In the day-of-week aggregation, the latest reading is the final observation, 4 to 17 days before the stay date. |
| Sold-out property rate | The estimated share of properties with no listed inventory confirmed on OTAs and similar channels. The denominator is the number of properties in the cohort. |
| Estimated settled ADR | This article does not cover price indicators. For reference, HotelBank’s estimated settled ADR is a settled-price level (tax-exclusive equivalent) estimated from sales data on OTAs and similar channels (lowest-plan level × segment-specific coefficient, an ensemble of multiple channels); past months are final values, and current and future months are estimates based on sales conditions at the time. The median error against publicly disclosed operating results is 6.6%. |
| Scope | Miyagi: city hotels N=10 properties (1,172 rooms), business hotels N=60 properties (8,892 rooms). The stay dates covered are the 30 days from October 10 to November 8, 2026 (the day-of-week aggregation covers the 14 days from October 12 to 25). The September elapsed-month results cover city hotels N=10 properties (26 days observed) and business hotels N=60 properties (30 days observed; the cohort varies between 58 and 62 properties depending on the day). |
| Data as of | October 8, 2026. Sales conditions and inventory change daily, so the figures in this article are a snapshot at the time of collection. |
References and Sources
■ Data Sources
MetroEngines Research booking-curve aggregation (Miyagi; a fixed cohort of city hotels N=10 properties with 1,172 rooms and business hotels N=60 properties with 8,892 rooms; the 30 stay dates from October 10 to November 8, 2026; observations from 45 days before each stay date up to October 8, 2026), together with daily results for September 2026 on the same OTA-listed-inventory basis (last-minute observation).
■ Calculation Assumptions
Estimated OCC is 100 − 100 × rooms still listed on OTAs ÷ total rooms, and the sold-out property rate is the share of properties with no listed inventory confirmed; both use the number of properties and rooms in the cohort as the denominator. The three checkpoints are T-45, T-30 and the last-minute reading (the final observation); observations at lead times beyond 45 days are not used. Pickup is the difference (pt) between T-45 and the latest observation. The day-of-week aggregation is a simple average of the 14 stay dates from October 12 to 25, 2026, for which observations run close to the stay date.
■ Limitations and Caveats
Estimated OCC is an estimate based on how listed inventory on OTAs is being consumed, and comes out higher than actual room occupancy because rooms not listed are counted as consumed. The sold-out property rate cannot distinguish a suspended listing from a full house. The figures for October 17 and 24 are observations ahead of the stay date (T-9 and T-16), not landings. The city hotel sample is small at N=10 properties, so an inventory change at a single property moves the sold-out property rate by 10pt. The Friday, Saturday and Sunday figures in the day-of-week aggregation are averages of two stay dates each and are prone to swings.
■ Market Data
Miyagi Prefecture, “Tourism Event Information for the Sendai Area (October 2026)” https://www.pref.miyagi.jp/site/event/kankouevent-r0810.html (referenced for the dates of the Sendai Michinoku YOSAKOI Festival during the three-day weekend, Akiu Lumina and other events)