

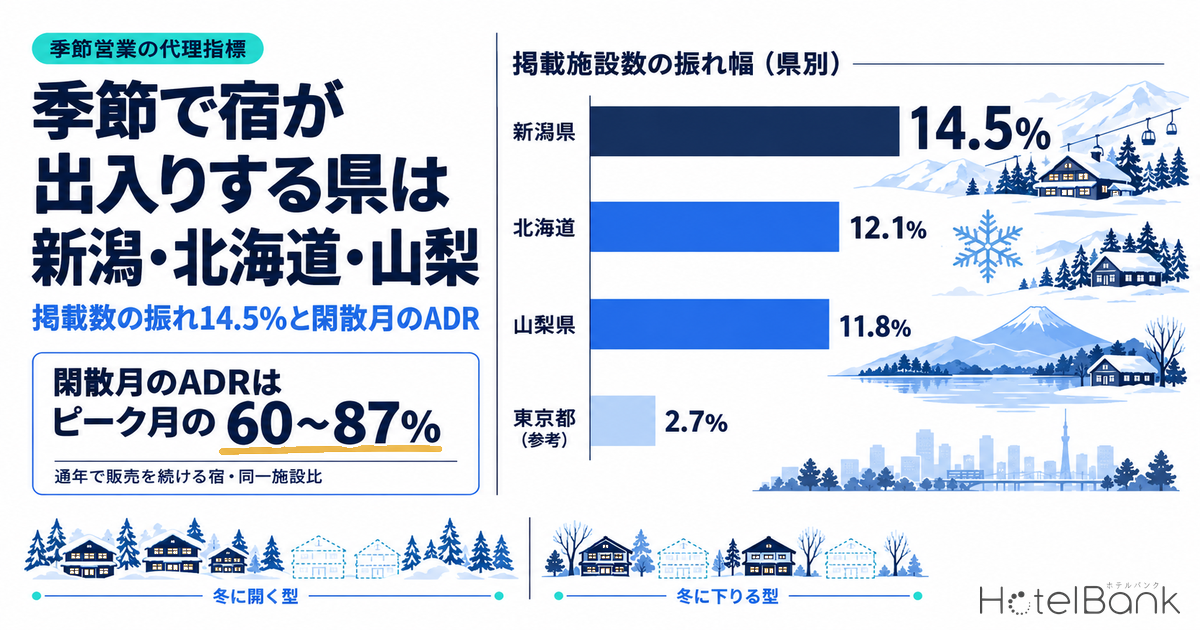
At the foot of ski slopes and beside highland lakes, it is common for lodging operators to close for the winter or the summer. But where exactly do properties come and go with the seasons, and on what scale? In this article, we used the swing in the number of properties listed each month on major booking sites as a proxy for seasonal operation and tallied it across all 47 prefectures. The largest swing (after removing nationwide fluctuations) was in Niigata at 14.5%, followed by Hokkaido at 12.1% and Yamanashi at 11.8%. Tokyo stood at just 2.7%. At the municipal level, the direction of the swing split sharply between ski areas, where listings increase in winter, and highland and lakeside areas, where listings thin out in winter. Moreover, properties that keep selling year-round achieve an estimated settled ADR of 60–90% of the peak month during the months when listings thin. The off-season is not simply a period without demand: it is also a period when properties stop selling all at once, leaving room in the local market. We set out this reading and then organize the factors to consider when evaluating year-round operation.
Metric Definitions Used in This Article
- Listed properties: The number of properties for which a selling price was observed on major booking sites for at least one stay date in that month (MetroEngines Research). This is not the number of properties in operation.
- Swing (seasonal variation rate): Each prefecture’s or municipality’s monthly count of listed properties is converted into a ratio against the nationwide count of listed properties excluding that area; the swing is the difference between the 12-month maximum and minimum, divided by the maximum. This removes nationwide fluctuations (the national count of listed properties itself moves by about 4% from month to month).
- Year-round listed / seasonally listed properties: Properties listed in all 12 months are classed as year-round listed. Properties listed in only 3–9 of the 12 months, either resuming after a gap of two or more months or with listings concentrated in the middle of the period, are classed as seasonally listed. Properties listed only at the start or only at the end of the period (possible new openings or exits) are included in neither group.
- ADR (average daily rate): An estimated settled rate (tax-exclusive equivalent), calculated by applying segment-specific adjustment factors to the lowest-plan price level each property publishes on major booking sites (2 guests per room, per-room rate, tax-inclusive). Checked against property-level results disclosed by listed hotel REITs (91 properties, most recent 3 months), the median error is about 7%. These are estimates and differ from each property’s actual transaction prices and accounting figures. Area-level ADR is the median across the properties covered. Estimated settled ADR is calculated for ryokan, resort hotels, business hotels, city hotels and capsule hotels, and excludes pensions, minshuku (family-run guesthouses), lodges and vacation rentals.
- Period covered: The 12 months from September 2024 to August 2025 (all actual months). We chose this as a complete 12-month window containing one full seasonal peak and trough, and then checked whether the same pattern recurred in the following winter, September 2025 to February 2026.
- Data source: MetroEngines Research
- — Niigata 14.5%, Hokkaido 12.1%, Yamanashi 11.8% — the top three prefectures by swing in monthly listed properties after removing nationwide fluctuations (September 2024–August 2025). Tokyo: 2.7%
- — Ski areas open in winter; highlands close in winter — 8 ski municipalities swing about 31% (peak in March, trough in June); 11 highland, lakeside and eastern Hokkaido municipalities swing about 17% (trough in February)
- — Yuzawa: 57 year-round properties plus 46 seasonal, mostly winter, properties — of the 68 properties listed in June, 57 are year-round listed and share the summer market between them
- — Off-season ADR is 60–87% of the peak month — same-property comparison of year-round listed properties (median). In Katashina (108%) and Myoko (115%), ADR is actually higher in August, when listings thin
- — Break-even at about 2.8 rooms per day — assuming about ¥610,000/month in additional fixed costs for two staff at minimum wage plus kerosene, ADR of about ¥10,300 and a 30% variable cost ratio (minimum wage for FY2025; kerosene at the national average on April 13, 2026)
Swing by Prefecture — Niigata 14.5%, Hokkaido 12.1%, Yamanashi 11.8%
During the period covered, the nationwide number of listed properties ranged from 29,677 to 30,900 per month. When each prefecture’s monthly listings are compared after removing nationwide fluctuations, the largest swings are concentrated in three prefectures: Niigata, Hokkaido and Yamanashi. All three exceed 10%, with a clear gap to fourth-placed Akita (8.7%) and below. Tokyo, by contrast, is at 2.7% and Osaka at 4.0%; urban properties are sold by much the same line-up every month. In other words, areas where the swing exceeds roughly 4% can reasonably be read as having properties that come and go with the seasons.
Converted into property counts, roughly 200 properties come and go with the seasons in Hokkaido, about 120 in Nagano, and about 100 each in Niigata and Yamanashi. The direction of the swing, however, differs by prefecture. Hokkaido (December), Yamanashi (February) and Akita, Aomori and Toyama (January–February) follow a “close in winter” pattern, with listings at their thinnest in winter. Niigata, on the other hand, is thinnest in June and thickest in March — an “open in winter” pattern showing a concentration of properties at the foot of ski slopes that sell only in winter. Nagano and Gunma also thin out from early summer into summer, indicating that the weight of ski areas shapes the prefecture-wide curve.
Source: Compiled by HotelBank Editorial Team from MetroEngines Research (September 2024–August 2025, monthly listed properties in 47 prefectures)
The same pattern appeared the following season. In September 2025–February 2026, Hokkaido’s listed properties fell from 1,670 in October to 1,420 in January, then recovered to 1,569 in February. Niigata rose from 599 in November to 687 in February. Yamanashi also thinned to 800 in January. Because the movements recurred in the same direction in the same months over two seasons, the swing can be taken as reflecting the rhythm of seasonal operation rather than chance.
| Prefecture | Swing | Properties coming and going (approx.) | Thinnest month | ADR in thinnest month | vs. annual median |
|---|---|---|---|---|---|
| Niigata | 14.5% | approx. 97 | June 2025 (open-in-winter type) | ¥8,429 (N=418) | 95% |
| Hokkaido | 12.1% | approx. 198 | December 2024 | ¥7,881 (N=899) | 88% |
| Yamanashi | 11.8% | approx. 103 | February 2025 | ¥10,338 (N=290) | 97% |
| Akita | 8.7% | approx. 20 | January 2025 | ¥7,137 (N=158) | 93% |
| Aomori | 8.6% | approx. 19 | February 2025 | ¥6,385 (N=179) | 88% |
| Shimane | 8.3% | approx. 25 | December 2024 | ¥9,367 (N=174) | 99% |
| Toyama | 8.2% | approx. 19 | January 2025 | ¥6,784 (N=156) | 91% |
| Tokushima | 7.7% | approx. 16 | January 2025 | ¥6,027 (N=139) | 103% |
| Gunma | 7.3% | approx. 52 | August 2025 (open-in-winter type) | ¥12,946 (N=410) | 114% |
| Nagano | 6.9% | approx. 124 | June 2025 (open-in-winter type) | ¥10,330 (N=805) | 94% |
| Tochigi | 6.4% | approx. 45 | February 2025 | ¥9,663 (N=401) | 90% |
| Tokyo (reference) | 2.7% | ― | ― | ― | ― |
* Properties coming and going (approx.) = swing × 12-month average of listed properties. “ADR in thinnest month” is the prefecture-wide estimated settled ADR in the month with the fewest listings (median; N = number of properties for which estimated settled ADR could be calculated). “vs. annual median” is the ratio to the same prefecture’s 12-month median estimated settled ADR.
Source: Compiled by HotelBank Editorial Team from MetroEngines Research
Note the right-hand column of the table. Even in the month with the fewest listings, prefecture-wide estimated settled ADR stays within 88–103% of the annual median in the 10 prefectures other than Gunma. Hokkaido in December is ¥7,900, or 88% of the annual median; Niigata in June is ¥8,400 (95%); Yamanashi in February is ¥10,300 (97%). Gunma’s listings thin in August, yet its ADR is actually higher at 114% of the annual median. Properties that keep selling in the off-season are doing so without a major collapse in price.
Seasonal Swing on the Map — Concentrated in Snow-Country and Highland Prefectures
Mapping the swing by prefecture reveals a band of darker circles from Hokkaido through Hokuriku and Koshin (Yamanashi and Nagano), as well as in northern Tohoku. The Pacific-side metropolitan areas and Kyushu/Okinawa remain pale. Note that Shimane (8.3%) and Tokushima (7.7%) have small property counts of roughly 200–300, so even around 20 properties coming and going produces a large ratio. Circle size reflects the approximate number of properties coming and going; Hokkaido, Nagano, Niigata and Yamanashi alone account for about 520 properties.
Source: Compiled by HotelBank Editorial Team from MetroEngines Research. Circle color = swing; circle size = approximate number of properties coming and going
Direction of the Swing by Location Type — Ski Areas Open in Winter, Highlands Close in Winter
At the municipal level, the direction of the swing is largely explained by the character of the location. Taking the 19 prefectures with large seasonal variation plus Tokyo for reference, we tallied the 218 municipalities with a monthly maximum of at least 15 listed properties; 50 of them had a swing of 20% or more. The chart below groups representative municipalities by location type and compares them using a listing index (12-month average = 100) with nationwide fluctuations removed.
Source: Compiled by HotelBank Editorial Team from MetroEngines Research (listing index: each type’s total listed properties divided by nationwide listed properties, with the 12-month average set to 100)
For the eight ski municipalities (Yuzawa, Minamiuonuma, Myoko, Yamanouchi, Nozawa Onsen, Otari, Iiyama and Katashina), the index jumps to 116.5 in December, peaks at 119.2 in March and falls to 82.8 in June. The swing of about 31% shows that properties selling only in winter come and go en masse. Conversely, the 11 highland, lakeside and eastern Hokkaido municipalities (Yamanakako, Nasu, Furano, Shari, Towada and others) follow a “close in winter” pattern, falling from 107.4 in September to 88.8 in February, with a swing of about 17%.
The six seaside municipalities including beach resorts (Minamiboso, Shirako, Kujukuri, Shika, Takahama and Matsuzaki) show a smaller swing of about 13%, and their index actually fell in July–August. Listings thinning during the beach high season is the opposite of what one might expect. Rather than closures, this most likely reflects properties dropping out of the tally because they were fully booked during the peak, or filled by repeat guests and phone bookings and stopped selling on booking sites. As with Kutchan in winter (discussed below), a decline in listings mixes two things: “closed” and “sold out / selling through other channels.” Whether the direction of the swing coincides with the area’s peak is the key to telling them apart.
| Location type | Municipalities covered | Swing | Thickest months | Thinnest months | Interpretation |
|---|---|---|---|---|---|
| Ski areas | 8 municipalities | approx. 31% | Dec–Mar | Jun | Many properties sell only in winter |
| Highlands, lakesides, eastern Hokkaido | 11 municipalities | approx. 17% | Sep–Oct | Jan–Feb | Many properties stop selling in winter |
| Seaside | 6 municipalities | approx. 13% | Feb–May | Jul–Aug | Listings thin at peak due to full occupancy and other channels |
| International ski resort | Kutchan | approx. 68% | May–Jul | Dec–Feb | Many properties sell through other channels at peak |
| Urban (reference) | Tokyo | approx. 3% | ― | ― | Much the same line-up every month |
Source: Compiled by HotelBank Editorial Team from MetroEngines Research (September 2024–August 2025)
Kutchan stands out with a swing of about 68%. However, its listings thin in December–February — the busiest period, when inbound visitors arrive in search of powder snow. Looking at the town’s properties one by one, most of the 87 properties listed in only some of the 12 months dropped their listings in winter, and they were mainly vacation rentals and hostels. It is natural to assume that winter rooms are filled first through overseas booking channels and direct long-stay bookings and never appear on domestic booking sites. Indeed, the estimated settled ADR of year-round listed properties in the town reaches ¥58,800 in January, about 3.1 times August (¥18,800). It is a good example of why the size of the swing alone should not be taken to mean “lots of seasonal operation.” For the composition of room supply in the Niseko area, see our detailed analysis in Niseko’s Top Tier: Just 2 Hotels, 75 Rooms — Where Fairmont’s 165 Fit.
Source: Compiled by HotelBank Editorial Team from MetroEngines Research. Circle size = swing
A Year in Yuzawa — About 40 Properties Join 57 Year-Round Ones Only in Winter
To see what seasonal comings and goings actually look like, we examined Yuzawa (Niigata), which has a swing of about 52%. The 151 properties listed for at least one month during the period were classified by their pattern of listed months. 57 properties were listed in all 12 months; these year-round listed properties form the foundation of the town’s lodging supply. There were 46 seasonally listed properties, most of them a “winter type” selling only from December to March. Listings of seasonal properties rise to 43–44 in February–March but fall to just 2 in June. By segment, minshuku, lodges and pensions are the most common among seasonal properties, with 10 each, and the median room count is 16.
Source: Compiled by HotelBank Editorial Team from MetroEngines Research (Yuzawa, N=151 properties, September 2024–August 2025)
In June, Yuzawa has 68 listed properties, less than half of March’s 141. What cannot be overlooked is that 57 of those 68 June properties are year-round listed, meaning these properties essentially share the summer market among themselves. Judged only by the number of properties selling in winter, summer Yuzawa looks like a “town with few places to stay.” Seen from the demand side, however, it can also be read as a limited number of properties absorbing demand from summer training camps, hiking and large events.
Applying the same classification to other municipalities, Yamanouchi has 90 year-round properties plus 31 seasonal ones (mostly winter type), and Minamiuonuma has 41 year-round plus 24 seasonal. On the close-in-winter side, Yamanakako has 89 year-round and 27 seasonal properties and Nasu has 159 year-round and 23 seasonal, and in both most seasonal properties stopped selling from December to February.
Rates at Properties Open in the Off-Season — 60–90% of the Peak Month
So at what price do properties that keep selling in the thin months actually sell? Among each municipality’s year-round listed properties, for ryokan, resort hotels and others for which estimated settled ADR can be calculated, we compared the ADR in the month with the fewest listings against the month with the most listings (or the area’s peak month), property by property.
Source: Compiled by HotelBank Editorial Team from MetroEngines Research (median of year-round listed properties in each municipality for which estimated settled ADR could be calculated)
| Municipality | Thinnest month | ADR in thinnest month | Comparison month | ADR in comparison month | Same-property ratio (median) | N |
|---|---|---|---|---|---|---|
| Yuzawa | June 2025 | ¥10,258 | February 2025 | ¥24,179 | 60% | 31 |
| Hakuba | June 2025 | ¥9,336 | February 2025 | ¥16,120 | 62% | 23 |
| Yamanakako | February 2025 | ¥10,008 | August 2025 | ¥15,406 | 67% | 19 |
| Nasu | February 2025 | ¥17,418 | August 2025 | ¥29,085 | 70% | 39 |
| Yamanouchi | June 2025 | ¥11,236 | January 2025 | ¥13,467 | 82% | 76 |
| Minamiuonuma | June 2025 | ¥9,670 | February 2025 | ¥12,697 | 87% | 20 |
| Katashina | August 2025 | ¥10,839 | January 2025 | ¥9,535 | 108% | 11 |
| Myoko | August 2025 | ¥11,034 | March 2025 | ¥10,375 | 115% | 34 |
* ADR is the median of year-round listed properties in each month. The same-property ratio is the median of “thinnest month ÷ comparison month” calculated for each property for which estimated settled ADR could be calculated in both months. For Yamanakako, the thinnest-month ADR is N=20 and the comparison-month ADR is N=19.
Source: Compiled by HotelBank Editorial Team from MetroEngines Research
Comparing the same properties’ prices, off-season ADR falls within 60–87% of the peak month. Year-round listed properties in Yuzawa charged ¥10,300 in June versus ¥24,200 in February, a median same-property ratio of 60%. Nasu was ¥17,400 in February versus ¥29,100 in August (70%), and Yamanouchi ¥11,200 in June versus ¥13,500 in January (82%). Off-season rates are lower than at the peak, but not to the point of falling below half.
Katashina and Myoko produced an even more interesting result. Both see their thinnest listings in August, yet the ADR of year-round listed properties in that August is higher than in the ski season (Katashina 108%, Myoko 115%). Despite summer-holiday demand for the highlands, Oze and escaping the heat, winter-type properties stop selling, so a small number of properties absorb the summer market. The data for these two municipalities show that “a month with thin listings” does not necessarily mean “a month with thin demand.”
Let us also look at seasonally listed properties. In Yuzawa and Yamanouchi, where more than 10 seasonal properties have a calculable estimated settled ADR, the ADR of seasonal properties in their busiest month was ¥10,900 in February for Yuzawa (N=11) and ¥12,100 in January for Yamanouchi (N=21). In Yuzawa, the rate winter-type properties earn at the height of winter is almost the same as the rate year-round listed properties earn in June (¥10,300). Allowing for differences in segment, this means that for winter-type properties, the town’s summer market rate is not far from their own winter rate.
Deciding on Year-Round Operation — Setting Fixed Costs Against Off-Season ADR
From the above, the off-season market can be read as including months in which supply has stepped back, rather than months in which demand is thin. That said, seasonal operation has rational grounds: opening in the off-season incurs new fixed costs such as labor, heating fuel and snow removal. When considering year-round operation, the starting point is to place these additional costs in the same table as the ADR and number of rooms that can be sold in the off-season.
| Item | What opening in the off-season incurs | Figures and benchmarks to check |
|---|---|---|
| Labor | Minimum staffing for front desk, housekeeping and kitchen | The FY2025 regional minimum wage averages ¥1,121 nationwide (weighted; +¥66 year on year). In areas where seasonal hiring is difficult, moving to year-round employment can also help recruitment |
| Heating fuel | Space heating, hot water and heating the communal bath | Retail kerosene is ¥2,499 per 18 liters (April 13, 2026, national average). The biggest issue for highland properties that close in winter |
| Snow removal | Clearing parking lots, access roads and roofs | Outsourced or in-house; distance of stretches not covered by municipal snow-clearing routes |
| Off-season ADR | Rates earned by year-round properties in the same market | 60–87% of the peak month in our measurements (August in Katashina and Myoko is at or above the peak month) |
| Number of competitors | Properties selling in the off-season | 68 properties in Yuzawa in June (141 in March) |
Source: Compiled by HotelBank Editorial Team from Ministry of Health, Labour and Welfare “National List of Regional Minimum Wages,” Agency for Natural Resources and Energy “Petroleum Product Price Survey,” and MetroEngines Research
Let us estimate a concrete break-even point under some assumptions. For one off-season month (30 days), staffing two people for 8 hours a day at minimum wage costs ¥1,121 × 8 hours × 2 people × 30 days, or about ¥540,000. Assuming 30 cans of kerosene a month for heating adds about ¥75,000, for total additional fixed costs of about ¥610,000. Taking the selling rate as the June ADR of year-round listed properties in Yuzawa (about ¥10,300) and assuming variable costs such as cleaning, linen, amenities and booking commissions at 30% of revenue, the contribution per room-night is about ¥7,200. The break-even point is then about 85 room-nights a month, or about 2.8 rooms per day. For a 20-room property, selling just under 3 rooms a day in the off-season would cover the additional fixed costs. The choice of heat source (city gas, LPG or electricity) can also shift annual costs materially and is worth examining alongside this calculation.
| Selling rate (ADR) | Variable cost ratio 25% | Variable cost ratio 30% | Variable cost ratio 35% |
|---|---|---|---|
| ¥8,000 | 3.4 rooms | 3.6 rooms | 3.9 rooms |
| ¥10,300 (Yuzawa June level) | 2.6 rooms | 2.8 rooms | 3.1 rooms |
| ¥12,000 | 2.3 rooms | 2.4 rooms | 2.6 rooms |
| ¥15,000 | 1.8 rooms | 1.9 rooms | 2.1 rooms |
* Additional fixed costs are held at the assumption in the text (national weighted-average minimum wage ¥1,121 × 8 hours × 2 people × 30 days + kerosene ¥2,499 per 18 liters × 30 cans = about ¥610,000/month). Break-even rooms sold = additional fixed costs ÷ (ADR × (1 − variable cost ratio)) ÷ 30 days. Social insurance contributions, depreciation and existing fixed costs are not included.
Source: Estimated by HotelBank Editorial Team from Ministry of Health, Labour and Welfare “National List of Regional Minimum Wages,” Agency for Natural Resources and Energy “Petroleum Product Price Survey,” and MetroEngines Research
Even if the selling rate drops to ¥8,000, at a 30% variable cost ratio about 3.6 rooms a day would cover the additional fixed costs. In a market where ¥15,000 is achievable, the break-even falls to just under 2 rooms a day (year-round listed properties in Nasu achieve ¥17,400 even in the off-season month of February). Operators should plug in their own figures to see whether the rate level or variable-cost control has more effect.
Of course, this is a simplified estimate that excludes social insurance contributions, depreciation and existing fixed costs, and it differs from each property’s actual cost structure. Even so, knowing the off-season market rate and the number of properties selling that month makes it possible to discuss “how many rooms we would need to sell if we opened” in concrete numbers. Phased options are also conceivable, such as winter-only properties resuming sales only on weekends or during the summer holidays, or opening only for training-camp, corporate-training and long-stay demand.
Methodological Limits — A Stopped Listing Is Not Necessarily a Closure
The “listed properties” in this article are properties for which a selling price was observed on major booking sites, not properties in operation. There are at least four possible reasons for a property to be unlisted in a given month. First, it is closed for the season. Second, it is fully booked and shows no selling price. Third, it sells through channels other than booking sites, such as repeat guests, groups, phone bookings or overseas booking channels. Fourth, the property is managing its inventory, for example with minimum-stay settings or a temporary sales stop. All of these can be changed by the property at any time, so a decline in listings cannot simply be read as a “closure.”
In this article we tried to isolate the effect of seasonal operation as far as possible by removing nationwide fluctuations, confirming recurrence over two seasons and examining each property’s pattern of listed months. Even so, some areas — such as Kutchan in winter or the seaside in summer — still see listings thin because of full occupancy and sales through other channels at peak times. Where the direction of the swing coincides with the area’s peak season, it is more likely to indicate strong sales than seasonal operation. In addition, estimated settled ADR is calculated for ryokan, resort hotels and similar properties, and excludes rates for the pensions, minshuku, lodges and vacation rentals that are common among seasonally listed properties.
Frequently Asked Questions
Q. Which prefectures have the most lodging coming and going with the seasons?
A. By the swing in monthly listed properties on major booking sites (after removing nationwide fluctuations, September 2024–August 2025), the top three are Niigata at 14.5%, Hokkaido at 12.1% and Yamanashi at 11.8%. Tokyo was 2.7%.
Q. How do ski areas differ from highland areas?
A. Ski areas (8 municipalities including Yuzawa and Yamanouchi) follow an “open in winter” pattern, with listings rising in December–March and thinning in June, and a swing of about 31%. Highland, lakeside and eastern Hokkaido areas (11 municipalities including Yamanakako and Nasu) follow a “close in winter” pattern, thinning in January–February, with a swing of about 17%.
Q. What rates do properties open in the off-season achieve?
A. Comparing the estimated settled ADR of properties selling year-round on a same-property basis, off-season months were 60–87% of the peak month. In Katashina and Myoko, ADR in August, when listings thin, exceeded the ski season.
Summary
Reading the number of properties listed on major booking sites as a proxy for seasonal operation, the areas where lodging comes and goes with the seasons are concentrated in snow-country and highland prefectures, led by Niigata, Hokkaido and Yamanashi. At the municipal level, the opposite rhythms — ski areas opening in winter, highlands and lakesides closing in winter — were confirmed over two consecutive seasons. And year-round properties that keep selling in the thin months sustain ADR at 60–90% of the peak month, with some cases, such as summer in Katashina and Myoko, exceeding the peak month.
The off-season market includes not only months of thin demand but also months in which properties step back all at once, reducing competition on booking sites. For seasonal properties, knowing the market rate and the number of competitors in the months they are closed is the first step toward considering year-round operation or a phased extension of the operating season. Set labor, heating fuel and snow-removal costs against off-season ADR, confirm in numbers how many rooms per day need to be sold, and then identify which months offer room to open.
About the figures in this article: Listed property counts are tallied on the basis of listings on major booking sites and do not match the number of operating or licensed properties in each area. Estimated settled ADR is a model-based estimate and differs from each property’s actual transaction prices. The break-even estimate is a simplified calculation based on assumptions; actual decisions require detailed examination based on each property’s cost structure.
Related Articles
References and Sources
■ Data sources
Listed price data collected daily from major booking sites by MetroEngines Research, aggregated to monthly figures: monthly listed properties in 47 prefectures (national total of 29,677–30,900 per month during the period), monthly listed properties in the 218 municipalities with a monthly maximum of at least 15 listed properties, and property-level listed months and estimated settled ADR for 10 municipalities including Yuzawa (September 2024–August 2025; recurrence checked for September 2025–February 2026).
■ Calculation assumptions
The swing is calculated by converting each area’s monthly listed properties into a ratio against nationwide listed properties excluding that area, then taking (maximum − minimum) ÷ maximum over 12 months. Properties coming and going = swing × 12-month average of listed properties. Break-even is a simplified estimate dividing additional fixed costs (minimum wage ¥1,121 × 8 hours × 2 people × 30 days + kerosene ¥2,499 per 18 liters × 30 cans) by ADR × (1 − 30% variable cost ratio).
■ Limitations and caveats
Listed property counts are the number of properties for which a selling price was observed on booking sites, not the number of operating or licensed properties. Declines in listings include, besides seasonal closures, full occupancy, sales through other channels and inventory management. Estimated settled ADR is a model-based estimate (median error of about 7% against disclosures by listed hotel REITs) and excludes pensions, minshuku, lodges and vacation rentals. The break-even estimate excludes social insurance contributions, depreciation and existing fixed costs.
- MetroEngines Research — monthly listed properties in 47 prefectures and 218 municipalities, estimated settled ADR (September 2024–February 2026)
- Ministry of Health, Labour and Welfare, “National List of Regional Minimum Wages” (Japanese)
- Ministry of Health, Labour and Welfare, “Trends in Minimum Wage Increases (National Weighted Average)” (Japanese)
- Agency for Natural Resources and Energy, “Petroleum Product Price Survey: Results” (Japanese)
- Japan Tourism Agency, “Overnight Travel Statistics Survey” (Japanese)