

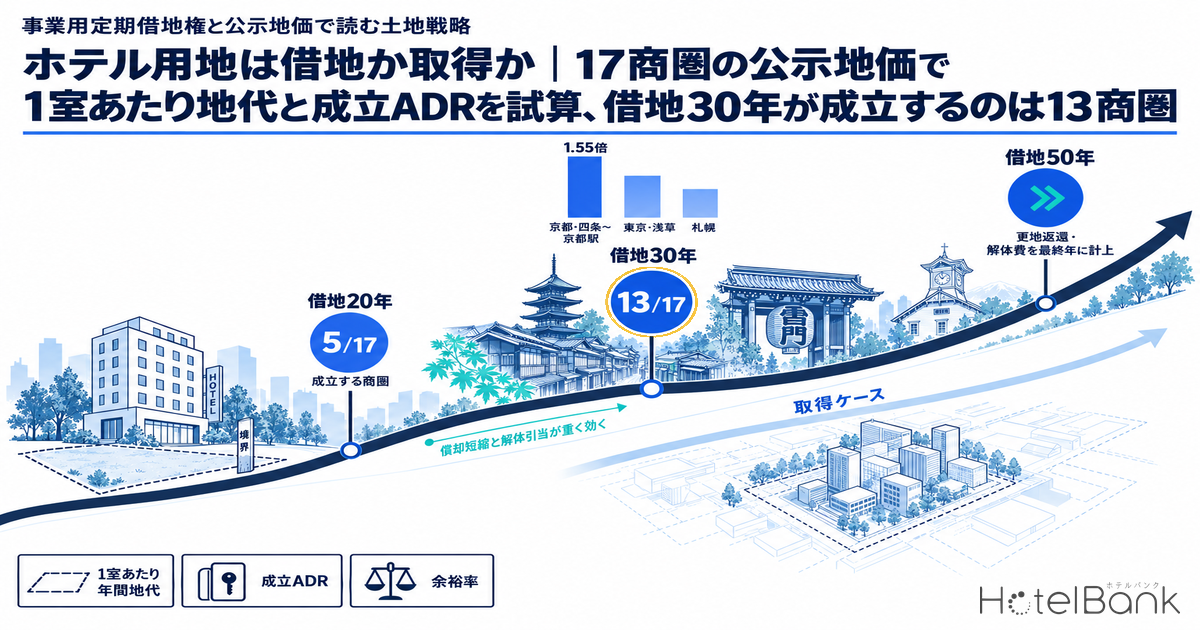
As an alternative to buying land outright for new hotel development, the fixed-term business land lease (jigyo-yo teiki shakuchiken) is spreading, led by public-land tenders and station-front redevelopment. Because ground rent is set by multiplying the vacant-land value by an expected yield, the annual rent each room must carry differs nearly tenfold between a market where the official land price is in the ¥600Ks per ㎡ and one above ¥10M per ㎡, even at the same yield. This article takes commercial-land prices for 17 major markets from the 2026 Official Land Price Publication (Chika Koji) in the MLIT Real Estate Information Library, derives the site area and annual ground rent per room for 100- and 150-room models from the designated floor-area ratio (FAR) and a per-room gross floor area (GFA) unit, and then uses MetroEngines Research’s estimated settled ADR and a full-year occupancy assumption to compare the “ADR that still breaks even after paying ground rent” against the purchase case. The demolition cost of returning a cleared site at lease expiry is always booked as a final-year cost, and the room for viability is read across three terms: 20, 30 and 50 years.
Metric Definitions Used in This Article
- ADR (Average Daily Rate): Estimated settled rate (tax-exclusive equivalent), calculated by applying a segment-specific adjustment factor to the lowest-plan rate each property publishes on OTAs (2 guests per room, per-room price, tax-inclusive). Checked against property-level results disclosed by listed hotel REITs (91 properties, latest 3 months), the median error is about 7%. These are estimates and differ from each property’s actual transaction prices and accounting figures. Area-level ADR is the median of the properties covered (the level of a typical property in the area); this article uses the 12-month average from September 2025 to August 2026 for business hotels in each ward as the “market ADR”.
- OCC (Occupancy Rate): Share of rooms sold relative to total rooms in the area (an estimate based on OTA sales inventory). However, the 75/80/85% used in this article’s model are not observed values but full-year occupancy assumptions (model inputs).
- Official Land Price: Price per ㎡ of commercial standard sites in MLIT’s Official Land Price Publication (as of January 1, 2026). For each market, the median of standard sites within a 1km radius of the center point is used.
- Break-even ADR: The ADR at which GOP (revenue × 40% GOP margin) exactly covers the annual fixed burden per room — land cost (ground rent, or for purchase, interest plus property tax and city planning tax equivalents), building depreciation and borrowing interest, and, for leasehold, the demolition-cost reserve. It is the break-even level where profit after capital costs is zero, and excludes investors’ target returns.
- Data sources: MetroEngines Research (ADR); MLIT Real Estate Information Library (land prices, FAR)
To state the conclusion first: assuming a 4% ground-rent yield and 80% full-year OCC, a 30-year lease leaves market ADR above break-even ADR (headroom ratio of 1.0 or higher) in 13 of the 17 markets, with the most headroom in Kyoto (Shijo–Kyoto Sta.) at 1.55x, Tokyo (Asakusa) at 1.45x and Sapporo at 1.40x. Shortening the lease to 20 years cuts that to 5 markets, showing that the burden of depreciating the building over 20 years plus the demolition reserve weighs more heavily than the ground rent itself. The purchase case works in all 17 markets if land is assumed 100% debt-financed at 2.0%, but once one factors in the reality that the ¥3.57M–¥31.91M per room invested in land is funded with equity or a higher cost of capital, the picture changes: in the four central-Tokyo markets where land per room exceeds ¥16M, leasehold becomes viable first once the cost of capital for land exceeds 3.5–3.8%.
- — A 30-yr lease at 4% rent and 80% full-year OCC works in 13 of 17 markets (headroom ratio ≥1.0). Kyoto (Shijo–Kyoto Sta.) 1.55, Tokyo (Asakusa) 1.45 and Sapporo 1.40 lead.
- — A 20-yr lease shrinks that to 5 markets. The extra 20-year depreciation burden of ¥344K/room plus the demolition reserve outweighs ground rent, the more so the cheaper the land.
- — The crossover point is 3.5–3.8% in the four central-Tokyo markets. Where land per room exceeds ¥16M, leasehold works first once the purchaser’s cost of capital for land exceeds this rate.
- — The crossover points for Naha, Kobe and Kyoto are 5.2–5.9%. Where land per room is below ¥5M, purchase works first; if leasing, extending the term does more than negotiating the rent.
- — Borderline Shinjuku Sta. and Shimbashi–Hamamatsucho flip on one point of ground-rent yield. At 3% rent the headroom ratio is 1.15–1.16; at 5% it is 0.89.
Fixed-Term Business Land Lease vs. General Fixed-Term Land Lease — Which Is Used for Hotels?
Let us start by sorting out the legal framework. The Act on Land and Building Leases provides three types of fixed-term land lease, and the two that are options for hotel sites are the fixed-term business land lease under Article 23 and the general fixed-term land lease under Article 22. A fixed-term business land lease is for owning a building “used exclusively for business (excluding residential use)”, with a term set at 10 years or more but less than 50 years. For terms of 30 to under 50 years (paragraph 1), a special clause must exclude renewal and building-purchase claims; for terms of 10 to under 30 years (paragraph 2), the renewal and purchase-claim provisions simply do not apply by law. Both require a contract executed as a notarial deed, and the fact that a lease lacking a notarial deed does not take effect as a fixed-term lease is probably the point practitioners watch most closely.
A general fixed-term land lease requires a term of 50 years or more, with a special clause excluding renewal, extension and purchase claims set out in writing (including electronic records). Because hotels are not buildings in which people reside continuously, they qualify for the fixed-term business land lease, and since the amendment effective January 2008 raised the cap from 20 years to under 50 years, it has become easier to use for commercial purposes including hotels. In practice, the fixed-term business land lease dominates in municipal tenders to attract hotels onto public land (for example, the “hotel and other private revenue facility attraction project” announced by Okazaki City in April 2026 presupposes a fixed-term business land lease, with the contract planned for March 2027 and operations from FY2028 onward) and in station-front redevelopment, with terms most often in the 20s to 30s of years to match building depreciation and renovation cycles. Meanwhile, long-term deals with private landowners include examples of the general fixed-term land lease: an MLIT case collection features a hotel in front of JR Toyama Station (completed 2000; site 2,884㎡, GFA 14,002㎡) on a 60-year general fixed-term lease with no key money and rent based on “2.3% of the appraised land value”.
| Item | Fixed-term business land lease (Art. 23) | General fixed-term land lease (Art. 22) | Ordinary land lease (Art. 3 onward) |
|---|---|---|---|
| Term | 10 to under 50 yrs (para. 1: 30 to under 50 yrs / para. 2: 10 to under 30 yrs) | 50 yrs or more | 30 yrs or more (renewable) |
| Building use | Exclusively business use (excluding residential). Hotels qualify | No restriction | No restriction |
| Contract form | Notarial deed required | In writing (incl. electronic records) | No document required (valid even orally) |
| Renewal / purchase claims | Para. 2: no renewal or purchase claim by law. Para. 1: excluded by special clause | Renewal, extension and purchase claims excluded by special clause | Renewable. Building-purchase claim right exists |
| At expiry | As a rule, building removed and site returned cleared | Same as left | Renewal is the default |
| Role in hotel practice | Dominant in public-land tenders and station-front redevelopment. Terms often in the 20s–30s of years | Examples in long-term private-landowner deals (Toyama Sta. front hotel, 60 yrs) | Succession of existing old-law leases, etc. |
Treatment at expiry is the biggest difference from purchase. Because a fixed-term lease excludes the building-purchase claim right, the lessee in principle removes the building and returns the site cleared. A leasehold hotel therefore carries, on top of ground rent, two time constraints — “demolition cost incurred in the final year” and “fully recovering the building investment within the lease term” — and this article’s model always builds both into the fixed burden.
Commercial Official Land Prices in 17 Markets — From ¥620K in Naha to ¥11.1M/㎡ in Ginza, an ~18x Gap in Medians
Next, land prices. From the Official Land Price Publication (as of January 1, 2026) in the MLIT Real Estate Information Library, we aggregated commercial standard sites within a 1km radius of the center of lodging demand in 17 markets: Sapporo, Sendai, Saitama, five markets in Tokyo’s 23 wards (Kanda–Tokyo Sta., Ginza–Nihonbashi, Shinjuku Sta., Asakusa, Shimbashi–Hamamatsucho), Yokohama, Nagoya, Kyoto, two Osaka markets (Umeda, Shinsaibashi–Namba), Kobe, Hiroshima, Fukuoka and Naha. The 314 sites in total are summarized with each market’s median as the representative value and the interquartile range (25–75%) as the range. We use the median because in markets such as Ginza and Shinjuku, where the top sites reach ¥40M–¥67M per ㎡, the average is dragged up by a handful of prime spots and drifts away from realistic price levels for hotel sites.
The highest median is Tokyo (Ginza–Nihonbashi) at ¥11.1M/㎡, and four central-Tokyo markets exceed ¥5M: Shinjuku Sta. ¥7.8M, Shimbashi–Hamamatsucho ¥7.74M and Kanda–Tokyo Sta. ¥5.06M. Next come Osaka (Shinsaibashi–Namba) ¥3.14M, Umeda ¥2.62M, Fukuoka (Hakata Sta.) ¥2.6M, Nagoya Sta. ¥2.52M and Yokohama Sta. ¥2.22M in the ¥2–3M range; Sapporo ¥1.72M, Asakusa ¥1.7M, Hiroshima ¥1.45M, Kyoto ¥1.44M, Sendai ¥1.14M and Kobe ¥1.06M in the ¥1M range; and Saitama ¥880K and Naha ¥620K below ¥1M. Median year-on-year changes were highest in Asakusa (+21.4%), Shinsaibashi–Namba (+15.7%) and Umeda (+14.9%), and gentlest at Nagoya Sta. (+3.7%). The more steadily land prices rise in a market, the more opinions split on whether it is better to lock in the purchase price or to lease under a contract with rent-revision clauses.
| Market (center point) | Ward | Median commercial official land price | Interquartile (25–75%) | Median YoY | Sites | Median designated FAR | Standard site nearest the center |
|---|---|---|---|---|---|---|---|
| Sapporo (Sapporo Sta.–Odori) | Chuo-ku, Sapporo | ¥1.72M/㎡ | ¥1.11M–¥3.7M | +10.0% | 14 (1.0km radius) | 700% | Kita 1-jo Nishi 3-chome 3-22 (¥3,890,000/㎡) |
| Sendai (Sendai Sta. West) | Aoba-ku, Sendai | ¥1.14M/㎡ | ¥860K–¥2.33M | +10.0% | 27 (1.0km radius) | 500% | Chuo 1-chome 813 (¥4,880,000/㎡) |
| Saitama (Omiya Sta.) | Omiya-ku, Saitama | ¥880K/㎡ | ¥590K–¥1.68M | +6.6% | 16 (1.0km radius) | 400% | Nakacho 1-chome 77-1 (¥1,500,000/㎡) |
| Tokyo (Kanda–Tokyo Sta.) | Chiyoda-ku | ¥5.06M/㎡ | ¥3.42M–¥7.54M | +13.5% | 23 (1.0km radius) | 700% | Uchikanda 2-chome 9-15 (¥4,330,000/㎡) |
| Tokyo (Ginza–Nihonbashi) | Chuo-ku | ¥11.1M/㎡ | ¥5.05M–¥27.5M | +10.4% | 32 (1.0km radius) | 800% | Ginza 2-chome 2-19 et al. (¥49,600,000/㎡) |
| Tokyo (Shinjuku Sta.) | Shinjuku-ku | ¥7.8M/㎡ | ¥3.15M–¥14.2M | +11.8% | 21 (1.0km radius) | 800% | Shinjuku 3-chome 807-1 et al. (¥42,000,000/㎡) |
| Tokyo (Asakusa) | Taito-ku | ¥1.7M/㎡ | ¥1.24M–¥2.04M | +21.4% | 13 (1.0km radius) | 600% | Asakusa 1-chome 16-14 et al. (¥9,150,000/㎡) |
| Tokyo (Shimbashi–Hamamatsucho) | Minato-ku | ¥7.74M/㎡ | ¥4.06M–¥12.4M | +13.7% | 21 (1.0km radius) | 700% | Higashi-Shimbashi 2-chome 59-6 et al. (¥5,060,000/㎡) |
| Yokohama (Yokohama Sta.) | Nishi-ku, Yokohama | ¥2.22M/㎡ | ¥960K–¥4.18M | +12.4% | 14 (1.0km radius) | 500% | Minamisaiwai 1-chome 3-1 (¥17,100,000/㎡) |
| Nagoya (Nagoya Sta.) | Nakamura-ku, Nagoya | ¥2.52M/㎡ | ¥1.27M–¥6.65M | +3.7% | 25 (1.0km radius) | 700% | Meieki 4-chome 701-1 et al. (¥19,800,000/㎡) |
| Kyoto (Shijo–Kyoto Sta.) | Shimogyo-ku, Kyoto | ¥1.44M/㎡ | ¥1.07M–¥2.11M | +11.4% | 13 (1.0km radius) | 700% | Nakanocho 172, Matsubara-dori Shinmachi Higashi-iru (¥800,000/㎡) |
| Osaka (Umeda) | Kita-ku, Osaka | ¥2.62M/㎡ | ¥2.09M–¥8.06M | +14.9% | 20 (1.0km radius) | 600% | Kakudacho 12-1 et al. (¥14,500,000/㎡) |
| Osaka (Shinsaibashi–Namba) | Chuo-ku, Osaka | ¥3.14M/㎡ | ¥2.12M–¥10.6M | +15.7% | 22 (1.0km radius) | 800% | Soemoncho 46-1 et al. (¥25,000,000/㎡) |
| Kobe (Sannomiya) | Chuo-ku, Kobe | ¥1.06M/㎡ | ¥660K–¥3.05M | +8.5% | 16 (1.0km radius) | 600% | Sannomiyacho 1-chome 7-6 et al. (¥8,000,000/㎡) |
| Hiroshima (Kamiyacho–Hatchobori) | Naka-ku, Hiroshima | ¥1.45M/㎡ | ¥940K–¥2.46M | +5.7% | 20 (1.0km radius) | 600% | Tatemachi 4-2 (¥1,450,000/㎡) |
| Fukuoka (Hakata Sta.) | Hakata-ku, Fukuoka | ¥2.6M/㎡ | ¥1.91M–¥4.92M | +9.6% | 11 (1.0km radius) | 500% | Hakata Ekimae 3-chome 46-2 et al. (¥8,180,000/㎡) |
| Naha (Kenchomae–Kokusai-dori) | Naha City | ¥620K/㎡ | ¥470K–¥800K | +7.4% | 6 (1.0km radius) | 400% | Kumoji 3-chome 1-1 (¥2,260,000/㎡) |
Back-Calculating Site Area from FAR and GFA per Room — Annual Ground Rent of ¥140K–¥1.28M per Room (4% Yield)
To turn land prices into a per-room cost, we need the site area each room occupies. This article uses 23㎡ of GFA per room for a new business-type (limited-service) hotel as the base unit (13–15㎡ guest rooms plus common areas such as corridors, lobby and plant rooms), and divides it by the median designated FAR of each market’s commercial standard sites to obtain site area per room. At 700% FAR, 23÷7 = 3.29㎡ of site per room; at 400%, 5.75㎡. A 100-room hotel has 2,300㎡ of GFA, which in a 600% FAR market requires a 383㎡ site (about 116 tsubo), and a 150-room hotel needs 575㎡. In practice, FAR limits tied to front-road width and setback (slant-plane) restrictions often prevent full use of the designated FAR, so the site areas shown here should be read as lower bounds.
| Segment | GFA per room | 100-room GFA | 150-room GFA | Site at 600% FAR (100 rooms) | Site at 600% FAR (150 rooms) |
|---|---|---|---|---|---|
| Business (limited-service) | 23㎡ | 2,300㎡ | 3,450㎡ | 383㎡ | 575㎡ |
| Midscale–upper midscale | 35㎡ | 3,500㎡ | 5,250㎡ | 583㎡ | 875㎡ |
| Full-service | 60㎡ | 6,000㎡ | 9,000㎡ | 1,000㎡ | 1,500㎡ |
Multiplying site area per room by the official land price gives land cost per room. It ranges from ¥3.57M in Naha to ¥31.91M in Ginza–Nihonbashi, again a gap of almost 9x. Notably, the ranking by land price does not match the ranking by land cost per room. Shinsaibashi–Namba has a higher land price than Umeda at ¥3.14M/㎡, but its median FAR of 800% brings land per room to ¥9.04M, below Umeda’s ¥10.06M. Nagoya Sta. likewise stays at ¥8.28M thanks to 700% FAR, while Saitama (Omiya Sta.), with 400% FAR, has a low land price of ¥880K/㎡ yet land per room of ¥5.05M, on a par with Sendai at ¥5.24M and Kyoto at ¥4.73M. This shows a structure specific to hotel development: the higher the FAR of a commercial district, the more its high land price is diluted across floor area.
Annual ground rent is obtained by multiplying land cost per room by the expected ground-rent yield. With yields in a 3–6% range, at 4% the rent is about ¥140K–¥260K for Naha ¥143K, Kyoto ¥189K, Kobe ¥163K, Sapporo ¥227K and Asakusa ¥261K; around ¥400K for Fukuoka ¥478K, Yokohama ¥408K and Umeda ¥402K; and in a ¥600K–¥1.3M band for Kanda–Tokyo Sta. ¥665K, Shinjuku ¥897K, Shimbashi–Hamamatsucho ¥1.017M and Ginza–Nihonbashi ¥1.277M. Per day, a room must earn about ¥390 every day in Naha and about ¥3,500 in Ginza–Nihonbashi just to cover the rent — a figure that can be compared directly with ADR levels.
| Market | FAR | Site/room | 100-room site | 150-room site | Land cost/room | Rent 3% | Rent 4% | Rent 5% | Rent 6% |
|---|---|---|---|---|---|---|---|---|---|
| Sapporo (Sapporo Sta.–Odori) | 700% | 3.29㎡ | 329㎡ (99 tsubo) | 493㎡ | ¥5.67M | ¥170K | ¥227K | ¥283K | ¥340K |
| Sendai (Sendai Sta. West) | 500% | 4.60㎡ | 460㎡ (139 tsubo) | 690㎡ | ¥5.24M | ¥157K | ¥210K | ¥262K | ¥315K |
| Saitama (Omiya Sta.) | 400% | 5.75㎡ | 575㎡ (174 tsubo) | 862㎡ | ¥5.05M | ¥151K | ¥202K | ¥252K | ¥303K |
| Tokyo (Kanda–Tokyo Sta.) | 700% | 3.29㎡ | 329㎡ (99 tsubo) | 493㎡ | ¥16.63M | ¥499K | ¥665K | ¥831K | ¥998K |
| Tokyo (Ginza–Nihonbashi) | 800% | 2.88㎡ | 288㎡ (87 tsubo) | 431㎡ | ¥31.91M | ¥957K | ¥1.277M | ¥1.596M | ¥1.915M |
| Tokyo (Shinjuku Sta.) | 800% | 2.88㎡ | 288㎡ (87 tsubo) | 431㎡ | ¥22.42M | ¥673K | ¥897K | ¥1.121M | ¥1.346M |
| Tokyo (Asakusa) | 600% | 3.83㎡ | 383㎡ (116 tsubo) | 575㎡ | ¥6.52M | ¥196K | ¥261K | ¥326K | ¥391K |
| Tokyo (Shimbashi–Hamamatsucho) | 700% | 3.29㎡ | 329㎡ (99 tsubo) | 493㎡ | ¥25.43M | ¥763K | ¥1.017M | ¥1.272M | ¥1.526M |
| Yokohama (Yokohama Sta.) | 500% | 4.60㎡ | 460㎡ (139 tsubo) | 690㎡ | ¥10.21M | ¥306K | ¥408K | ¥511K | ¥613K |
| Nagoya (Nagoya Sta.) | 700% | 3.29㎡ | 329㎡ (99 tsubo) | 493㎡ | ¥8.28M | ¥248K | ¥331K | ¥414K | ¥497K |
| Kyoto (Shijo–Kyoto Sta.) | 700% | 3.29㎡ | 329㎡ (99 tsubo) | 493㎡ | ¥4.73M | ¥142K | ¥189K | ¥237K | ¥284K |
| Osaka (Umeda) | 600% | 3.83㎡ | 383㎡ (116 tsubo) | 575㎡ | ¥10.06M | ¥302K | ¥402K | ¥503K | ¥604K |
| Osaka (Shinsaibashi–Namba) | 800% | 2.88㎡ | 288㎡ (87 tsubo) | 431㎡ | ¥9.04M | ¥271K | ¥362K | ¥452K | ¥543K |
| Kobe (Sannomiya) | 600% | 3.83㎡ | 383㎡ (116 tsubo) | 575㎡ | ¥4.08M | ¥122K | ¥163K | ¥204K | ¥245K |
| Hiroshima (Kamiyacho–Hatchobori) | 600% | 3.83㎡ | 383㎡ (116 tsubo) | 575㎡ | ¥5.56M | ¥167K | ¥222K | ¥278K | ¥334K |
| Fukuoka (Hakata Sta.) | 500% | 4.60㎡ | 460㎡ (139 tsubo) | 690㎡ | ¥11.96M | ¥359K | ¥478K | ¥598K | ¥718K |
| Naha (Kenchomae–Kokusai-dori) | 400% | 5.75㎡ | 575㎡ (174 tsubo) | 862㎡ | ¥3.57M | ¥107K | ¥143K | ¥179K | ¥214K |
The ADR That Still Works After Paying Ground Rent — 13 Markets on a 30-Year Lease; Kyoto, Asakusa and Sapporo Above 1.4x Headroom
This is the core of the article. We derive the “break-even ADR” by deducting ground rent from a simplified GOP and compare it with the market’s estimated settled ADR. Market ADR is the 12-month average (September 2025–August 2026) of the estimated settled ADR calculated by MetroEngines Research for business hotels in each ward; for Chuo-ku, Kobe, we used an 11-month average excluding November 2025, when the number of observed properties fell below 60% of other months (Nishi-ku, Yokohama covers only 5–6 properties and should be read as a reference value).
■ Model assumptions
- GFA unit: 23㎡/room (business type). Site/room = 23㎡ ÷ designated FAR (median of the market’s commercial standard sites).
- Building investment: ¥16.73M/room (steel frame, ¥2.405M per tsubo × 6.96 tsubo. The per-tsubo cost is the 2025 national figure based on construction starts statistics, excluding design supervision, FF&E and pre-opening costs).
- Revenue: rooms revenue only, ADR × full-year OCC × 365 days. GOP margin 40% (mid-range for limited-service hotels; the GOP margin actually reported by a listed REIT for its operated hotels was 38.9% for the fiscal period ended December 2024).
- Leasehold: ground rent = land cost/room × expected ground-rent yield (base 4%, sensitivity 3–6%). The building is depreciated straight-line over the shorter of the lease term and 34 years (a model assumption; the statutory useful life under tax law for steel-frame hotels with framing over 4mm is 29 years). Building borrowing rate 2.0%. Demolition cost of ¥70K per tsubo for steel frame (¥487K/room), escalated at 2% a year, is booked at its nominal amount in the expiry year and reserved evenly over the term.
- Purchase: land cost = median official land price × site/room (no adjustment for divergence from market transaction prices). Land borrowing rate 1.5/2.0/2.5%, plus property tax and city planning tax equivalent of 0.8% of the official land price (assessed value = 70% of official price, taxable-base cap = 70% of assessed value, combined tax rate 1.7%). Building depreciated over 34 years at a 2.0% borrowing rate.
- Break-even ADR = annual fixed burden ÷ (GOP margin × full-year OCC × 365). Headroom ratio = market ADR ÷ break-even ADR. 1.0 or above means room for viability.
The results show that with a 30-year lease, 4% rent and 80% full-year OCC, the headroom ratio exceeds 1.0 in 13 markets: Kyoto (Shijo–Kyoto Sta.), Tokyo (Asakusa), Sapporo (Sapporo Sta.–Odori), Yokohama (Yokohama Sta.), Kobe (Sannomiya), Tokyo (Kanda–Tokyo Sta.), Fukuoka (Hakata Sta.), Osaka (Shinsaibashi–Namba), Naha (Kenchomae–Kokusai-dori), Saitama (Omiya Sta.), Tokyo (Shimbashi–Hamamatsucho), Hiroshima (Kamiyacho–Hatchobori) and Tokyo (Shinjuku Sta.). Kyoto (Shijo–Kyoto Sta.) has a market ADR of ¥14,800 against a break-even ADR of ¥9,500 for a 1.55x headroom ratio; Asakusa ¥14,600 vs. ¥10,100 for 1.45x; and Sapporo ¥13,800 vs. ¥9,800 for 1.40x — all markets where land prices stay in the ¥1M range while ADR reaches around ¥14,000. The obvious structure — that the ratio of land price to ADR decides viability — is confirmed by the numbers.
By contrast, the headroom ratio fell below 1.0 in four markets: Sendai (Sendai Sta. West), Tokyo (Ginza–Nihonbashi), Nagoya (Nagoya Sta.) and Osaka (Umeda). They split into two types, however. Ginza–Nihonbashi has the highest market ADR of the 17 at ¥17,900, yet annual ground rent of ¥1.28M per room accounts for more than half the fixed burden and pushes break-even ADR to ¥18,800 — a “land-price-led” case. Sendai, Nagoya Sta. and Umeda, on the other hand, have average break-even ADRs of ¥9,700–¥11,300, but business-hotel estimated settled ADR is only ¥9,300–¥10,700 — a “rate-led” case within reach of viability if ADR rises 10%. Shinjuku Sta. and Hiroshima sit right around 1.0, borderline markets where the verdict can move with a single assumption.
| Market | Est. settled ADR (12-mo avg) | Properties N | Break-even ADR, 30-yr lease | Headroom | Break-even ADR, purchase at 1.5% | Purchase 2.0% | Purchase 2.5% | Headroom (purchase 2.0%) |
|---|---|---|---|---|---|---|---|---|
| Sapporo (Sapporo Sta.–Odori) | ¥13,777 | 99–105 | ¥9,833 | 1.40 | ¥8,195 | ¥8,437 | ¥8,680 | 1.63 |
| Sendai (Sendai Sta. West) | ¥9,285 | 55–56 | ¥9,688 | 0.96 | ¥8,111 | ¥8,336 | ¥8,560 | 1.11 |
| Saitama (Omiya Sta.) | ¥9,840 | 13–15 | ¥9,621 | 1.02 | ¥8,073 | ¥8,289 | ¥8,505 | 1.19 |
| Tokyo (Kanda–Tokyo Sta.) | ¥16,135 | 63–65 | ¥13,586 | 1.19 | ¥10,353 | ¥11,064 | ¥11,776 | 1.46 |
| Tokyo (Ginza–Nihonbashi) | ¥17,949 | 127–129 | ¥18,821 | 0.95 | ¥13,363 | ¥14,729 | ¥16,095 | 1.22 |
| Tokyo (Shinjuku Sta.) | ¥15,640 | 69–78 | ¥15,572 | 1.00 | ¥11,495 | ¥12,455 | ¥13,415 | 1.26 |
| Tokyo (Asakusa) | ¥14,649 | 148–162 | ¥10,124 | 1.45 | ¥8,362 | ¥8,641 | ¥8,920 | 1.70 |
| Tokyo (Shimbashi–Hamamatsucho) | ¥16,801 | 95–98 | ¥16,602 | 1.01 | ¥12,087 | ¥13,175 | ¥14,264 | 1.28 |
| Yokohama (Yokohama Sta.) | ¥15,033 | 5–6 | ¥11,390 | 1.32 | ¥9,090 | ¥9,527 | ¥9,964 | 1.58 |
| Nagoya (Nagoya Sta.) | ¥10,068 | 63–65 | ¥10,728 | 0.94 | ¥8,709 | ¥9,064 | ¥9,418 | 1.11 |
| Kyoto (Shijo–Kyoto Sta.) | ¥14,768 | 111–118 | ¥9,513 | 1.55 | ¥8,010 | ¥8,213 | ¥8,415 | 1.80 |
| Osaka (Umeda) | ¥10,667 | 53–55 | ¥11,338 | 0.94 | ¥9,060 | ¥9,491 | ¥9,922 | 1.12 |
| Osaka (Shinsaibashi–Namba) | ¥12,322 | 155–159 | ¥10,989 | 1.12 | ¥8,859 | ¥9,246 | ¥9,633 | 1.33 |
| Kobe (Sannomiya) | ¥11,061 | 40–40 (11 months) | ¥9,290 | 1.19 | ¥7,883 | ¥8,057 | ¥8,232 | 1.37 |
| Hiroshima (Kamiyacho–Hatchobori) | ¥9,843 | 48–53 | ¥9,796 | 1.00 | ¥8,173 | ¥8,411 | ¥8,649 | 1.17 |
| Fukuoka (Hakata Sta.) | ¥14,096 | 131–134 | ¥11,988 | 1.18 | ¥9,434 | ¥9,946 | ¥10,458 | 1.42 |
| Naha (Kenchomae–Kokusai-dori) | ¥9,448 | 103–106 | ¥9,115 | 1.04 | ¥7,782 | ¥7,935 | ¥8,088 | 1.19 |
What about the purchase case? If land is assumed fully debt-financed at 2.0%, land cost is only 2.8% (2.0% interest + 0.8% tax), so break-even ADR is about ¥1,200–¥4,100 lower than for a 30-year lease, and the headroom ratio exceeds 1.0 in all 17 markets. Even at a 2.5% rate, Ginza–Nihonbashi is the highest at ¥16,100 and keeps a 1.12x headroom ratio against market ADR. Looking only at the annual burden, purchase always comes out lighter — but that follows from assuming land can be 100% financed with debt at 2.0%; real investments carry a target return on equity. We therefore back-calculated “the cost of capital for land above which leasehold (4% rent, 30 years) becomes viable first”. Separately, an earlier HotelBank analysis of 15 station-front commercial districts, which required a 5.0% target NOI yield on total invested capital including land, found that leasehold at a 4.5% ground-rent yield lowered the required ADR in all 15 cities, by up to ¥14,000. Because the assumptions (target yield, occupancy, sites covered) differ, the levels cannot be compared directly, but the direction — the higher the cost of capital for land, the sooner leasehold becomes viable — matches this article’s crossover points.
That crossover point is 3.5% for Ginza–Nihonbashi, where land per room is ¥31.91M, 3.6% for Shimbashi–Hamamatsucho, 3.6% for Shinjuku Sta. and 3.8% for Kanda–Tokyo Sta. — a 3.5–3.8% range for the four central-Tokyo markets where land per room exceeds ¥16M. For investors whose cost of capital for land, including equity, exceeds 4%, leasehold works first in these markets. Conversely, in Naha (¥3.57M, 5.9%), Kobe (¥4.08M, 5.5%) and Kyoto (¥4.73M, 5.2%), where land per room is below ¥5M, the crossover point rises to 5.2–5.9%; because the demolition reserve and shorter depreciation offset the lightness of the rent, purchase works first unless the cost of capital is very high. The price band in which leasehold has the edge can be summarized as “land cost per room of roughly ¥16M or more” — in official land price terms, above ¥5M/㎡ in markets with 700–800% FAR.
20, 30 and 50 Years — The Shorter the Term, the More Depreciation and Demolition Matter, Not Ground Rent
How does break-even ADR move as the lease term changes? On the premise that the building investment is recovered within the lease term, a 20-year lease depreciates the ¥16.73M/room building over 20 years, or ¥837K a year — an extra ¥344K per room compared with ¥492K a year over 34 years. On a 30-year lease the extra burden shrinks to ¥66K, and on a 50-year general fixed-term lease there is none, since depreciation ends at the model’s 34-year life. This depreciation gap is added in the same amount to every market regardless of ground rent, so it weighs relatively more where land is cheap. In Naha, ground rent at 4% is ¥143K/room while the extra 20-year depreciation is ¥344K — 2.4 times the rent — whereas in Ginza–Nihonbashi it is only 27% of the ¥1.28M rent.
Demolition cost works in the same direction. Setting steel-frame demolition at ¥70K per tsubo (the top of the 2026 range of ¥45K–¥70K for heavy steel frame) and 6.96 tsubo per room gives ¥487K/room today; with 2% annual escalation, the nominal amount grows to ¥724K after 20 years, ¥882K after 30 years and ¥1.311M after 50 years. For 100 rooms that means a cash outlay of ¥72.37M at expiry of a 20-year lease and ¥131M at expiry of a 50-year lease, all in the final year. Reserved evenly over the term, it is ¥36K–¥26K per room per year and looks small next to ground rent, but because it falls due as a lump sum in the final year, cash flow in the second half of the lease must be managed separately from renovation spending.
| Term | Nominal demolition cost (100 rooms, +2%/yr) | Annual reserve (100 rooms) | Annual reserve per room | Building depreciation period (model) |
|---|---|---|---|---|
| 20 yrs | ¥72.37M | ¥3.62M | ¥36K | 20 yrs |
| 30 yrs | ¥88.22M | ¥2.94M | ¥29K | 30 yrs |
| 50 yrs | ¥131.09M | ¥2.62M | ¥26K | 34 yrs |
Placing the three cases side by side, a 20-year lease works in only five markets — Sapporo (Sapporo Sta.–Odori), Tokyo (Kanda–Tokyo Sta.), Tokyo (Asakusa), Yokohama (Yokohama Sta.) and Kyoto (Shijo–Kyoto Sta.) — expanding to 13 at 30 years and 14 at 50 years. The gap in break-even ADR between 20 and 50 years is almost constant at about ¥3,000 in every market; it is simply the ¥344K shorter-depreciation burden plus the difference in demolition reserve divided back by 80% full-year OCC and a 40% GOP margin. In other words, lengthening the term in a high-land-price market does not lighten the rent, while in a low-land-price market a longer term alone can bring the project into viability. The implication of the table is that when a public-land tender offers a term of around 20 years, the more regional the core city, the more “negotiating to extend the term to 30 years or more” achieves compared with negotiating the rent. How the contract term changes the burden of recovering the building investment is also laid out term by term in our analysis back-calculating maximum supportable ground rent in nine markets.
| Market | Market ADR | 20-yr lease | Headroom | 30-yr lease | Headroom | 50-yr lease (general fixed-term) | Headroom | Land cost of capital at which leasehold equals purchase (30 yrs) |
|---|---|---|---|---|---|---|---|---|
| Sapporo (Sapporo Sta.–Odori) | ¥13,777 | ¥12,279 | 1.12 | ¥9,833 | 1.40 | ¥9,244 | 1.49 | 4.88% |
| Sendai (Sendai Sta. West) | ¥9,285 | ¥12,134 | 0.77 | ¥9,688 | 0.96 | ¥9,099 | 1.02 | 5.01% |
| Saitama (Omiya Sta.) | ¥9,840 | ¥12,067 | 0.82 | ¥9,621 | 1.02 | ¥9,032 | 1.09 | 5.08% |
| Tokyo (Kanda–Tokyo Sta.) | ¥16,135 | ¥16,032 | 1.01 | ¥13,586 | 1.19 | ¥12,997 | 1.24 | 3.77% |
| Tokyo (Ginza–Nihonbashi) | ¥17,949 | ¥21,267 | 0.84 | ¥18,821 | 0.95 | ¥18,232 | 0.98 | 3.50% |
| Tokyo (Shinjuku Sta.) | ¥15,640 | ¥18,018 | 0.87 | ¥15,572 | 1.00 | ¥14,983 | 1.04 | 3.62% |
| Tokyo (Asakusa) | ¥14,649 | ¥12,570 | 1.17 | ¥10,124 | 1.45 | ¥9,535 | 1.54 | 4.66% |
| Tokyo (Shimbashi–Hamamatsucho) | ¥16,801 | ¥19,047 | 0.88 | ¥16,602 | 1.01 | ¥16,013 | 1.05 | 3.57% |
| Yokohama (Yokohama Sta.) | ¥15,033 | ¥13,835 | 1.09 | ¥11,390 | 1.32 | ¥10,800 | 1.39 | 4.13% |
| Nagoya (Nagoya Sta.) | ¥10,068 | ¥13,174 | 0.76 | ¥10,728 | 0.94 | ¥10,139 | 0.99 | 4.35% |
| Kyoto (Shijo–Kyoto Sta.) | ¥14,768 | ¥11,958 | 1.23 | ¥9,513 | 1.55 | ¥8,924 | 1.65 | 5.21% |
| Osaka (Umeda) | ¥10,667 | ¥13,784 | 0.77 | ¥11,338 | 0.94 | ¥10,749 | 0.99 | 4.14% |
| Osaka (Shinsaibashi–Namba) | ¥12,322 | ¥13,434 | 0.92 | ¥10,989 | 1.12 | ¥10,400 | 1.18 | 4.25% |
| Kobe (Sannomiya) | ¥11,061 | ¥11,736 | 0.94 | ¥9,290 | 1.19 | ¥8,701 | 1.27 | 5.53% |
| Hiroshima (Kamiyacho–Hatchobori) | ¥9,843 | ¥12,242 | 0.80 | ¥9,796 | 1.00 | ¥9,207 | 1.07 | 4.91% |
| Fukuoka (Hakata Sta.) | ¥14,096 | ¥14,434 | 0.98 | ¥11,988 | 1.18 | ¥11,399 | 1.24 | 3.99% |
| Naha (Kenchomae–Kokusai-dori) | ¥9,448 | ¥11,561 | 0.82 | ¥9,115 | 1.04 | ¥8,526 | 1.11 | 5.86% |
Sensitivity Analysis — How the Break-Even Line Moves with Ground-Rent Yield, Occupancy and ADR
Finally, we check how break-even ADR changes when the assumptions move, across three variables. First, ground-rent yield. Each one-point rise from 3% to 6% raises break-even ADR by land cost per room × 1% ÷ (0.4 × 0.8 × 365), so it moves about ¥310 per point in Naha, where land per room is ¥3.57M, and about ¥2,700 in Ginza–Nihonbashi at ¥31.91M. In markets with large headroom such as Kyoto, Asakusa, Sapporo and Kobe, the verdict does not change whether the yield is 3% or 6%, whereas in central Tokyo a single point in the rent negotiation moves a market in or out of viability. Note that in markets with headroom near 1.0, such as Naha, Saitama, Sendai and Hiroshima, the verdict can flip even though the swing is small. It is fair to say that room for rent negotiation moves break-even ADR substantially only in markets where land per room exceeds ¥10M.
| Market | Rent 3% | Rent 4% | Rent 5% | Rent 6% | Market ADR |
|---|---|---|---|---|---|
| Sapporo (Sapporo Sta.–Odori) | ¥9,348 | ¥9,833 | ¥10,319 | ¥10,804 | ¥13,777 |
| Sendai (Sendai Sta. West) | ¥9,239 | ¥9,688 | ¥10,137 | ¥10,586 | ¥9,285 |
| Saitama (Omiya Sta.) | ¥9,189 | ¥9,621 | ¥10,053 | ¥10,486 | ¥9,840 |
| Tokyo (Kanda–Tokyo Sta.) | ¥12,163 | ¥13,586 | ¥15,009 | ¥16,433 | ¥16,135 |
| Tokyo (Ginza–Nihonbashi) | ¥16,089 | ¥18,821 | ¥21,553 | ¥24,286 | ¥17,949 |
| Tokyo (Shinjuku Sta.) | ¥13,652 | ¥15,572 | ¥17,492 | ¥19,412 | ¥15,640 |
| Tokyo (Asakusa) | ¥9,566 | ¥10,124 | ¥10,682 | ¥11,240 | ¥14,649 |
| Tokyo (Shimbashi–Hamamatsucho) | ¥14,424 | ¥16,602 | ¥18,779 | ¥20,956 | ¥16,801 |
| Yokohama (Yokohama Sta.) | ¥10,515 | ¥11,390 | ¥12,264 | ¥13,138 | ¥15,033 |
| Nagoya (Nagoya Sta.) | ¥10,019 | ¥10,728 | ¥11,437 | ¥12,146 | ¥10,068 |
| Kyoto (Shijo–Kyoto Sta.) | ¥9,108 | ¥9,513 | ¥9,918 | ¥10,323 | ¥14,768 |
| Osaka (Umeda) | ¥10,477 | ¥11,338 | ¥12,200 | ¥13,061 | ¥10,667 |
| Osaka (Shinsaibashi–Namba) | ¥10,215 | ¥10,989 | ¥11,763 | ¥12,537 | ¥12,322 |
| Kobe (Sannomiya) | ¥8,941 | ¥9,290 | ¥9,640 | ¥9,989 | ¥11,061 |
| Hiroshima (Kamiyacho–Hatchobori) | ¥9,320 | ¥9,796 | ¥10,272 | ¥10,748 | ¥9,843 |
| Fukuoka (Hakata Sta.) | ¥10,964 | ¥11,988 | ¥13,012 | ¥14,036 | ¥14,096 |
| Naha (Kenchomae–Kokusai-dori) | ¥8,809 | ¥9,115 | ¥9,421 | ¥9,727 | ¥9,448 |
Second, occupancy. Moving full-year OCC from 80% to 85% lowers break-even ADR uniformly by about 5.9% in every market because the denominator changes, and moving it to 75% raises it by about 6.7%. In Ginza–Nihonbashi, 85% full-year OCC brings break-even ADR down to ¥17,700, for a 1.01x headroom ratio against market ADR of ¥17,900, while at 75% it rises to ¥20,100 and the ratio drops to 0.89x. In many markets five points of occupancy are equivalent to one point of ground-rent yield, so if occupancy is assumed conservatively, a wider rent-negotiation margin is needed.
| Market | Full-year OCC 75% | Full-year OCC 80% | Full-year OCC 85% | Purchase 2.0%, OCC 75% | Full-year OCC 80% | Full-year OCC 85% |
|---|---|---|---|---|---|---|
| Sapporo (Sapporo Sta.–Odori) | ¥10,489 | ¥9,833 | ¥9,255 | ¥9,000 | ¥8,437 | ¥7,941 |
| Tokyo (Kanda–Tokyo Sta.) | ¥14,492 | ¥13,586 | ¥12,787 | ¥11,802 | ¥11,064 | ¥10,413 |
| Tokyo (Ginza–Nihonbashi) | ¥20,076 | ¥18,821 | ¥17,714 | ¥15,711 | ¥14,729 | ¥13,863 |
| Tokyo (Asakusa) | ¥10,799 | ¥10,124 | ¥9,528 | ¥9,217 | ¥8,641 | ¥8,133 |
| Kyoto (Shijo–Kyoto Sta.) | ¥10,147 | ¥9,513 | ¥8,953 | ¥8,760 | ¥8,213 | ¥7,730 |
| Osaka (Shinsaibashi–Namba) | ¥11,721 | ¥10,989 | ¥10,342 | ¥9,863 | ¥9,246 | ¥8,702 |
| Fukuoka (Hakata Sta.) | ¥12,787 | ¥11,988 | ¥11,283 | ¥10,609 | ¥9,946 | ¥9,361 |
| Naha (Kenchomae–Kokusai-dori) | ¥9,723 | ¥9,115 | ¥8,579 | ¥8,464 | ¥7,935 | ¥7,468 |
Third, ADR. The table shows the headroom ratio when market ADR moves ±10%: markets around 1.0 at base fall out of viability at −10% and move clearly into it at +10%. Markets such as Sapporo and Kyoto with 1.4x or more headroom at base keep 1.2x or more even if ADR falls 10%, leaving only a small margin to defend through rent or term negotiations. Because the range of ADR swings varies with each city’s demand structure and inbound share, the practical approach to investment decisions is to use a 1.2x headroom ratio as a yardstick and, in markets below it, adopt conservative assumptions for both occupancy and ground rent.
| Market | Market ADR −10% | Base | Market ADR +10% | Break-even ADR, 30-yr lease |
|---|---|---|---|---|
| Sapporo (Sapporo Sta.–Odori) | 1.26 | 1.40 | 1.54 | ¥9,833 |
| Tokyo (Kanda–Tokyo Sta.) | 1.07 | 1.19 | 1.31 | ¥13,586 |
| Tokyo (Ginza–Nihonbashi) | 0.86 | 0.95 | 1.05 | ¥18,821 |
| Tokyo (Asakusa) | 1.30 | 1.45 | 1.59 | ¥10,124 |
| Kyoto (Shijo–Kyoto Sta.) | 1.40 | 1.55 | 1.71 | ¥9,513 |
| Osaka (Shinsaibashi–Namba) | 1.01 | 1.12 | 1.23 | ¥10,989 |
| Fukuoka (Hakata Sta.) | 1.06 | 1.18 | 1.29 | ¥11,988 |
| Naha (Kenchomae–Kokusai-dori) | 0.93 | 1.04 | 1.14 | ¥9,115 |
When all three variables move at once, borderline markets differ in “which variable to defend”. The table below shows, for the four markets with a headroom ratio of 1.00–1.02x, the 30-year lease headroom ratio on two axes: ground-rent yield (3–6%) and the full-year occupancy assumption (75/80/85%). In Shinjuku Sta. and Shimbashi–Hamamatsucho, cutting the rent by one point from 4% to 3% lifts the headroom ratio to 1.15–1.16x, a bigger improvement than assuming 85% full-year OCC (1.07–1.08x). In Saitama (Omiya Sta.) and Hiroshima (Kamiyacho–Hatchobori), by contrast, one point of rent is worth only 0.05–0.06x, less than the effect of raising full-year OCC by five points from 80% to 85% (0.07x). This confirms on two axes the conclusion of the preceding sections: in high-land-price central districts the rent negotiation decides viability, while in lower-priced regional core cities it is the reliability of occupancy.
| Market | Full-year OCC (assumed) | Rent 3% | Rent 4% | Rent 5% | Rent 6% |
|---|---|---|---|---|---|
| Saitama (Omiya Sta.) | 75% | 1.00 | 0.96 | 0.92 | 0.88 |
| Saitama (Omiya Sta.) | 80% | 1.07 | 1.02 | 0.98 | 0.94 |
| Saitama (Omiya Sta.) | 85% | 1.14 | 1.09 | 1.04 | 1.00 |
| Tokyo (Shinjuku Sta.) | 75% | 1.07 | 0.94 | 0.84 | 0.76 |
| Tokyo (Shinjuku Sta.) | 80% | 1.15 | 1.00 | 0.89 | 0.81 |
| Tokyo (Shinjuku Sta.) | 85% | 1.22 | 1.07 | 0.95 | 0.86 |
| Tokyo (Shimbashi–Hamamatsucho) | 75% | 1.09 | 0.95 | 0.84 | 0.75 |
| Tokyo (Shimbashi–Hamamatsucho) | 80% | 1.16 | 1.01 | 0.89 | 0.80 |
| Tokyo (Shimbashi–Hamamatsucho) | 85% | 1.24 | 1.08 | 0.95 | 0.85 |
| Hiroshima (Kamiyacho–Hatchobori) | 75% | 0.99 | 0.94 | 0.90 | 0.86 |
| Hiroshima (Kamiyacho–Hatchobori) | 80% | 1.06 | 1.00 | 0.96 | 0.92 |
| Hiroshima (Kamiyacho–Hatchobori) | 85% | 1.12 | 1.07 | 1.02 | 0.97 |
Summary — Markets Where Leasehold Works First, and Markets Where Purchase Works First
Markets with the most room for a 30-yr lease
Kyoto (Shijo–Kyoto Sta.) (headroom 1.55), Tokyo (Asakusa) (1.45), Sapporo (1.40), Yokohama Sta. (1.32, reference value). Land prices in the ¥1–2M range with ADR of ¥13,800 or more, so even at 4% rent, ground rent is only 17–31% of the annual fixed burden per room (Kyoto 17% to Yokohama 31%).
Price band where leasehold works before purchase
Land cost per room above ¥16M (Ginza–Nihonbashi, Shimbashi–Hamamatsucho, Shinjuku Sta., Kanda–Tokyo Sta.). Once the purchaser’s cost of capital for land exceeds 3.5–3.8%, a 30-year lease at 4% rent has the lower annual burden. It also removes the ¥16.63M–¥31.91M per room of upfront capital needed to acquire the land.
Markets where term negotiation beats rent negotiation
Naha, Kobe, Kyoto, Saitama, Sendai, Hiroshima and others with land per room around ¥5M. On a 20-year lease the ¥344K/room shorter-depreciation burden exceeds the ground rent, so extending to 30 years or more brings them into viability (Kyoto works even at 20 years; Sendai works at 50 years). These are also markets where purchase works first.
To sum up, whether the option to “lease” a site is viable depends not on the land price itself but on the ratio of land cost per room — diluted by FAR — to market ADR, and on the length of the lease. In central Tokyo, where both land prices and ADR are high, one point of ground-rent yield decides viability, and if the lease can run 30 years or more there is upside in leasehold becoming viable before purchase. In lower-priced regional core cities, the shorter depreciation and demolition reserve offset the light rent, so purchase comes out ahead on annual burden, and if leasehold is chosen, extending the term does more than a rent discount. All of these are range estimates with explicit assumptions — median official land price, 23㎡ GFA and a 40% GOP margin — and for individual sites the figures will move with the front road and effective FAR, rent-revision clauses, and whether there is a security deposit or prepaid rent. Actual investment decisions require a detailed feasibility study for each site.
Frequently Asked Questions
Methodology and Sources
- Land prices and FAR: From the Official Land Price Publication (as of January 1, 2026) in the MLIT Real Estate Information Library, commercial standard sites were collected from the tiles around each market’s center point, and the median price, interquartile range, median YoY change and median designated FAR were calculated for sites within a 1km radius of the center (Naha, under the same conditions, yields only 6 sites). 314 sites in total.
- Market ADR: 12-month average (September 2025–August 2026) of MetroEngines Research’s estimated settled ADR (by ward, business hotels, area median). The number of properties is shown in the table as a monthly range. Months in which the number of observed properties fell below 60% of other months (November 2025 for Chuo-ku, Kobe) were excluded.
- Construction and demolition costs: Construction cost uses the 2025 steel-frame cost per tsubo based on construction starts statistics (¥2.405M); demolition cost uses the top of the 2026 heavy-steel-frame range by structure (¥70K per tsubo).
- Property tax and city planning tax: Based on the Ministry of Internal Affairs and Communications’ explanation of burden-adjustment measures, the assessed value is set at 70% of the official land price, the taxable-base cap for commercial land at 70% of assessed value and the tax rate at 1.7%, equivalent to 0.8% of the official land price.
- Legal framework: Articles 22 and 23 of the Act on Land and Building Leases (e-Gov Law Search) and MLIT “Examples of Fixed-Term Land Leases”.
Related Articles
References and Sources
■ Data sources
From the Official Land Price Publication (as of January 1, 2026) in the MLIT Real Estate Information Library, 314 commercial standard sites within a 1km radius of the center point of 17 markets (price, YoY change, designated FAR) were aggregated. Market ADR is MetroEngines Research’s estimated settled ADR (by ward, business hotels, 12-month average September 2025–August 2026; N = number of properties shown in the tables).
■ Model assumptions
23㎡ GFA/room, building ¥16.73M/room (steel frame at ¥2.405M per tsubo), 40% GOP margin, 80% full-year OCC (sensitivity 75–85%), 4% ground-rent yield (sensitivity 3–6%), 2.0% building borrowing rate, land borrowing rate 1.5–2.5% plus 0.8% property tax and city planning tax equivalent for purchase, demolition at ¥70K per tsubo escalated 2% a year and booked in the expiry year. Break-even ADR = annual fixed burden ÷ (GOP margin × full-year OCC × 365).
■ Limitations
The median official land price is a standard-site price and differs from actual transaction prices, and designated FAR may not be fully usable because of front-road width or setback restrictions. Interquartile values can shift by tens of thousands of yen depending on the calculation method (inclusive or exclusive). Revenue is rooms-only with a fixed GOP margin, and this is a break-even estimate that excludes investors’ target returns, security deposits, prepaid rent and rent revisions; it does not represent a valuation of any individual site.
■ Market data
- MetroEngines Research & Consulting — Estimated settled ADR (by ward, business hotels, September 2025–August 2026), break-even ADR estimates
■ Government statistics, public data and legislation
- MLIT Real Estate Information Library — Official Land Prices (2026), designated FAR
- Act on Land and Building Leases (Act No. 90 of 1991), Articles 22 and 23 — e-Gov Law Search
- MLIT “Examples of Fixed-Term Land Leases” (Ushijima-machi district redevelopment, Toyama City — hotel)
- Okazaki City, application guidelines for the hotel and other private revenue facility attraction project (published April 27, 2026)
- Ministry of Internal Affairs and Communications, “Overview of Fixed Asset Tax” (burden-adjustment measures for commercial land)
- All Japan Real Estate Association, “Amendment of the law on business land leases” (extension of the maximum term)
■ Construction costs, demolition costs and REIT disclosures
- archi-book, “2025 cost per tsubo by structure based on construction starts statistics” (steel frame ¥2.405M/tsubo)
- Kaitai Sodan Navi, “2026 latest: demolition costs compared by structure and floor area”
- Invincible Investment Corporation, “Hotel operating results” (GOP margin of operated hotels 38.9% for the period ended December 2024)
Disclaimer: The break-even ADR, ground rent and demolition costs in this article are range estimates under the assumptions stated in “■ Model assumptions” and do not represent a valuation of any specific site or contract terms. Figures will vary with rent-revision clauses, security deposits and prepaid rent, effective FAR, and regional differences in construction costs.