

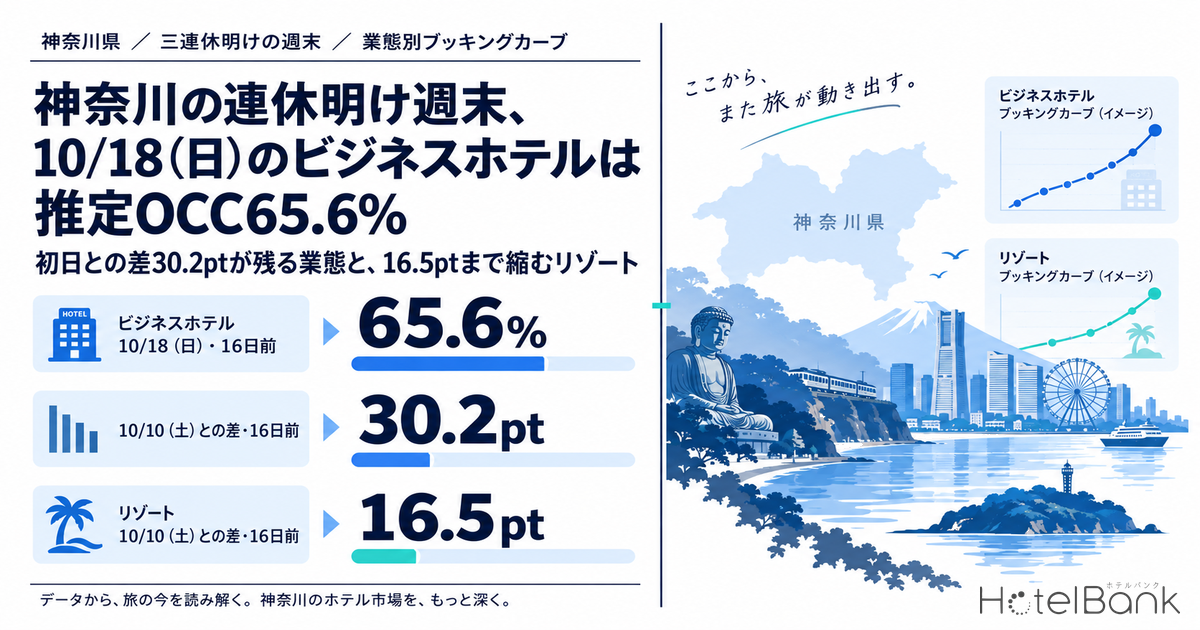
Comparing booking pace for hotels in Kanagawa as of October 3 across Oct 10 (Sat), the first day of the October three-day weekend, and the following weekend of Oct 17 (Sat) and Oct 18 (Sun), business hotels on Oct 18 stood at just 65.6% estimated OCC (OTA-listed inventory basis) 16 days before the stay date — a 30.2pt gap to Oct 10 at the same 16-day mark (95.8%). Resort hotels, by contrast, narrowed a gap that was 31.7pt at 45 days out to 16.5pt at 16 days out. Even within the same “post-holiday trough,” some segments keep the gap while others close it on their own. This article uses three checkpoints — 45, 30 and 16 days out — plus the latest observation on October 2 to read that difference, and sets out how to open inventory for the trough night, steer guests toward multi-night stays and extensions, and capture weekday-type demand.
Scope: Kanagawa business hotels N=119 properties (16,356 rooms), city hotels N=26 properties (5,112 rooms), resort hotels N=35 properties (4,568 rooms) and, for reference, ryokan N=160–161 properties (4,010–4,017 rooms), all based on listings on major booking sites. Occupancy is an estimate based on OTA-listed inventory; the definition is given at the end of the article. This article covers booking pace only and does not present price metrics. Data as of October 3, 2026 (latest observation date: October 2).
- — 30.2pt — Aligned at 16 days out (observed through October 2, 2026), the gap between Oct 10 (Sat) and Oct 18 (Sun) is 30.2pt for business hotels, barely narrower than the 31.9pt at 45 days out.
- — 31.7pt→16.5pt — For resort hotels, Oct 18 added +20.7pt over 29 days, cutting the gap almost in half. City hotels stand at 16.4pt and ryokan at 7.4pt: the depth of the trough differs fourfold by segment.
- — 65.6% — Business hotels on Oct 18 at 16 days out match the ordinary Sunday of Sep 27. September Sundays added +13.6 to +15.8pt by the day before the stay; applied here, the day-before guide is 79.2–81.4%.
- — Second deepest of six prefectures — The 30.2pt business-hotel gap trails only Shizuoka’s 34.9pt. Yet Kanagawa and Shizuoka are the only two where the gap narrowed from 45 days out; it widened in Tokyo, Chiba, Saitama and Yamanashi.
- — Deepest of five prefectures — The 16.5pt resort gap, even after narrowing, exceeds Tokyo, Chiba, Yamanashi and Shizuoka. Oct 12 (Mon, holiday) is a second trough, at 72.1% for business and 69.0% for resort hotels.
The Holiday Start vs. the Following Weekend at Three Checkpoints — The 30pt Business-Hotel Gap Stayed Put
Start with the overall picture. The table below sets out estimated OCC by segment at 45, 30 and 16 days before the stay date for Oct 10 (the first day of the long weekend), Oct 12 (its last night), and Oct 17 and Oct 18 (the following weekend). The third checkpoint is set at 16 days out because the latest observation (October 2) for the most distant date, Oct 18, falls exactly 16 days before the stay — the last point at which all four stay dates can be compared at the same number of days remaining. Observations have already advanced to 8 days out for Oct 10 and 15 days out for Oct 17, so the right-hand column also shows the latest value for each.
| Segment | Stay date | 45 days out | 30 days out | 16 days out | Latest observation (Oct 2) | Sold-out property share (latest) |
|---|---|---|---|---|---|---|
| Business | Oct 10 (Sat, holiday start) | 86.0% | 92.7% | 95.8% | 97.9% (8 days out) | 68.1% |
| Business | Oct 12 (Mon, holiday) | 59.7% | 65.8% | 69.3% | 72.1% (10 days out) | 2.5% |
| Business | Oct 17 (Sat) | 64.5% | 71.5% | 78.8% | 79.6% (15 days out) | 16.8% |
| Business | Oct 18 (Sun) | 54.1% | 59.5% | 65.6% | 65.6% (16 days out) | 0.8% |
| City | Oct 10 (Sat, holiday start) | 85.6% | 94.0% | 96.3% | 97.9% (8 days out) | 53.8% |
| City | Oct 12 (Mon, holiday) | 64.2% | 70.2% | 75.7% | 77.3% (10 days out) | 0.0% |
| City | Oct 17 (Sat) | 75.8% | 83.5% | 89.3% | 90.0% (15 days out) | 7.7% |
| City | Oct 18 (Sun) | 67.3% | 75.1% | 79.9% | 79.9% (16 days out) | 0.0% |
| Resort | Oct 10 (Sat, holiday start) | 81.1% | 88.5% | 86.6% | 87.0% (8 days out) | 40.0% |
| Resort | Oct 12 (Mon, holiday) | 49.0% | 58.1% | 67.8% | 69.0% (10 days out) | 2.9% |
| Resort | Oct 17 (Sat) | 60.9% | 77.9% | 83.9% | 84.2% (15 days out) | 20.0% |
| Resort | Oct 18 (Sun) | 49.4% | 61.2% | 70.1% | 70.1% (16 days out) | 14.3% |
| Ryokan (reference) | Oct 10 (Sat, holiday start) | 82.0% | 87.4% | 91.9% | 93.3% (8 days out) | 62.7% |
| Ryokan (reference) | Oct 12 (Mon, holiday) | 66.8% | 74.1% | 78.2% | 82.2% (10 days out) | 36.0% |
| Ryokan (reference) | Oct 17 (Sat) | 79.2% | 86.6% | 90.4% | 90.8% (15 days out) | 47.5% |
| Ryokan (reference) | Oct 18 (Sun) | 72.2% | 80.4% | 84.5% | 84.5% (16 days out) | 33.8% |
Source: MetroEngines Research; compiled by the HotelBank Editorial Team
Note: Estimated OCC (OTA-listed inventory basis). The 45-days-out observation dates are August 26 for Oct 10, August 28 for Oct 12, September 2 for Oct 17 and September 3 for Oct 18; the 16-days-out dates are, in the same order, September 24, September 26, October 1 and October 2. The sold-out property share is the (estimated) share of properties with no listed inventory confirmed on OTAs and similar channels. Values for Oct 12 onward may change up to the stay date.
The first thing the table shows is how large the business-hotel gap is — and how little it moves. Oct 10 was already at 86.0% at 45 days out, reached 95.8% at 16 days out and 97.9% at the latest observation, 8 days out. The sold-out property share rose from 47.9% at 45 days out to 68.1%, meaning two in three properties have no listed inventory confirmed on OTAs. Oct 18, by contrast, moved from 54.1% at 45 days out to 59.5% at 30 days and 65.6% at 16 days, with a sold-out property share of 0.8%. Note that the 31.9pt gap at 45 days out was still 30.2pt at 16 days out — almost unchanged.
That does not mean bookings for Oct 18 have stalled. Between 45 and 16 days out, Oct 10 gained +9.8pt and Oct 18 gained +11.5pt, so the trough day is actually building slightly faster. In other words, the post-holiday Sunday for business hotels is not a day that is “running late” but one that is “moving at the same speed from a starting point 30pt lower.” Saturday, Oct 17 stood at 78.8% at 16 days out, a 17.0pt gap to Oct 10. Of the two nights of the following weekend, only the Sunday needs to be treated as a trough.
Source: MetroEngines Research; compiled by the HotelBank Editorial Team
Figure 1: Booking curves for Kanagawa business hotels (estimated OCC, OTA-listed inventory basis). Sample: 119 properties / 16,356 rooms (listed on major booking sites). The horizontal axis is days remaining until the stay date; each line runs through the October 2 observation.
Resorts Fill Late — A 31.7pt Gap at 45 Days Out Narrows to 16.5pt at 16 Days Out
The resort-hotel lines behave quite differently. At 45 days out, Oct 10 was at 81.1% and Oct 18 at 49.4%, a 31.7pt gap almost identical to that of business hotels. From there, however, Oct 18 advanced to 61.2% at 30 days out and 70.1% at 16 days out, adding +20.7pt in 29 days. Oct 10 gained only +5.5pt over the same period, so the gap narrowed to 16.5pt. Saturday, Oct 17 rose +23.0pt, from 60.9% at 45 days out to 83.9% at 16 days out, leaving a gap of just 2.7pt to Oct 10 (86.6%).
The likely background is a difference in when bookings arrive. The first day of a long weekend is largely decided early, whereas demand for an ordinary weekend picks up in earnest between one month and two weeks before the stay. For resort hotels, Oct 10 peaked at 92.8% at 24 days out and then read 86.6% at 16 days and 87.0% at 8 days, showing inventory that had been absorbed being listed again. Taken together with the rise in the sold-out property share from 11.4% at 45 days out to 40.0% at 8 days out, this is a segment in which the way individual properties fill varies widely.
Source: MetroEngines Research; compiled by the HotelBank Editorial Team
Figure 2: Booking curves for Kanagawa resort hotels (estimated OCC, OTA-listed inventory basis). Sample: 35 properties / 4,568 rooms (listed on major booking sites). Each line runs through the October 2 observation.
City hotels sit between these two segments. At 16 days out, Oct 10 was at 96.3%, Oct 17 at 89.3% and Oct 18 at 79.9%, giving gaps to the first day of 7.0pt for Saturday and 16.4pt for Sunday. The narrowing from the gap at 45 days out (18.3pt for Sunday) is a modest 1.9pt, but because the floor of the trough itself is close to 80%, the width to be filled is about half that of business hotels. For reference, ryokan on Oct 18 were at 84.5% at 16 days out with a sold-out property share of 33.8%, a gap of only 7.4pt to the first day. The depth of the trough thus differs fourfold by segment.
Source: MetroEngines Research; compiled by the HotelBank Editorial Team
Figure 3: Gap in estimated OCC (pt) between Oct 10 (Sat) and Oct 18 (Sun), compared at 45 and 16 days out. Sample: business 119 properties / 16,356 rooms, city 26 properties / 5,112 rooms, resort 35 properties / 4,568 rooms, ryokan 160–161 properties / 4,010–4,017 rooms (listed on major booking sites).
One date that is easy to overlook is Oct 12 (Mon, holiday), the last night of the long weekend. Estimated OCC at 16 days out was 69.3% for business, 75.7% for city and 67.8% for resort hotels; for city and resort hotels that is lower than the following Sunday, Oct 18 (79.9% and 70.1%). Even at the latest observation (10 days out), business hotels were at only 72.1% and resort hotels at 69.0%, with sold-out property shares of 2.5% and 2.9%. Mid-October in Kanagawa can therefore be read as having two troughs one week apart: the last night of the long weekend and the following Sunday.
Overlaying Ordinary September Sundays — How Much Was Added in the Final 16 Days
So how far can a level of 65.6% at 16 days out still move? As a guide, we line up the value at the same 16-day mark and the value on the day before the stay for three September Sundays that did not fall on a long weekend (Sep 6, Sep 13 and Sep 27). The day-before values are actuals whose observation is already complete; the Oct 18 rows are filled only up to 16 days out.
| Segment | Stay date | 16 days out | Day before | Pickup in final 16 days |
|---|---|---|---|---|
| Business | Sep 6 (Sun) | 67.8% | 81.4% | +13.6pt |
| Business | Sep 13 (Sun) | 63.8% | 79.6% | +15.8pt |
| Business | Sep 27 (Sun) | 65.6% | 79.7% | +14.1pt |
| Business | Oct 18 (Sun) | 65.6% | — (not yet reached) | — |
| City | Sep 6 (Sun) | 74.1% | 80.7% | +6.6pt |
| City | Sep 13 (Sun) | 77.2% | 86.6% | +9.4pt |
| City | Sep 27 (Sun) | 80.2% | 86.2% | +6.0pt |
| City | Oct 18 (Sun) | 79.9% | — (not yet reached) | — |
| Resort | Sep 6 (Sun) | 59.6% | 68.2% | +8.6pt |
| Resort | Sep 13 (Sun) | 47.8% | 66.6% | +18.8pt |
| Resort | Sep 27 (Sun) | 60.1% | 75.0% | +14.9pt |
| Resort | Oct 18 (Sun) | 70.1% | — (not yet reached) | — |
Source: MetroEngines Research; compiled by the HotelBank Editorial Team
Note: Estimated OCC (OTA-listed inventory basis). The September samples are business 118–123 properties (15,921–16,592 rooms), city 28–29 properties (5,477–6,071 rooms) and resort 37–38 properties (4,596–4,633 rooms); the number of properties differs slightly by stay date. The day-before value for Oct 18 is left blank because the date has not yet been reached.
For business hotels, ordinary September Sundays sat in a band of 63.8–67.8% at 16 days out and then added +13.6 to +15.8pt by the day before, reaching 79.6–81.4%. The 65.6% for Oct 18 is the same value as Sep 27 at 16 days out, which shows that the date is not sitting below an ordinary Sunday just because it follows a long weekend. Put the other way round, Sunday-night bookings tend to arrive heavily in the final two weeks, so what is open for sale from here on is likely to show up directly in the result. Whether Oct 18 will trace this band is not settled at this point, but it serves as a yardstick for comparison.
City hotels were at 74.1–80.2% at 16 days out on September Sundays, and the 79.9% for Oct 18 is near the top of that range. Pickup in the final 16 days, at +6.0 to +9.4pt, is smaller than for business hotels, suggesting a segment whose shape is set early. Resort hotels were at 47.8–60.1% at 16 days out on September Sundays, whereas Oct 18 is at 70.1%, more than 10pt higher. With the autumn leisure season under way, even Sunday nights are starting to fill earlier than in September. The same comparison can be made for Saturday, Oct 17: the 79.6% for business hotels at 15 days out fell within the 70.1–87.4% range seen at the same point for three ordinary September Saturdays (Sep 5, Sep 12 and Sep 26).
How Far Will Oct 18 Reach by the Day Before? — Three Scenarios Applying September Pickup
Applying the pickup in Table 2 directly to Oct 18 gives the day-before guide shown in Table 3. The minimum, median and maximum of the three September Sundays are used as the low, mid and high cases.
| Segment | Oct 18 16 days out (Oct 2) | September Sunday pickup 16 days out → day before | Low (minimum) | Mid (median) | High (maximum) |
|---|---|---|---|---|---|
| Business hotels | 65.6% | +13.6 to +15.8pt | 79.2% | 79.7% | 81.4% |
| City hotels | 79.9% | +6.0 to +9.4pt | 85.9% | 86.5% | 89.3% |
| Resort hotels | 70.1% | +8.6 to +18.8pt | 78.7% | 85.0% | 88.9% |
Source: MetroEngines Research; compiled by the HotelBank Editorial Team
Note: Estimated OCC (OTA-listed inventory basis; Kanagawa; as observed on October 2, 2026). An illustrative calculation that adds the minimum, median and maximum of the 16-days-out → day-before pickup for Sep 6, Sep 13 and Sep 27 (Table 2) to the Oct 18 value at 16 days out; it is not a forecast.
Business hotels span only 2.2pt, from 79.2% in the low case to 81.4% in the high case, and the mid case of 79.7% is almost level with Oct 17 (Sat) at 15 days out (79.6%). If pickup matches September, the Sunday would land on the day before the stay at about the same level as “the following Saturday two weeks out.” City hotels fall in the highest band, at 85.9–89.3%, while resort hotels range from 78.7% to 88.9%, a 10.2pt spread. Resort pickup on September Sundays varied from 8.6pt to 18.8pt depending on the date, making this a segment in which the result changes considerably with what is open for sale in the final two weeks.
Note also that this pickup includes sales stops just before the stay. Because estimated OCC counts rooms removed from listings as absorbed, 32–40% of the 16-days-out → day-before pickup for business hotels on September Sundays was concentrated in the last two days (3 days out → day before). The values in Table 3 are best read as an upper-side guide to actual room occupancy.
Alongside Five Neighboring Prefectures — The Business Gap Did Not Widen Only in Kanagawa and Shizuoka; the Resort Trough Narrowed but Remains the Deepest of Five
To check whether the reading so far — the business gap stays, the resort gap narrows — is specific to Kanagawa, we aligned the same segments in Tokyo, Chiba, Saitama, Yamanashi and Shizuoka on the same stay dates and the same lead times (Table 4). The gap between Oct 10 and Oct 18 is compared at two points, 45 and 16 days out.
| Prefecture | Segment | Sample | Oct 18 16 days out (Oct 2) | Gap 45 days out | Gap 16 days out | Change in gap 45 → 16 days out |
|---|---|---|---|---|---|---|
| Kanagawa | Business hotels | N=119 properties / 16,356 rooms | 65.6% | 31.9pt | 30.2pt | −1.7pt |
| Tokyo | Business hotels | N=542 properties / 78,403 rooms | 78.6% | 4.6pt | 7.4pt | +2.8pt |
| Chiba | Business hotels | N=92 properties / 10,965 rooms | 69.7% | 12.0pt | 12.7pt | +0.7pt |
| Saitama | Business hotels | N=56 properties / 6,089 rooms | 62.1% | 18.2pt | 27.9pt | +9.7pt |
| Yamanashi | Business hotels | N=44 properties / 3,792 rooms | 68.6% | 21.4pt | 25.1pt | +3.7pt |
| Shizuoka | Business hotels | N=123 properties / 13,001 rooms | 60.7% | 35.2pt | 34.9pt | −0.3pt |
| Kanagawa | City hotels | N=26 properties* / 5,112 rooms | 79.9% | 18.3pt | 16.4pt | −1.9pt |
| Tokyo | City hotels | N=52 properties / 16,054 rooms | 85.1% | 6.4pt | 8.2pt | +1.8pt |
| Chiba | City hotels | N=26 properties* / 7,907 rooms | 52.4% | 7.0pt | 19.3pt | +12.3pt |
| Shizuoka | City hotels | N=20 properties* / 2,156 rooms | 72.4% | 20.2pt | 23.1pt | +2.9pt |
| Kanagawa | Resort hotels | N=35 properties / 4,568 rooms | 70.1% | 31.7pt | 16.5pt | −15.2pt |
| Tokyo | Resort hotels | N=12 properties* / 1,018 rooms | 83.2% | 11.0pt | 8.0pt | −3.0pt |
| Chiba | Resort hotels | N=39 properties / 4,319 rooms | 73.7% | 3.2pt | 6.8pt | +3.6pt |
| Yamanashi | Resort hotels | N=32 properties / 1,928 rooms | 83.8% | 3.5pt | 7.7pt | +4.2pt |
| Shizuoka | Resort hotels | N=111 properties / 6,378 rooms | 75.3% | 8.1pt | 10.8pt | +2.7pt |
Source: MetroEngines Research; compiled by the HotelBank Editorial Team
Note: Estimated OCC (OTA-listed inventory basis; as observed on October 2, 2026). The gap is the Oct 10 value minus the Oct 18 value; for each prefecture, values at the same stay date and the same lead time are compared (45 days out is the August 26 observation for Oct 10 and September 3 for Oct 18; 16 days out is September 24 and October 2). Segments with nine or fewer properties (city hotels in Saitama and Yamanashi, resort hotels in Saitama) are not shown. * denotes a reference value with N below 30 properties. Business hotels in Tokyo and Chiba are cohorts of 541–542 and 91–92 properties depending on the stay date.
For business hotels, the gap at 16 days out runs Shizuoka 34.9pt, Kanagawa 30.2pt, Saitama 27.9pt, Yamanashi 25.1pt, Chiba 12.7pt and Tokyo 7.4pt, making Kanagawa the second deepest of the six prefectures. What stands out is how the gap moved: between 45 and 16 days out it narrowed only in Kanagawa (−1.7pt) and Shizuoka (−0.3pt). In Tokyo, Chiba, Saitama and Yamanashi the gap instead widened, by as much as the first day of the long weekend filled ahead (+9.7pt in Saitama). Kanagawa’s gap that “does not narrow” is, relative to its neighbors, one that has held without widening — the flip side of Oct 18 building at the same speed as the first day of the long weekend. Even so, the level of Oct 18 at 16 days out is 65.6% in Kanagawa against 78.6% in Tokyo, 69.7% in Chiba and 68.6% in Yamanashi, so it remains lower than its surroundings.
The resort-hotel comparison makes Kanagawa’s distinctiveness clearer still. At 45 days out, the gap was 3.2pt in Chiba, 3.5pt in Yamanashi, 8.1pt in Shizuoka and 11.0pt in Tokyo (a reference value, N=12 properties), whereas Kanagawa stood out at 31.7pt. Even after narrowing to 16.5pt at 16 days out, its gap is the largest of the five prefectures. In the other four prefectures, resort hotels on Oct 18 have been tracking close to the first day of the long weekend from the start, so the Kanagawa resort Sunday is a “narrowed trough” that still has to be treated as “the deepest trough.” For city hotels, too, the gap narrowed only in Kanagawa (18.3pt → 16.4pt); it widened from 7.0pt to 19.3pt in Chiba and from 20.2pt to 23.1pt in Shizuoka.
For Revenue Managers Running Business, City and Resort Hotels in Kanagawa — Implications and Action Plan
The data so far can now be read against your own property’s operations. Because this article deals only with booking pace, what follows is likewise limited to how inventory is presented and how demand is channeled, not to price levels.
1. Treat the trough as a “level difference,” not a “delay.” Business hotels on Oct 18 added +11.5pt between 45 and 16 days out, faster than the first day of the long weekend (+9.8pt). A 30.2pt gap nevertheless remains because the starting point is low. When checking your own booking pace against the market, it is closer to reality to use ordinary September Sundays (63.8–67.8% at 16 days out) as the comparison, not the first day of the long weekend.
2. For Sunday nights, the final two weeks are the main event. On ordinary September Sundays, +13.6 to +15.8pt for business hotels and +8.6 to +18.8pt for resort hotels was added in the final 16 days. If any room types or channels have been closed, whether they are open during this period changes how much demand you can take. The timing of checks should be shifted relative to the first day of a long weekend, whose shape is set early.
3. For resorts, separate “the gap that narrows if you wait” from “the gap that stays.” On Saturday, Oct 17, the gap to the first day had narrowed to 2.7pt at 16 days out, so this is not a moment to rush additional measures. What remains is the 16.5pt on Sunday, Oct 18 and the level of Oct 12, the last night of the long weekend (69.0% at the latest observation). Focusing multi-night and extension offers on these two nights is the efficient approach.
4. Redirect touchpoints on full days toward trough days. On Oct 10, the sold-out property share has reached 68.1% for business hotels and 53.8% for city hotels. During the long weekend there is little room for new sales, but it is also when contact with guests is greatest. There is scope to use it to promote a return visit the following weekend or an extension into Sunday night.
The following table places the above on a timeline. Every decision trigger is tied to a figure shown in this article and is meant to be used alongside your own property’s pickup for the same stay dates. All of them are starting points for consideration and do not promise a result.
| Timing | Measure | Decision trigger (figures in this article) | Aim |
|---|---|---|---|
| Today to this week (around 14 days before Oct 18) | Take stock of the room types and channels on sale for Oct 18 (Sun) and open any that have been closed | If your own pickup for Oct 18 is below the market at 16 days out: 65.6% (business), 79.9% (city), 70.1% (resort) | Enter the final two weeks, when pickup is largest, with inventory open for sale |
| Today to this week | Review minimum-stay and sales conditions for Oct 17 (Sat) and create room for Saturday–Sunday stays | Given that the market for Oct 17 was at 78.8% (business) and 89.3% (city) at 16 days out, 13.2pt and 9.4pt above Oct 18 | Provide a path that extends Saturday demand by one night into Sunday |
| During the long weekend (Oct 10–12) | Promote return visits and extensions for the following weekend or Sunday night to long-weekend guests, on property and in booking-confirmation messages | Because, with the sold-out property share for Oct 10 at 68.1% (business) and 53.8% (city), these are the three days with the most touchpoints for referring guests | Turn touchpoints on full days into demand for trough days |
| During the long weekend (Oct 10–12) | Show remaining rooms for Oct 12 (Mon, holiday) both to guests extending from Sunday and to business travelers who set out on Monday and stay the night before their work | If the latest observation for Oct 12 stays at 72.1% (business) and 69.0% (resort), with sold-out property shares of only 2.5% and 2.9% | Fill the other trough — the last night of the long weekend — from both leisure and business demand |
| Final week (Oct 11–17) | Prepare sales channels for business travelers staying Sunday night for Monday-morning work, training groups and nearby corporate demand | Using as a guide that business hotels on Oct 18 are in the same band as ordinary September Sundays at 16 days out (63.8–67.8%), from which +13.6 to +15.8pt was added by the day before | Do not miss weekday-type guests who book close to arrival |
| Final 3 days | Offer extensions individually to guests booked for Saturday, and relax sales conditions to take demand close to the day | If the sold-out property share for Oct 18 remains at 0.8% (business) and 0.0% (city) | Use up the last remaining rooms through extended stays by existing guests |
Source: MetroEngines Research; compiled by the HotelBank Editorial Team
Summary — Three Yardsticks for Measuring the Post-Holiday Trough
To sum up, the post-holiday weekend in Kanagawa can be read with three yardsticks. First, compare at the same number of days remaining. Aligned at 16 days out, the gap between Oct 10 and Oct 18 was 30.2pt for business hotels, 16.5pt for resort hotels, 16.4pt for city hotels and 7.4pt for ryokan, clearly separating the depth of the trough by segment. Second, look at how the gap narrows. Resort hotels narrowed from 31.7pt at 45 days out to almost half, whereas business hotels have barely moved from 31.9pt. In the former, time resolves a large part; in the latter, the structure is one in which what is put on sale in the final stretch makes the difference.
Third, overlay the trajectory of ordinary days. Business hotels on Oct 18 are in the same band as ordinary September Sundays, and those Sundays added +13.6 to +15.8pt by the day before. The trough day is not specially depressed by a post-holiday rebound; rather, the nature of Sunday as a day of the week appears to be showing through as it is. These three yardsticks should apply equally to long weekends from November onward and the weekends that follow them.
Frequently Asked Questions
Q. Which hotel segments are behind on bookings for the weekend after the October three-day weekend in Kanagawa?
A. As observed on October 2, 2026, estimated OCC (OTA-listed inventory basis) for Oct 18 (Sun) at 16 days out is 65.6% for business hotels, 70.1% for resort hotels, 79.9% for city hotels and 84.5% for ryokan. The gap to Oct 10, the first day of the long weekend, is largest for business hotels at 30.2pt and only 7.4pt for ryokan.
Q. Is 65.6% for business hotels on Oct 18 low compared with an ordinary Sunday?
A. No. Sep 27 (Sun), which did not fall on a long weekend, was also at 65.6% at 16 days out, and three ordinary September Sundays were in a band of 63.8–67.8%. It can be read as the normal level for a Sunday showing through.
Q. How far is Oct 18 likely to fill from here?
A. Applying the 16-days-out → day-before pickup of ordinary September Sundays, the day-before guide is 79.2–81.4% for business hotels, 85.9–89.3% for city hotels and 78.7–88.9% for resort hotels. Because last-minute sales stops are also counted as absorbed inventory, treat these as an upper-side guide.
Q. Is the trough in Kanagawa deep compared with neighboring prefectures?
A. The 30.2pt business-hotel gap is the second deepest, after Shizuoka (34.9pt), among six prefectures including Tokyo, Chiba, Saitama, Yamanashi and Shizuoka. The 16.5pt resort-hotel gap is the largest of the five prefectures that could be compared.
Q. Is estimated OCC the same as actual room occupancy?
A. No. It is estimated from how inventory listed on OTAs is being absorbed, and because unlisted rooms and rooms taken off sale are counted as absorbed, it comes out higher than actual room occupancy. The sample is a fixed cohort of properties that list at least 30% of their total rooms on OTAs.
About the Data
| Definition of estimated OCC | OTA-listed inventory-based occupancy = 100 − 100 × rooms still listed on OTAs ÷ total rooms. The sample is a fixed cohort of properties that list at least 30% of their total rooms on OTAs (for each stay date, the same set of properties throughout the observation period; for ryokan only, 160–161 properties depending on the stay date). It is an estimate based on how inventory sold on OTAs is being absorbed, and its definition differs from actual room occupancy (it comes out higher because unlisted rooms are counted as absorbed). |
| Booking curve | Based on observations from 45 days before the stay date to the most recent date. The checkpoints in this article are 45, 30 and 16 days out, and the latest observation date is October 2, 2026 (8 days before Oct 10, 10 days before Oct 12, 15 days before Oct 17 and 16 days before Oct 18). September reference dates run through the day before the stay. |
| Sold-out property share | The (estimated) share of properties with no listed inventory confirmed on OTAs and similar channels. |
| Price metrics | This article covers booking pace only and does not present price metrics such as estimated settled ADR. |
| Breakdown of sample N | Kanagawa. October stay dates: business hotels 119 properties / 16,356 rooms, city hotels 26 properties / 5,112 rooms, resort hotels 35 properties / 4,568 rooms, ryokan 160–161 properties / 4,010–4,017 rooms. September reference dates: business 117–123 properties, city 28–29 properties, resort 37–38 properties. |
| Data as of | Data as of October 3, 2026. Sales status and inventory change daily, so the figures in this article are a snapshot at the time of retrieval. |
Source: MetroEngines Research; compiled by the HotelBank Editorial Team
■ Data sources
Daily observation of room inventory listed on major booking sites (MetroEngines Research). Estimated OCC and the sold-out property share are based on fixed cohorts by segment for Kanagawa, Tokyo, Chiba, Saitama, Yamanashi and Shizuoka. Observation dates run from August 21 to October 2, 2026 (including the September reference dates).
■ Calculation assumptions
The gaps in Tables 1 and 4 are differences between displayed values at the same lead time. The day-before guide in Table 3 is a sensitivity that adds the minimum, median and maximum of the 16-days-out → day-before pickup for Sep 6, Sep 13 and Sep 27 (business +13.6 to +15.8pt, city +6.0 to +9.4pt, resort +8.6 to +18.8pt) to the Oct 18 value at 16 days out, capped at 100%.
■ Limitations and caveats
Estimated OCC is based on OTA-listed inventory; its definition differs from actual room occupancy, and unlisted rooms and sales stops are counted as absorbed. For business hotels on September Sundays, 32–40% of the pickup was concentrated in the last two days, so Table 3 is an upper-side guide. In segments with fewer than 30 properties (city hotels in Kanagawa, Chiba and Shizuoka; resort hotels in Tokyo), the movement of a single property can easily affect the whole. Values for Oct 12 onward will change up to the stay date.