

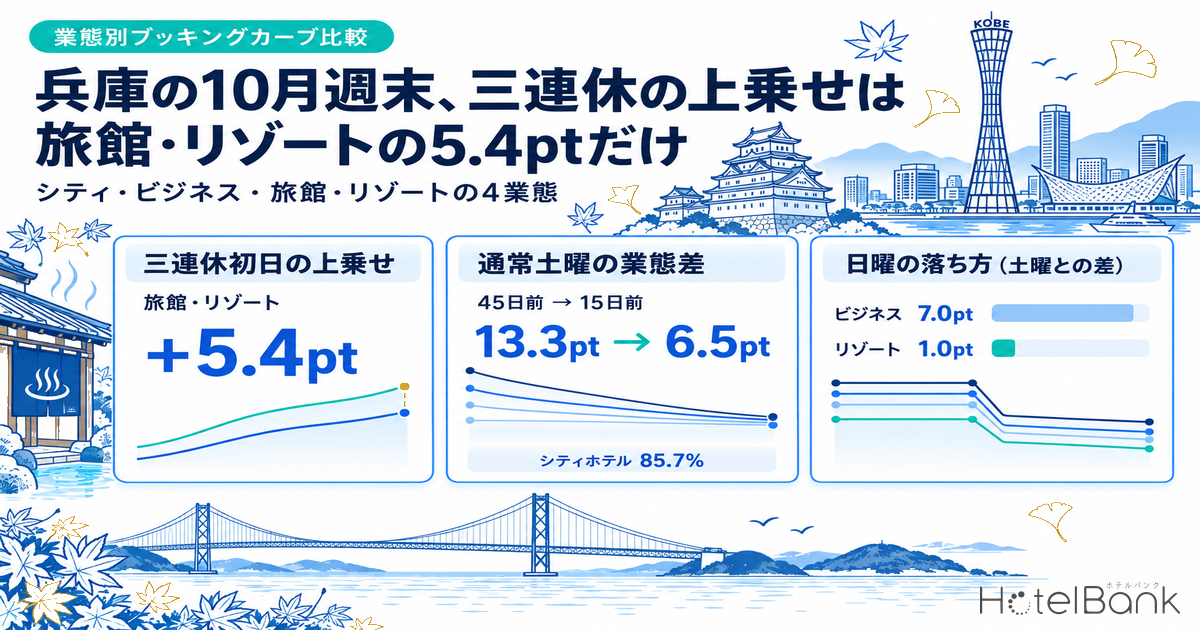
HotelBank Editorial Team aggregated sales data as of October 2, 2026. For Saturday, October 17, the estimated OCC (based on OTA-listed inventory) in Hyogo stood, 15 days before arrival, at 85.7% for city hotels, 83.7% for ryokan, 81.6% for business hotels and 79.2% for resort hotels. The 13.3pt spread between categories at 45 days out has narrowed to 6.5pt: business and resort hotels, which moved later, stacked up 16-plus points over 30 days. Meanwhile, lining up the first day of the three-day weekend, Saturday, October 10, at the same 15 days out, ryokan and resorts are both 5.4pt higher, whereas city hotels differ by only 0.3pt and business hotels are actually 2.6pt higher on October 17. This article reads October 10, 17 and 18 at three checkpoints—45 days out, 30 days out and the latest observation—and sets out how the holiday effect and the Sunday drop differ by category.
Coverage: Hyogo city hotels N=24 properties / business hotels N=74 / ryokan N=179 / resort hotels N=41 (based on listings on major booking sites). The price metric in this article is estimated settled ADR (the settled price level estimated from OTA and other sales data, tax-excluded equivalent); occupancy is an estimate based on OTA-listed inventory. Definitions for both are at the end of the article. Data as of: October 3, 2026 (latest observation October 2).
- — 13.3pt→6.5pt — The spread between categories for Saturday, October 17 halved between 45 days out and 15 days out (observed October 2, 2026). Business (+16.4pt) and resort hotels (+16.5pt) caught up in the second half.
- — +5.4pt — At the same 15 days out, only ryokan and resorts saw the first day of the three-day weekend (10/10) beat a regular Saturday (10/17). City hotels were +0.3pt; business hotels were −2.6pt, i.e. higher on 10/17.
- — 7.0pt vs. 1.0pt — The Saturday-minus-Sunday gap at 16 days out is 7.0pt for business hotels, 5.8pt for city hotels, 4.2pt for ryokan and 1.0pt for resorts. For resorts, Sunday absorbs Saturday overflow.
- — Shared by Osaka and Hyogo — Across five neighbouring prefectures, only Osaka and Hyogo show no holiday lift for urban categories. Hyogo has the shallowest Sunday drop of the five.
- — −8.7% to +2.8% — For settled August 2026, estimated settled ADR fell year on year for city hotels, ryokan and resorts; only business hotels rose (+2.8% YoY).
Saturday, October 17 — A 13.3pt gap at 45 days out shrank to 6.5pt at 15 days out
We start with October 17, a regular Saturday with no holiday attached. At 45 days out (observed September 2), city hotels (76.0%) and ryokan (75.0%) led on estimated OCC, more than 10pt ahead of business hotels (65.2%) and resorts (62.7%). By the latest observation at 15 days out (October 2), however, the gap between top-ranked city hotels and bottom-ranked resorts had closed to 6.5pt. The difference between categories that fill early and those that fill late showed up not as a difference in level but as a difference in when they pick up.
| Category | Coverage | 45 days out (9/2) | 30 days out (9/17) | 15 days out (10/2, latest) | Pickup 45→15 days out | Sold-out property rate 45→15 days out |
|---|---|---|---|---|---|---|
| City hotels | N=24 properties / 3,727 rooms | 76.0% | 79.7% | 85.7% | +9.7pt | 4.2%→8.3% |
| Business hotels | N=74 properties / 9,038 rooms | 65.2% | 73.8% | 81.6% | +16.4pt | 5.4%→14.9% |
| Ryokan | N=179 properties / 3,746 rooms | 75.0% | 79.2% | 83.7% | +8.7pt | 26.0%→37.4% |
| Resort hotels | N=41 properties / 1,778 rooms | 62.7% | 74.5% | 79.2% | +16.5pt | 12.2%→19.5% |
Source: Compiled by HotelBank Editorial Team from MetroEngines Research data. The sold-out property rate is the estimated share of properties with no listed inventory visible on OTAs and similar channels.
Splitting the pickup into first and second halves makes the timing difference even clearer. Resorts added +11.8pt in the 15 days from 45 to 30 days out, then only +4.7pt over the next 15 days. Business hotels kept adding at an almost even pace—+8.6pt in the first half and +7.8pt in the second—with no loss of momentum up to the latest reading. City hotels (+3.7pt, then +6.0pt) and ryokan (+4.2pt, then +4.5pt), by contrast, climbed in small steps from an already high starting point.
Figure 1: Booking curves for stays on Saturday, October 17 (45 to 15 days before arrival). Source: Compiled by HotelBank Editorial Team from MetroEngines Research data.
Another point worth noting is that estimated OCC and the sold-out property rate do not rank the categories the same way. Ryokan estimated OCC at 15 days out is 83.7%, below city hotels, yet their sold-out property rate is 37.4%, the highest of the four categories. This reads as small properties selling out one by one while the remaining inventory is concentrated in a subset of properties. The city-hotel sold-out property rate is only 8.3% (with N=24 properties, one property equals about 4.2pt); here, many properties are lifting the overall level while each keeps a little inventory. Even at the same “80-something percent,” the shape of what remains differs by category.
Saturday, October 10 (first day of the three-day weekend) — Ryokan at 79.9% 45 days out; all four categories converge on 85.7–91.7% at 8 days out
Next is October 10, the first day of the three-day weekend that includes Sports Day (Monday, October 12). Here data runs to 8 days before arrival (observed October 2), so the “latest” checkpoint is one week deeper than for October 17. At 45 days out (observed August 26), ryokan had already reached 79.9%, with a sold-out property rate of 32.0%. Resorts followed at 70.5%, city hotels at 68.5% and business hotels at 63.4%, a 16.5pt gap between top and bottom.
| Category | Coverage | 45 days out (8/26) | 30 days out (9/10) | 8 days out (10/2, latest) | Pickup 45→8 days out | Sold-out property rate 45→30→8 days out |
|---|---|---|---|---|---|---|
| City hotels | N=24 properties / 3,727 rooms | 68.5% | 73.2% | 90.0% | +21.5pt | 12.5%→4.2%→29.2% |
| Business hotels | N=74 properties / 9,038 rooms | 63.4% | 70.5% | 85.7% | +22.3pt | 5.4%→13.5%→23.0% |
| Ryokan | N=179 properties / 3,744 rooms | 79.9% | 84.5% | 91.7% | +11.8pt | 32.0%→45.5%→55.3% |
| Resort hotels | N=41 properties / 1,778 rooms | 70.5% | 79.1% | 89.2% | +18.7pt | 34.1%→36.6%→43.9% |
Source: Compiled by HotelBank Editorial Team from MetroEngines Research data. The sold-out property rate is the estimated share of properties with no listed inventory visible on OTAs and similar channels.
At the latest 8-days-out reading, ryokan (91.7%), city hotels (90.0%), resorts (89.2%) and business hotels (85.7%) sit within a 6.0pt band. Pickup since 45 days out is large for business (+22.3pt) and city hotels (+21.5pt), while early-leading ryokan added only +11.8pt. Ryokan are a category where “the outcome is settled early”: once the sold-out property rate reached 45.5% at 30 days out, further gains came from a thin remaining inventory.
Figure 2: Booking curves for stays on Saturday, October 10 (first day of the three-day weekend; 45 to 8 days before arrival). Source: Compiled by HotelBank Editorial Team from MetroEngines Research data.
The city-hotel curve has a single step. It rose from 73.2% at 30 days out (September 10) to 78.7% at 29 days out the next day, +5.5pt in one day. On the same day business hotels moved only +0.1pt and ryokan +0.5pt, so city hotels alone saw a block of sell-through. In a population of N=24 properties, a single large property can move the whole figure, so if your property is in this category, check whether your own bookings moved the same way around this date. After that, the curve climbed smoothly to 90.0% at 8 days out, and the sold-out property rate rose from 4.2% at 30 days out to 29.2%.
At the same lead time — The holiday lift is 5.4pt for ryokan and resorts and absent for city and business hotels
The two dates so far have different depths of latest observation, so comparing them as they stand makes the holiday date look stronger. Table 3 therefore re-takes the gap between the first day of the three-day weekend (October 10) and a regular Saturday (October 17) at the three points where both dates have observations: 45, 30 and 15 days out.
| Category | 45 days out | 30 days out | 15 days out | ||||||
|---|---|---|---|---|---|---|---|---|---|
| 10/10 | 10/17 | Gap | 10/10 | 10/17 | Gap | 10/10 | 10/17 | Gap | |
| City hotels (N=24) | 68.5% | 76.0% | −7.5pt | 73.2% | 79.7% | −6.5pt | 86.0% | 85.7% | +0.3pt |
| Business hotels (N=74) | 63.4% | 65.2% | −1.8pt | 70.5% | 73.8% | −3.3pt | 79.0% | 81.6% | −2.6pt |
| Ryokan (N=179) | 79.9% | 75.0% | +4.9pt | 84.5% | 79.2% | +5.3pt | 89.1% | 83.7% | +5.4pt |
| Resort hotels (N=41) | 70.5% | 62.7% | +7.8pt | 79.1% | 74.5% | +4.6pt | 84.6% | 79.2% | +5.4pt |
Source: Compiled by HotelBank Editorial Team from MetroEngines Research data. Gap = October 10 − October 17. October 10 at 15 days out was observed on September 25.
The results split cleanly by category. Ryokan were higher on the first day of the three-day weekend by about 5pt at every checkpoint: +4.9pt at 45 days out, +5.3pt at 30 days out and +5.4pt at 15 days out. Resorts, at +7.8pt, +4.6pt and +5.4pt, also show a consistent holiday lift. City hotels, however, were higher on the regular Saturday of October 17 by 7.5pt at 45 days out and 6.5pt at 30 days out, and only drew level (+0.3pt) at 15 days out. Business hotels were higher on October 17 at all three checkpoints, with a 2.6pt gap still remaining at 15 days out.
In other words, in Hyogo the calendar effect of a three-day weekend shows up as a boost to lodging demand for ryokan and resorts, while for city and business hotels the assumption that “a holiday weekend is strong” did not hold for these two dates. For the two urban categories, October 17 may be a regular Saturday on the calendar, but its booking pace matches or exceeds that of the first day of the three-day weekend. The same pattern has been observed in neighbouring Osaka, where a comparison at 23 days out found October 17 ahead of October 10 for both city and business hotels. Our August article on Hyogo booking curves by category looked at how pickup differs by category; in October, the ranking of “which day is strong” itself flips by category.
Sunday, October 18 — The gap to Saturday ranges sevenfold, from 7.0pt for business hotels to 1.0pt for resorts
What about Sunday, October 18, when the following day is a weekday? At the latest observation, 16 days out (October 2), city hotels were at 79.7%, ryokan 79.4%, resorts 78.0% and business hotels 74.0%. Compared with the preceding Saturday at the same 16 days out, business hotels were 7.0pt lower, city hotels 5.8pt and ryokan 4.2pt, while resorts alone were nearly level at a 1.0pt gap.
| Category | Coverage | 45 days out (9/3) | 30 days out (9/18) | 16 days out (10/2, latest) | Gap vs. Saturday 45 days out | Gap vs. Saturday 30 days out | Gap vs. Saturday 16 days out | Sold-out property rate 16 days out |
|---|---|---|---|---|---|---|---|---|
| City hotels | N=24 properties / 3,727 rooms | 72.3% | 74.3% | 79.7% | +3.7pt | +5.4pt | +5.8pt | 8.3% |
| Business hotels | N=74 properties / 9,038 rooms | 60.0% | 67.3% | 74.0% | +5.2pt | +6.5pt | +7.0pt | 2.7% |
| Ryokan | N=179 properties / 3,720 rooms | 70.0% | 74.7% | 79.4% | +5.0pt | +4.5pt | +4.2pt | 27.4% |
| Resort hotels | N=41 properties / 1,778 rooms | 65.7% | 71.2% | 78.0% | −3.0pt | +3.3pt | +1.0pt | 17.1% |
Source: Compiled by HotelBank Editorial Team from MetroEngines Research data. Gap vs. Saturday compares October 17 − October 18 at the same lead time. The sold-out property rate is the estimated share of properties with no listed inventory visible on OTAs and similar channels.
The resort pattern is particularly interesting. At 45 days out, Sunday estimated OCC was 65.7%, 3.0pt above Saturday’s 62.7%. Saturday then picked up first, opening a +3.3pt gap at 30 days out, but by 16 days out the gap had narrowed again to +1.0pt. Bookings may be spilling over to Sunday as Saturday inventory thins; for resorts, Sunday appears to function as “overflow capacity for Saturday.”
Figure 3: Estimated OCC gap between Saturday (10/17) and Sunday (10/18) (Saturday − Sunday, pt). Source: Compiled by HotelBank Editorial Team from MetroEngines Research data.
Business hotels, by contrast, show a gap to Saturday that keeps widening: +5.2pt at 45 days out, +6.5pt at 30 days out and +7.0pt at 16 days out. Their Sunday sold-out property rate is also low at 2.7% at 16 days out, meaning almost every property still has inventory. Sunday itself has added +14.0pt since 45 days out, though, so it has not stalled; it is closer to the truth to say the gap is widening because Saturday is growing even faster. For ryokan the gap to Saturday was roughly flat at +5.0pt → +4.5pt → +4.2pt, and the Sunday sold-out property rate was 27.4%.
Against neighbouring prefectures — The vanishing urban holiday lift is shared by Osaka and Hyogo; Hyogo has the shallowest Sunday drop
To check whether the two features seen in Hyogo—“a holiday lift only for ryokan and resorts” and “a sevenfold range in the Sunday drop by category”—are specific to Hyogo or common across the Kansai and Chugoku regions, we lined up the same categories in Osaka, Kyoto, Okayama and Tottori on the same stay dates at the same lead times (Table 5). The holiday lift is measured at 15 days out, where both dates have observations, and the Sunday drop at 16 days out, the latest observation for October 18, against the preceding October 17.
| Prefecture | Category | Coverage | 10/10 15 days out (9/25) | 10/17 15 days out (10/2) | Holiday lift 10/10−10/17 | Sunday drop 10/17−10/18 (16 days out) |
|---|---|---|---|---|---|---|
| Hyogo | City hotels | N=24 properties* / 3,727 rooms | 86.0% | 85.7% | +0.3pt | +5.8pt |
| Hyogo | Business hotels | N=74 properties / 9,038 rooms | 79.0% | 81.6% | −2.6pt | +7.0pt |
| Hyogo | Ryokan | N=179 properties / 3,746 rooms | 89.1% | 83.7% | +5.4pt | +4.2pt |
| Hyogo | Resort hotels | N=41 properties / 1,778 rooms | 84.6% | 79.2% | +5.4pt | +1.0pt |
| Osaka | City hotels | N=42 properties / 9,790 rooms | 90.4% | 92.9% | −2.5pt | +12.0pt |
| Osaka | Business hotels | N=289 properties / 47,472 rooms | 77.3% | 79.5% | −2.2pt | +12.4pt |
| Osaka | Ryokan | N=25 properties* / 665 rooms | 74.3% | 73.1% | +1.2pt | −0.3pt |
| Kyoto | City hotels | N=37 properties / 5,084 rooms | 96.7% | 95.5% | +1.2pt | +8.3pt |
| Kyoto | Business hotels | N=188 properties / 18,377 rooms | 98.1% | 93.7% | +4.4pt | +8.9pt |
| Kyoto | Ryokan | N=122 properties / 2,179 rooms | 88.7% | 78.8% | +9.9pt | +2.6pt |
| Okayama | Business hotels | N=48 properties / 6,251 rooms | 86.3% | 80.6% | +5.7pt | +14.5pt |
| Okayama | Ryokan | N=32 properties / 641 rooms | 92.0% | 78.3% | +13.7pt | +10.6pt |
| Okayama | Resort hotels | N=14 properties* / 839 rooms | 93.3% | 83.9% | +9.4pt | +6.7pt |
| Tottori | Business hotels | N=25 properties* / 2,608 rooms | 100.0% | 99.8% | +0.2pt | +25.5pt |
| Tottori | Ryokan | N=51 properties / 1,448 rooms | 97.2% | 94.8% | +2.4pt | +8.9pt |
Source: Compiled by HotelBank Editorial Team from MetroEngines Research data. Estimated OCC is based on OTA-listed inventory. Each prefecture is compared on the same stay dates at the same lead times. Categories with 9 or fewer properties, which fall outside aggregation (resorts in Osaka and Kyoto, city hotels in Okayama and Tottori, resorts in Tottori), are not shown. * marks N below 30 properties: reference values in which one property can move the whole figure. The cohort is 290 properties for Osaka business hotels on 10/18 and 121 properties for Kyoto ryokan on 10/10 and 10/18.
First, the holiday lift. In Osaka, city hotels (−2.5pt) and business hotels (−2.2pt) showed the regular Saturday of October 17 matching or beating the first day of the three-day weekend, just as in Hyogo (city +0.3pt, business −2.6pt). In Kyoto (business +4.4pt) and Okayama (business +5.7pt), by contrast, the first day of the holiday weekend is higher even for urban categories. Among the five prefectures examined, the absence of an urban holiday lift is limited to Osaka and Hyogo, so it cannot be generalised as “holidays don’t work for urban hotels.” Hyogo’s ryokan lift of +5.4pt is modest compared with Kyoto (+9.9pt) and Okayama (+13.7pt; a reference value at N=32 properties), with ryokan on October 17 already sitting high and narrowing the gap. In Tottori, business hotels are in the 99% range on both dates, leaving almost no room to measure a lift.
Next, the Sunday drop. Hyogo’s Saturday-minus-Sunday gap of 7.0pt for business hotels and 5.8pt for city hotels is shallower than in any of Osaka (business 12.4pt, city 12.0pt), Kyoto (8.9pt and 8.3pt), Okayama (business 14.5pt) or Tottori (business 25.5pt). Hyogo ryokan, at 4.2pt, are second-shallowest after Kyoto (2.6pt) and below Okayama (10.6pt) and Tottori (8.9pt). Hyogo is a market with a smaller Sunday drop than its neighbours, and even the 7.0pt for business hotels is “still on the shallow side” by regional standards. The cause cannot be identified from this data, but conditions in Hyogo make it easier than in neighbouring prefectures to sell Sunday as an extension of Saturday.
Benchmarks for October 17 at 8 days out — Sensitivity applying October 10 pickup at different multipliers
There are still two weeks until the October 17 stay date. As a yardstick for checking your own pace, we took the 15→8-days-out pickup of October 10, which runs one week ahead (city +4.0pt, business +6.7pt, ryokan +2.6pt, resorts +4.6pt), and applied it at different multipliers to the October 17 level at 15 days out (Table 6).
| Category | 10/17 15 days out (10/2) | 10/10 pickup 15→8 days out | Low (×0.5) | Mid (×1.0) | High (×1.5) |
|---|---|---|---|---|---|
| City hotels | 85.7% | +4.0pt | 87.7% | 89.7% | 91.7% |
| Business hotels | 81.6% | +6.7pt | 85.0% | 88.3% | 91.7% |
| Ryokan | 83.7% | +2.6pt | 85.0% | 86.3% | 87.6% |
| Resort hotels | 79.2% | +4.6pt | 81.5% | 83.8% | 86.1% |
Source: Compiled by HotelBank Editorial Team from MetroEngines Research data. A calculation adding the estimated OCC pickup for October 10 stays (first day of the three-day weekend) from 15 days out (observed 9/25) to 8 days out (observed 10/2), multiplied by each factor, to the October 17 value at 15 days out. Not a forecast.
At mid (×1.0), the benchmarks for October 17 at 8 days out are city 89.7%, business 88.3%, ryokan 86.3% and resorts 83.8%; business hotels reach 85.0% even at low. Note, however, that October 10 is the first day of a three-day weekend, and ryokan were nearing the ceiling at 91.7% by 8 days out, so their pickup (+2.6pt) was held down by thin remaining inventory. Ryokan on October 17 have more inventory left and so have room to land above mid. Table 6 is not a forecast; use it as a sensitivity to see which band of the market benchmark your own 8-days-out figure falls into.
Where estimated settled ADR stands — Settled August fell YoY in three categories; only business hotels rose (+2.8%)
To put the occupancy pace in a rate context: for August 2026, the most recent month with settled values, Hyogo’s estimated settled ADR fell year on year in three categories—city hotels ¥13,400 (−8.7% YoY), ryokan ¥20,200 (−7.0%) and resorts ¥24,500 (−8.5%). Business hotels, at ¥8,100 (+2.8%), were the only category in positive territory. This pattern of city hotels running below last year while business hotels hold firm has persisted since the settled months of the first half; the month-by-month trend is set out in our article tracking Hyogo’s estimated settled ADR YoY for settled months. As the previous sections showed, October Saturdays had already reached around 80% by 15 days out, so the occupancy side is lining up support for rates.
| Category | Aug 2025 (settled) | Aug 2026 (settled) | YoY | Oct 2025 (settled) | Oct 2026 (estimate based on current sales) |
|---|---|---|---|---|---|
| City hotels | ¥14,632 (N=47) | ¥13,366 (N=47) | −8.7% | ¥13,945 (N=47) | ¥15,567 (N=47) |
| Business hotels | ¥7,884 (N=168) | ¥8,104 (N=167) | +2.8% | ¥7,657 (N=167) | ¥10,688 (N=162) |
| Ryokan | ¥21,684 (N=275) | ¥20,172 (N=277) | −7.0% | ¥18,936 (N=273) | ¥17,759 (N=279) |
| Resort hotels | ¥26,808 (N=52) | ¥24,538 (N=51) | −8.5% | ¥19,620 (N=50) | ¥20,555 (N=51) |
Source: Compiled by HotelBank Editorial Team from MetroEngines Research data. N is the number of properties covered. October 2026 is an estimate based on current sales and may change.
For October, last year’s settled values were city ¥13,900, business ¥7,700, ryokan ¥18,900 and resorts ¥19,600. The October 2026 values are estimates based on current sales, and a straight comparison with settled values must wait until the month closes. We therefore do not calculate YoY here; the figures are shown alongside as a guide for checking where your own October rates sit against last October’s settled level.
For revenue managers running hotels and ryokan in Hyogo — Implications and action plan
1. Re-check “holiday weekends are strong” by category.At the same 15 days out, ryokan and resorts were 5.4pt higher on the first day of the three-day weekend, whereas city hotels differed by just 0.3pt and business hotels were 2.6pt higher on the regular Saturday of October 17. If an urban property concentrates sales restrictions or aggressive terms on holiday dates only, it is worth reviewing whether the same treatment should extend to October 17.
2. Matching your booking pace against the market at “three checkpoints” is effective.The October 17 market moved from 76.0% → 79.7% → 85.7% for city hotels and 65.2% → 73.8% → 81.6% for business hotels. Being below the market at 45 days out is not necessarily a lag in categories that pick up late, such as business hotels and resorts. Ryokan, conversely, are a market that reaches 75.0% at 45 days out, so falling behind at that point leaves little time to recover.
3. For ryokan, watch the sold-out property rate rather than estimated OCC.For ryokan stays on October 17, 2026, the sold-out property rate at 15 days out was 37.4% against estimated OCC of 83.7%, a phase in which nearby properties are ending sales one by one. If you still have inventory, its scarcity rises as competitors’ options shrink, so a plan to sell out the remaining rooms carefully is worth considering rather than loosening terms toward arrival.
4. How to treat Sunday depends on category.For resorts the gap to Saturday at 16 days out is only 1.0pt, leaving room to design Sunday as an extension of Saturday. For business hotels the gap has widened to 7.0pt, and the Sunday sold-out property rate was 2.7%. Consider moves that spread Saturday-concentrated demand into Sunday by building multi-night stays from Saturday or Sunday-start stays.
| Horizon | Action | Decision trigger (figures in this article) | Aim |
|---|---|---|---|
| Today to this week (for 10/10) | Review sales terms on remaining inventory and rebalance one-night-only allocations against multi-night allocations | If your 10/10 sell-through is above the 8-days-out market level (ryokan 91.7%, city 90.0%, resorts 89.2%, business 85.7%) | Check room to steer remaining rooms toward multi-night demand for 10/11–12 |
| Properties with inventory left should check nearby sales closures daily | If you have inventory while the sold-out property rate has reached 55.3% for ryokan and 43.9% for resorts | Understand where your inventory stands as options shrink | |
| By October 10 (for 10/17–18) | City and business hotels: add 10/17 to the same managed-date list as the holiday weekend’s first day | The market at 15 days out is city 85.7% and business 81.6%, matching or beating 10/10 at the same 15 days out (86.0% and 79.0%) | Avoid leaving revenue on the table by treating it as a regular Saturday |
| Build two-night 10/17–18 stays and link Sunday sell-through to Saturday | If your Saturday-to-Sunday gap is larger than the market’s (business 7.0pt, city 5.8pt, ryokan 4.2pt) | Spread Saturday-concentrated demand into Sunday | |
| Toward November | Record your own sell-through at 45 and 30 days out for November Saturdays and compare it with this market curve | From 45 to 30 days out, the 10/17 market added resorts +11.8pt, business +8.6pt, ryokan +4.2pt and city +3.7pt. If your own pickup over the same window is lower | Catch shifts in pickup timing early |
| After October settles, compare your ADR with the market’s estimated settled ADR | How your October results moved against last October’s settled market values (city ¥13,945, business ¥7,657, ryokan ¥18,936, resorts ¥19,620) | Carry rate design for high-occupancy days into the next peak month |
Source: Compiled by HotelBank Editorial Team from MetroEngines Research data.
Summary — Three yardsticks for reading October weekends
Pulling this together, October weekends in Hyogo can be read with the following three yardsticks.
| Yardstick | This observation | How to read it |
|---|---|---|
| When pickup happens | Category spread for 10/17: 13.3pt at 45 days out → 6.5pt at 15 days out. Business (+16.4pt) and resorts (+16.5pt) caught up late | A level gap at 45 days out does not mean a level gap close to arrival |
| How the holiday works | At the same 15 days out, the first day of the three-day weekend was +5.4pt for ryokan and resorts, +0.3pt for city, −2.6pt for business | The calendar effect shows up in leisure categories; check urban categories date by date |
| How Sunday drops | Gap to Saturday at 16 days out: business 7.0pt, city 5.8pt, ryokan 4.2pt, resorts 1.0pt | For resorts, Sunday absorbs Saturday overflow; for business hotels, there is room to steer toward multi-night stays |
All three stay dates are still ahead, and estimated OCC will keep moving until arrival. Even so, by lining up your property against the market at the three checkpoints—45 days out, 30 days out and the latest—you can later pinpoint on which day and in which window a gap opened. The pattern drawn from these three October dates should serve directly as a yardstick when planning November weekends in the autumn-foliage season.
Frequently Asked Questions
Q. Which categories are booking up for Hyogo’s October three-day weekend (October 10)?
A. Estimated OCC (OTA-listed inventory basis) observed on October 2, 2026 (8 days before arrival) was 91.7% for ryokan, 90.0% for city hotels, 89.2% for resort hotels and 85.7% for business hotels, with all four categories within a 6.0pt band. The sold-out property rate has reached 55.3% for ryokan and 43.9% for resorts.
Q. Is the first day of the three-day weekend fuller than a regular Saturday?
A. It depends on the category. Aligning both dates at 15 days out, ryokan and resorts are 5.4pt higher on October 10, the first day of the three-day weekend, than on October 17, whereas city hotels differ by 0.3pt and business hotels are 2.6pt higher on October 17.
Q. How much lower is Sunday, October 18 than Saturday?
A. The Saturday-minus-Sunday gap at the same 16 days out is 7.0pt for business hotels, 5.8pt for city hotels, 4.2pt for ryokan and 1.0pt for resort hotels. For resorts, Sunday is pacing almost level with Saturday.
Q. Do neighbouring prefectures show the same pattern?
A. Only partly. The absence of a holiday lift for urban categories (city and business hotels) is seen in Osaka and Hyogo, while in Kyoto and Okayama business hotels are also higher on the first day of the three-day weekend. Hyogo’s Sunday drop was shallower than that of Osaka, Kyoto, Okayama and Tottori.
Q. Is estimated OCC the same as actual room occupancy?
A. No. It is estimated from the sell-through of inventory listed on OTAs and counts unlisted rooms as sold, so it runs higher than actual room occupancy. The coverage is a fixed cohort of properties that list at least 30% of their total rooms on OTAs.
About the Data
| Estimated OCC | Occupancy based on OTA-listed inventory = 100 − 100 × OTA-listed remaining rooms ÷ total rooms. Coverage is a fixed cohort of properties that list at least 30% of their total rooms on OTAs (the same set of properties for each stay date; N is that number). It is an estimate based on the sell-through of inventory sold on OTAs and is defined differently from actual room occupancy (it runs higher because unlisted rooms are counted as sold). Stay dates covered are October 10, 17 and 18, 2026; the observation window runs from 45 days before each stay date to October 2, 2026. |
| Booking curve | Based on observations from 45 days before the stay date up to the latest. In this article “latest” means the October 2, 2026 observation, which is 8 days out for October 10 stays, 15 days out for October 17 stays and 16 days out for October 18 stays. |
| Sold-out property rate | The estimated share of properties with no listed inventory visible on OTAs and similar channels. |
| Estimated settled ADR | The settled price level (tax-excluded equivalent) estimated from OTA and other sales data (lowest-plan level × category-specific factor, ensembled across multiple channels). Past months are settled values; current and future months are estimates based on current sales. The median error against published operating results is 6.6%. |
| Coverage N | Estimated OCC and booking curves (based on listings on major booking sites): city hotels N=24 properties / 3,727 rooms, business hotels N=74 properties / 9,038 rooms, ryokan N=179 properties / 3,744 rooms (10/10), 3,746 rooms (10/17), 3,720 rooms (10/18), resort hotels N=41 properties / 1,778 rooms. Estimated settled ADR (August 2026): city hotels N=47, business hotels N=167, ryokan N=277, resort hotels N=51. |
| Data as of | Data as of: October 3, 2026. Sales and inventory change daily, so the figures in this article are a snapshot at the time of retrieval. |
Source: Compiled by HotelBank Editorial Team from MetroEngines Research data.
■ Data sources
Daily observations of room inventory and selling prices listed on major booking sites (MetroEngines Research). Estimated OCC and the sold-out property rate are from fixed category cohorts in Hyogo, Osaka, Kyoto, Okayama and Tottori; estimated settled ADR is from monthly category aggregates for Hyogo (settled months and current estimates). Observation dates: August 26 to October 2, 2026.
■ Calculation assumptions
The comparisons in Tables 3 and 5 are differences between values at the same lead time (differences of the displayed values). The 8-days-out benchmarks in Table 6 are a sensitivity that multiplies the 15→8-days-out pickup for October 10 stays (city +4.0pt, business +6.7pt, ryokan +2.6pt, resorts +4.6pt) by 0.5, 1.0 and 1.5 and adds it to the value for October 17 stays at 15 days out, capped at 100%.
■ Limitations and caveats
Estimated OCC is based on OTA-listed inventory, is defined differently from actual room occupancy, and counts sales stops as sell-through. In categories with fewer than 30 properties (Hyogo city hotels, Osaka ryokan, Okayama ryokan/resorts, Tottori business hotels), one property can move the whole figure. Table 6 is a calculation applying the holiday-weekend first-day pickup to a regular Saturday, not a forecast. Estimated settled ADR for October 2026 is a pre-settlement value.